In our introductory article, we talked a bit about why DXOMARK has developed its Battery testing protocol, and we described in general terms the kinds of tests we perform so as to score smartphone battery performance for autonomy (how long a charge lasts, a.k.a. battery life), charging (how long it takes to recharge), and efficiency (how effectively the device manages its battery during charge up and discharge). In this article, we will take a deeper dive into some of the specifics of the equipment our engineers use and the procedures they follow for testing — in other words, we’ll be taking a look at how we test batteries.
Let’s begin with an in-depth description of the equipment we use, after which we’ll explain more about the specific test routines and use cases we base our scores on.
Autonomy (battery life): One cage, some robots, and humans
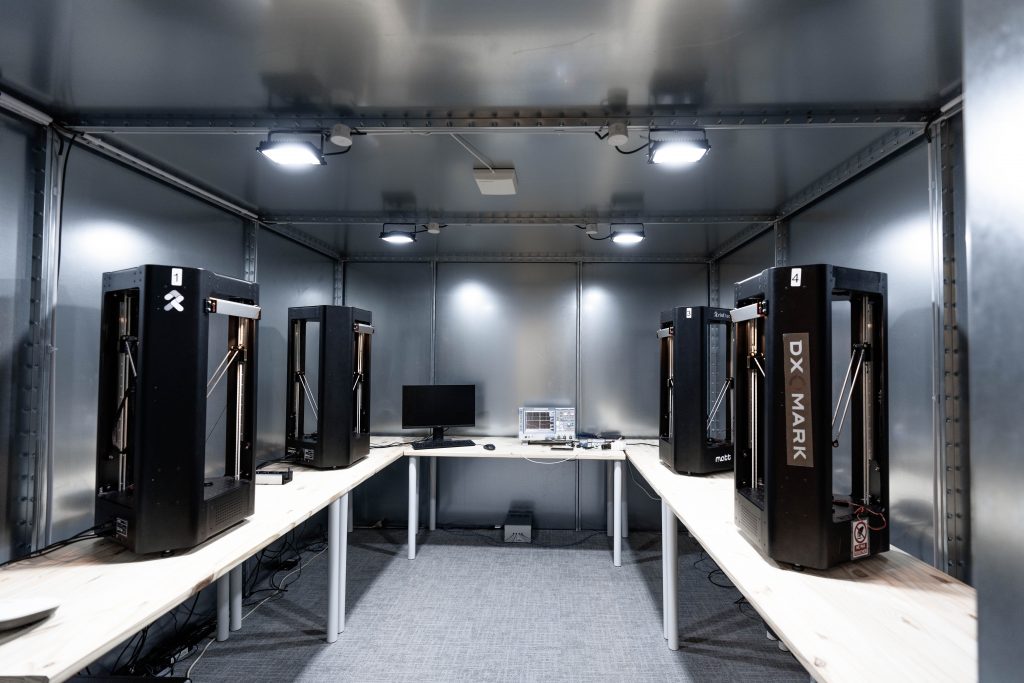
The latest among DXOMARK’s laboratories is the one dedicated to battery testing, a major component of which is our Faraday cage. The walls, ceiling, and floor of this room is composed of 2 mm-thick steel panels, which serve to isolate smartphones from external networks and other disturbances that could affect measurement precision and repeatability. Inside the Faraday cage, a WiFi access point and a cellular repeater provide stable connectivity. An outdoor antenna located on the rooftop of our building receives a signal from French network operator Orange, and our network repeater amplifies it to a pre-defined level and disseminates it inside the cage via the in-cage antenna (–100 dB for 4G, –80 dB for 3G, and –70 dB for 2G).
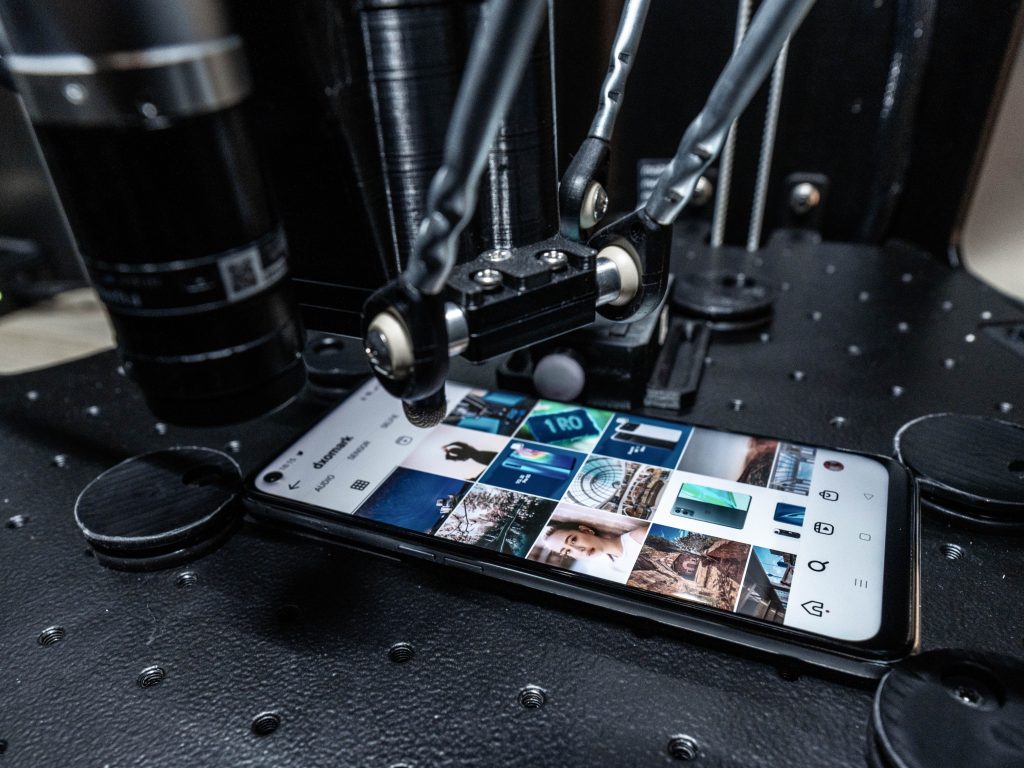
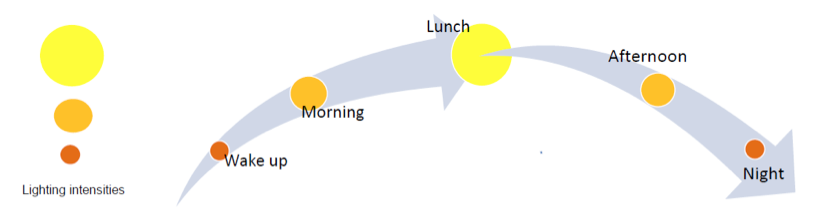
So far, we have an array of four touch-robots inside the Faraday cage that we use in two of our three major autonomy test routines, stationary and calibrated use case. In addition to their touch functions, which are programmed to use the same gestures as humans to interact with smartphones (scrolling, swiping, tapping), they are equipped with computer vision so they can recognize the various app icons, keyboards, and even react to intrusive popup messages. Further, each robot is equipped with a lighting system that reproduces lighting conditions at home, outside, and at the office. The intensity and the color temperature vary depending on the time of the day, and this forces the phone to adapt and adjust its brightness (which can have a significant impact on power consumption).
Robots are equipped with simple push-button actuators to wake up the screen before each test case, or from time to time just to mimic quick checks of notifications or of time during the day. Four of our robots work simultaneously and are controlled by a sequencer, which triggers all test routine events and the lighting system. We use a fifth robot to run a setup wizard before the test routine begins to verify that the other robots properly recognize each icon and that their gestures are adapted to the specific UI (icon design, gestures, screen size, layout) of the device under test.
We test phones using their default settings out of the box; the only thing we deactivate is 5G because our lab is not covered yet and devices supporting 5G connectivity would be negatively and unfairly impacted otherwise. (We will add 5G measurements to our protocol as soon as our lab has coverage.)
In our stationary typical usage scenario, the smartphones start from a full battery charge and our robots run through a precisely defined 24-hour cycle of activities and then repeat it until the phones’ batteries are completely depleted (that is, when the phones switch themselves off). The system monitors the battery gauges at every stage of the cycle to measure how much battery power has been consumed and what percentage of battery power is actually left.


The 24-hour scenario includes 4 hours of screen-on time per day, which research indicates is the average time of use around the world, and multiple types of activities: social and communications, music and video, and gaming, among others, using the latest versions of some of the most popular applications here in Europe, where our lab is located. (And speaking of our location, please note it is possible that some test results will vary if conducted elsewhere because of differences in network quality, available applications, and so on.)
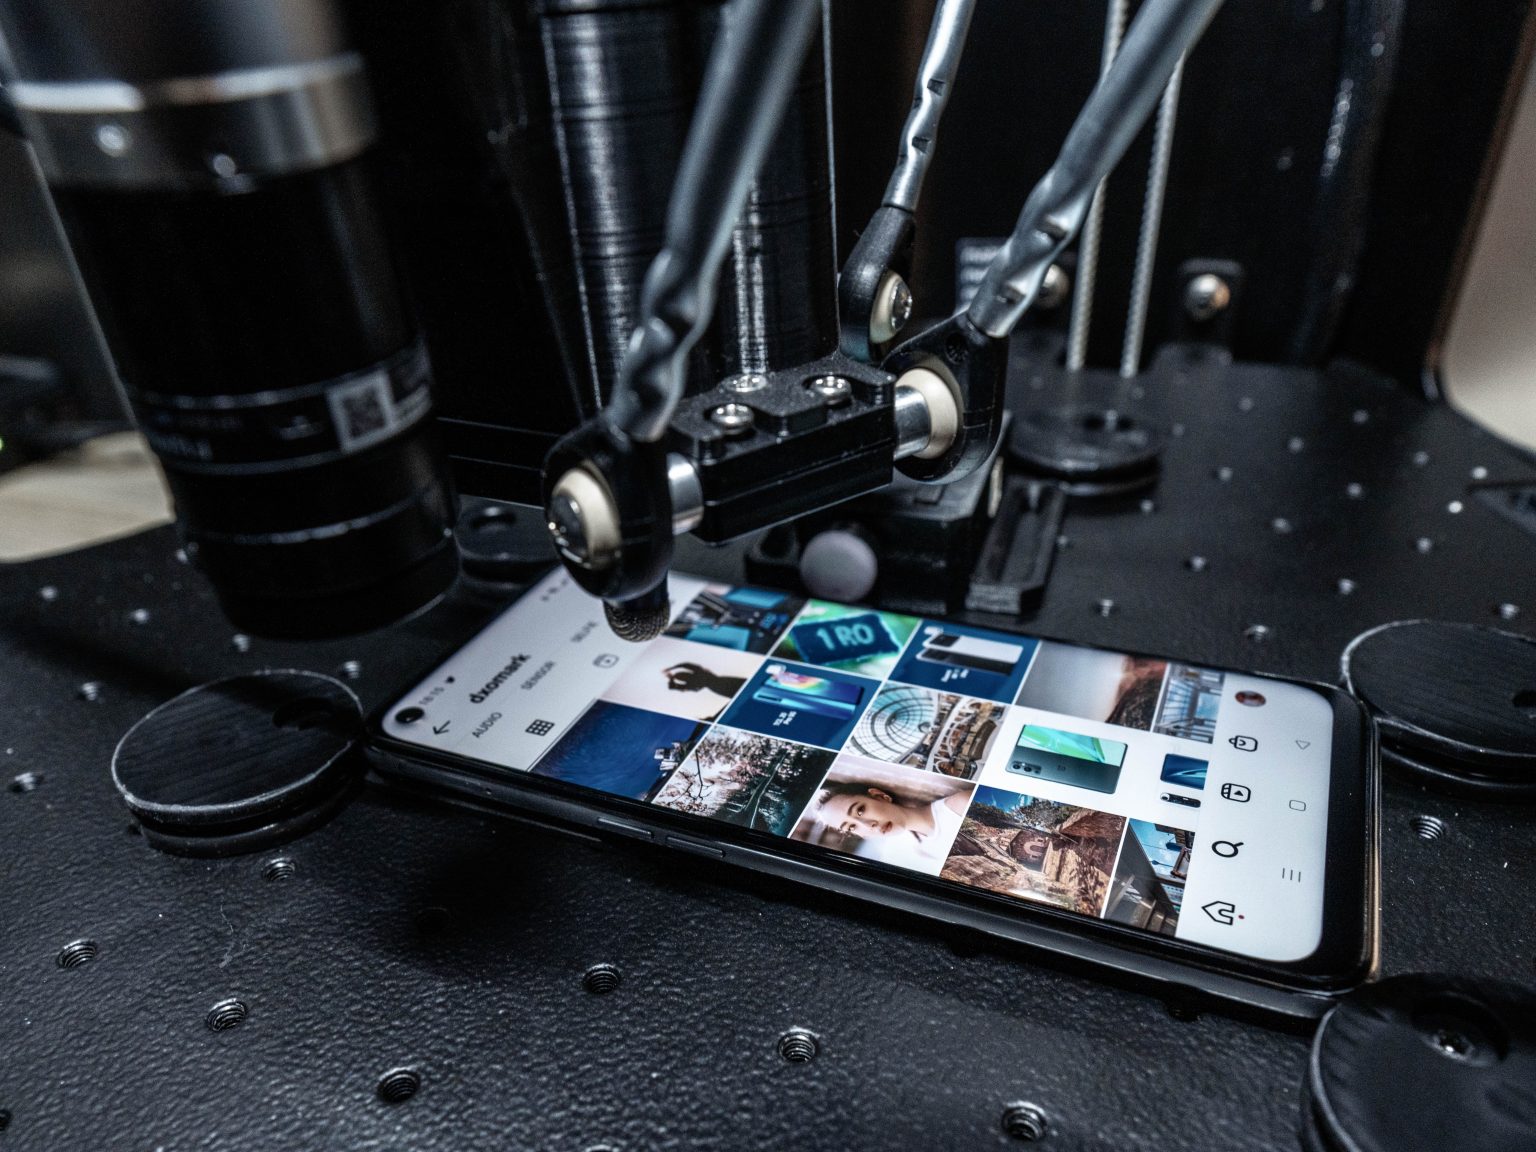
 The DXOMARK robots at work.
Mobile phones are, well, mobile, so we include an array of tests to see how smartphone batteries are affected when we are “on the go.” Just as for our stationary robotic testing, we set all phones to their default settings, though we deactivate WiFi and 5G. We bring along a reference phone (always the same one) to help us take into account fluctuations in weather, temperature, etc.
Our on the go tests include the kinds of activities people often do when commuting on public transport, such as making phone calls and browsing social apps; and we also test activities when traveling in a car (GPS navigation for example), and when on foot (streaming music, shooting photos and videos). We start each test case at different checkpoints along the route and run it until the next checkpoint, where we measure its consumption before starting the next test.
For our calibrated use case tests conducted back in the Faraday cage, we have our robots repeat sequences of activities that belong to a particular use case. Here are our current set of use cases:
-
- Video streaming (in cellular & Wi-Fi)
- Video playback
- Music streaming
- Gaming
- Calls
- Idle
“Calibrated” refers to the fact that we use the same settings and application parameters for each phone we test — for example, we set display brightness to 200 cd/m2; we measure sound coming from the phone’s speaker at a distance of 10 cm; we set the phone speaker volume level to 60 dB; we ensure that the ambient lighting conditions are the same. And then we measure how much power each of these activities consumes so that you will have an idea of how much time you will have to (for example) play an intense video game or how many hours of music you’ll be able to listen to.
The results of these three autonomy test categories will let you know how much battery life (in dd:hh:mm) you can expect from a given smartphone, including how much power it loses overnight when you’re not actively using it, and how much power specific kinds of activities consume. Going further, we’ve been able to devise 3 different autonomy profiles based on the results of our typical usage scenario and on-the-go test cases: light, moderate, and intense. In our estimation, light use means 2.5 hours of active use per day; moderate means 4 hours of active use; and intense means 7 hours of active use. These profile estimates are intended to give you a better idea of the kind of autonomy you can expect based on how much you use your phone.
Charging
As you may recall from our introductory article, our Charging score is based on two sub-scores, full charge and quick boost. When conducting these tests, we either use the official charger and cables provided with the phone or buy a recommended charger from the manufacturer’s official website.

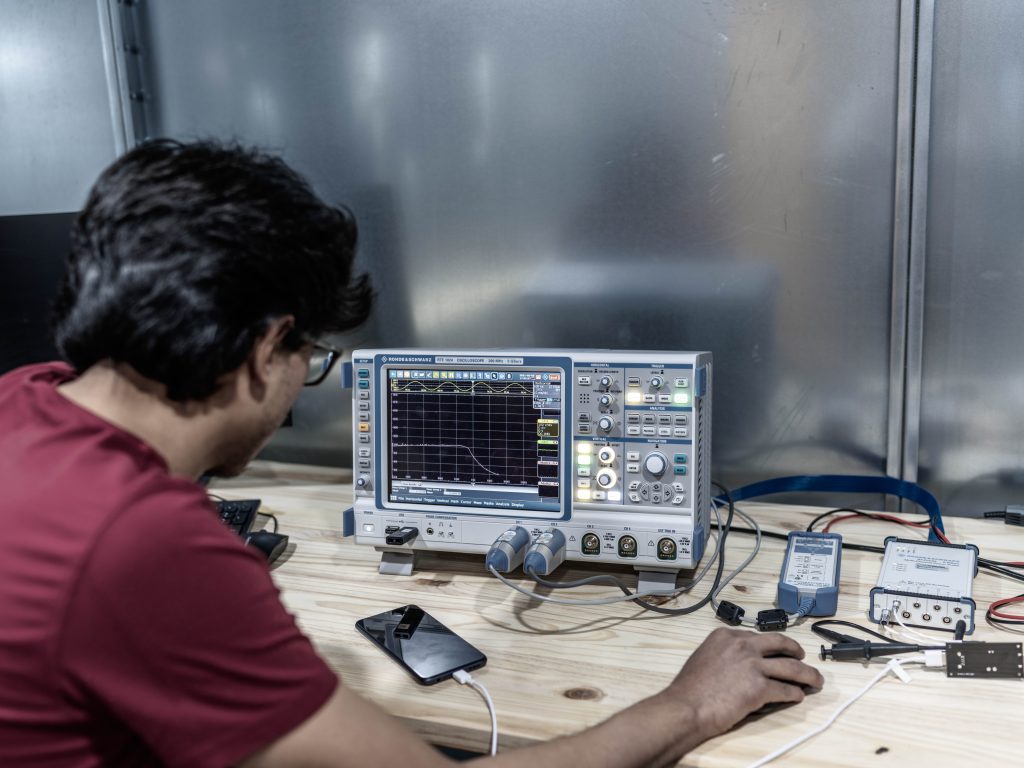
We use a Rohde & Schwartz RTE 10124 oscilloscope with current and voltage probes to measure both primary and secondary power over time. (Primary power is the energy taken from the wall outlet before it enters the charger; secondary power is the energy the charger delivers before it enters the smartphone.)
After we fully deplete the smartphone’s battery, we measure how much power and time it takes for the phone to charge from zero to full charge, as indicated by our probes. We also indicate when 80% of a full charge is reached, as well as the time when the battery indicator says 100%. We deduct points depending on how much power is added to the charge after the smartphone gauge indicates 100%.
We also measure the speed of wireless charging for those devices equipped with that feature.
In our quick boost tests, we measure the power gained from plugging in a smartphone for five minutes at various levels of the battery’s charge— 20%, 40%, 60%, and 80%, as how much charge the battery has left can make a significant difference how much power it takes on in that short time.
In another test, we play Asphalt 9 from Gameloft for a minimum of 20 minutes until the battery gauge indicates that 5% battery is left, and then we plug the phone to a charger to check on how much and how quickly power is drawn from the wall outlet. This helps us check the impact of intense gaming on the phone, as phones that are hot from heavy use take a charge differently than phones that are not.
Linearity
One other aspect of our Charging tests focuses on how accurate a smartphone’s battery power indicator or gauge is. It’s long been known that the battery percentages shown on the display user interface do not always accurately reflect the exact amount of power remaining in the battery. This can mean that two phones with the same size battery and whose gauges indicate 10% power remaining may run out of power at very different times.
To measure battery linearity, we have designed a use case that drains a constant amount of power from the battery. After fully charging the battery, we play a video displaying a white screen with no sound in full screen mode. The phones are set to airplane mode and put at their maximum brightness.
We perform this measurement twice for each device. If the phone’s gauge shows 20% battery life remaining, but the actual power remaining is less than 20%, we deduct points from its score, because there is nothing more frustrating than seeing your precious last 20% battery percentage quickly collapse!
Efficiency
Our Efficiency score is partly based on measurements of a charge up — that is, the ability to transfer power from a power outlet to a smartphone, and how much residual power is consumed after the phone is fully charged and when detached from the charger, as measured with our probes and oscilloscope.
Let’s take the example of a 5000 mAh battery with a nominal voltage of 4V. We consider that the typical energy capacity of this battery is 20 Wh (Watt-hours = 5 Ah x 4V). In our Charging test plan, we measure the power drawn from the power outlet for a full charge. Let’s say we measure 25 Wh, which means the battery has an efficiency of 80% (battery has stored 20 Wh divided by the 25 Wh cost of energy).

In our initial reference database, the Charge up efficiencies we measure range from 65% to 81.5%. When our tested smartphones are fully charged but still plugged in to the charger, residual power consumption ranges from 80 mW to 500 mW; and when the smartphones are unplugged from the charger, but the charger is still plugged into the outlet, residual consumption ranges from 20 to 94 mW.
We also calculate the Discharge efficiency, which is the ratio of battery capacity divided by the results from our stationary and calibrated use case Autonomy sub-scores.
Why do we rate efficiency? While the impact of your smartphone on the electricity bill is negligible compared to heating or lighting, of course, if your smartphone is power efficient, a smaller battery will suffice (making your smartphone lighter and more compact). Good efficiency also demonstrates the quality of design and software robustness. In other words, an efficient device is better built.
Scoring
To briefly recap our scoring system (which we explained in more detail in our introductory article), we compute our overall Battery score from three sub-scores — Autonomy, Charging, and Efficiency. We calculate our Autonomy score from the results of three different kinds of tests: stationary, on the go, and calibrated use cases. Our Charging score takes into account full charge and quick boost results along with battery linearity. And finally, our Efficiency score is based on charge up (the efficacity of the adapter) as well as discharge (the overall power consumption measured in our typical usage scenario and in our calibrated use cases).
We hope this article has given you greater insight into the equipment we use and the tests we undertake to produce our DXOMARK Battery reviews and rankings.
DXOMARK encourages its readers to share comments on the articles. To read or post comments, Disqus cookies are required. Change your Cookies Preferences and read more about our Comment Policy.