Earlier we presented you with the key points of what we test and score in the DXOMARK Display protocol. In this article, we’ll provide a closer look at our process of testing smartphone displays. We will look at the tools and methods that we use to scientifically evaluate display quality attributes, which are based on specific use cases that reflect the ways in which people use their phones: web browsing, night reading, in-car navigation, taking photos, viewing photos, gaming, and watching movies, including how smoothly and efficiently a display’s auto-brightness function responds to changing light conditions.
Before we head into the main topic, it’s important to remember that smartphone display performance isn’t just about display panel quality. Smartphones embed software with dedicted algorithms to control many display functions, and manufacturers choose which settings to use with those algorithms (a process known as “tuning”). Of course, some algorithms are more efficient than others, and the way an algorithm is implemented on a smartphone can make a big difference in performance, as in these examples:
- Software determines how smartphones balance the trade-off between frame rate and battery usage; depending on the apps used, some phones automatically adjust the frame rate to extend a battery charge (and thus autonomy). What this means is that a smartphone with a refresh rate of 120 Hz does not always refresh the screen at 120 Hz (for example).
- Many smartphones include an ambient light sensor, a photodetector that gauges surrounding lighting conditions; tuning determines how quickly and appropriately the auto-brightness feature responds to the input from the light sensor, in addition to how well the display adapts to the content being viewed.
- When people watch videos on their phones, motion interpolation algorithms generate frames in between “real” (existing) frames with the aim of making animations or moving actions appear smoother, and again, the battery vs. frame rate trade-off can have an impact here. (We will visit algorithms again in some of our articles about specific display attributes. Read about the pivotal role software tuning plays in display performance here. )
DXOMARK conducts tests under many different (and sometimes changing) light conditions so as to recreate as closely as possible the real-world experiences of smartphone users, rather than just simply pitting display performance against “ideal” viewing conditions as defined in standards/norms.
Finally, as we head into our toolbox, just a short reminder that first, we test each and every display under the exact same conditions so as to ensure that our results are fair, scientifically rigorous, and repeatable. Second, apart from certain well-defined exceptions, such as color accuracy, we test devices using their default settings. And third, DXOMARK measurements differ from those of other sites in that we not only include lab-based objective measurements, but perceptual measurements as well.
Objective testing tools
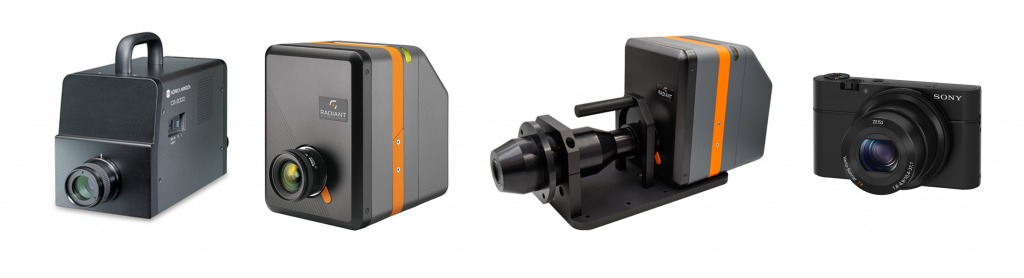
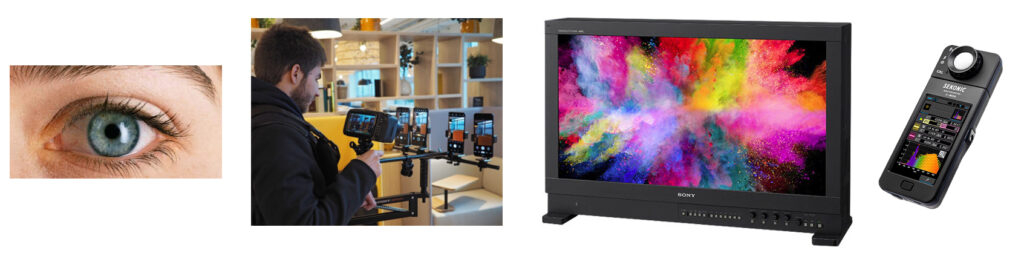
The images below show the array of tools our evaluation experts use when testing display light spectrum, color, luminance (brightness), contrast, uniformity, frame drops, and judder:
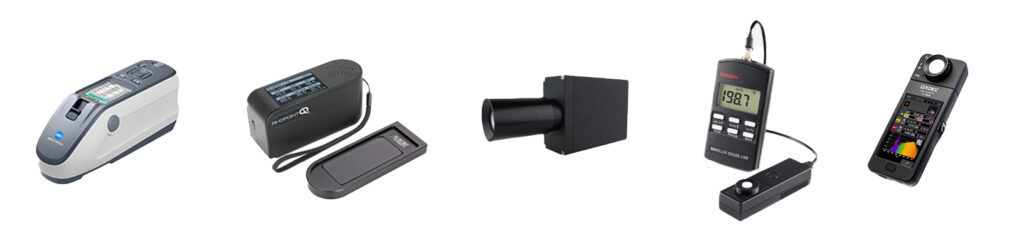
We use these tools to measure reflectance, gloss, flicker, and lighting conditions:
We use the tools below to measure touch responsiveness, accuracy, and smoothness:
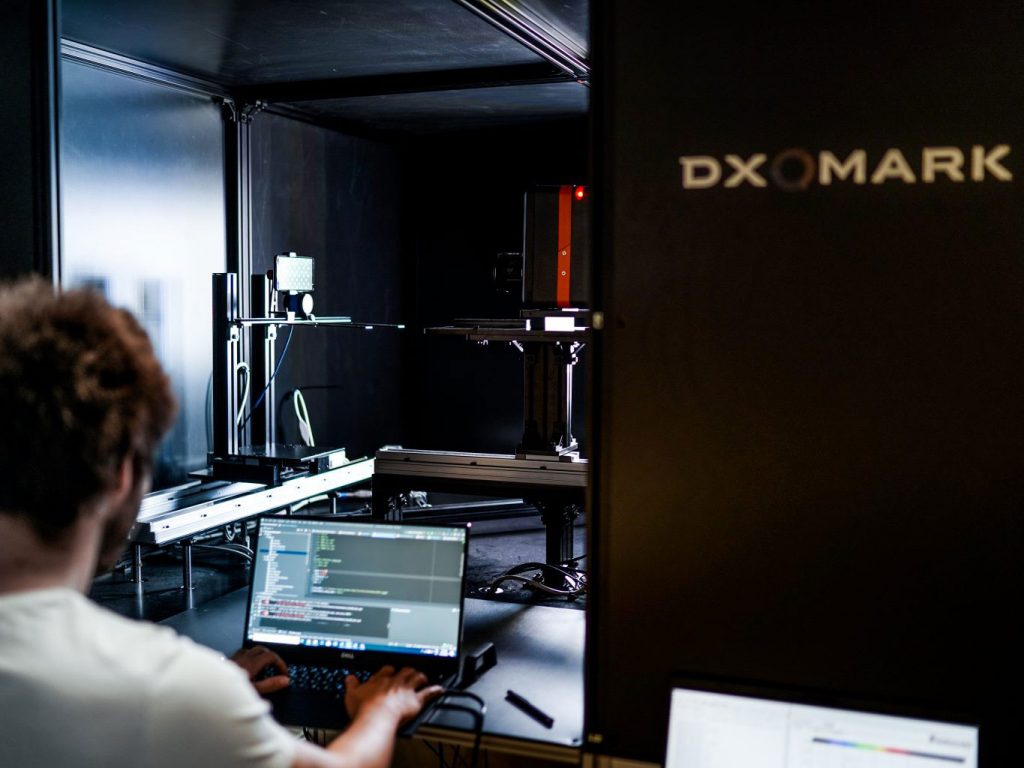
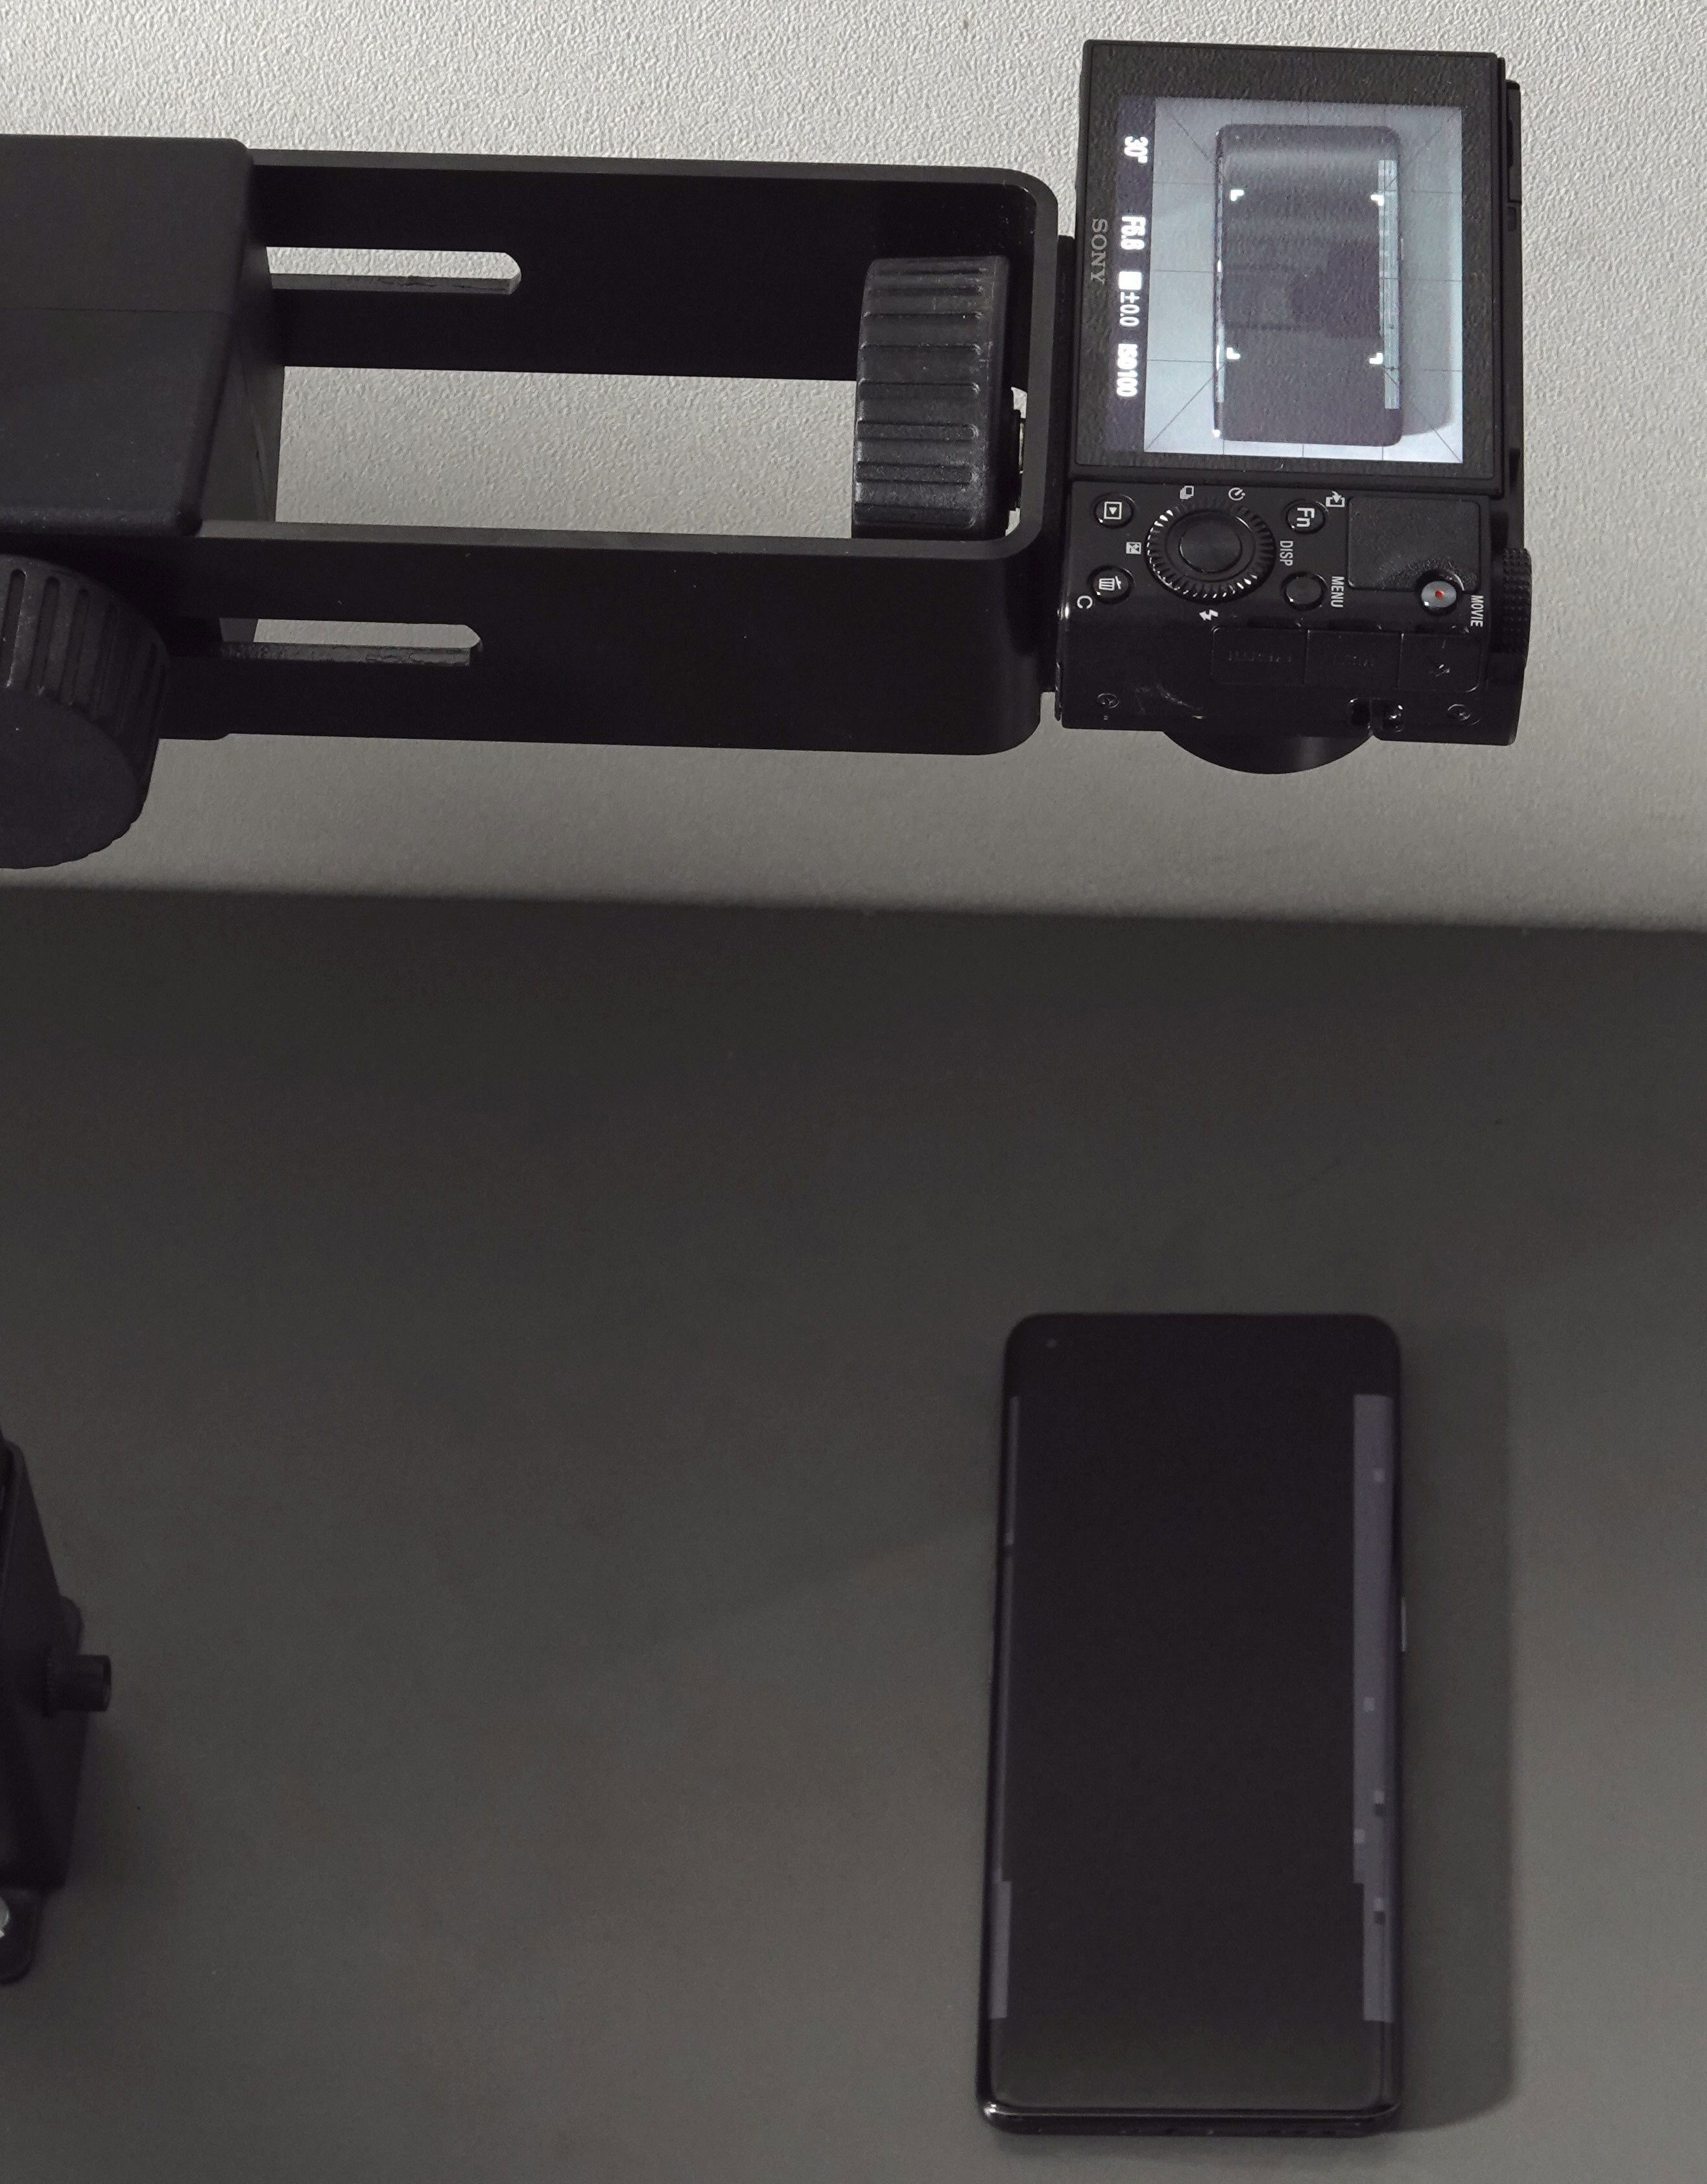
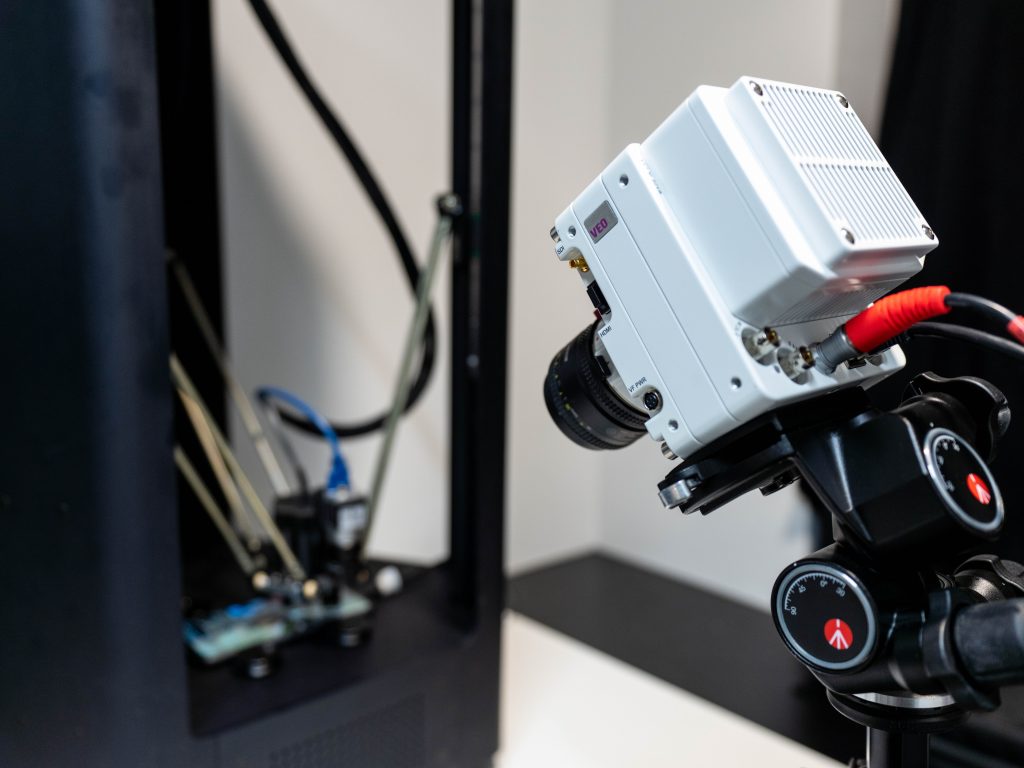
We conduct many of our objective tests within the DXOMARK Display Bench, which is a special testing chamber that facilitates testing automation and ensures that our engineers test all devices under the exact same conditions. It includes mounts for devices being tested and for testing tools (principally a spectroradiometer and a video colorimeter), computer-controlled LED lighting arrays to imitate all kinds of lighting types and brightness levels, and lux meters.
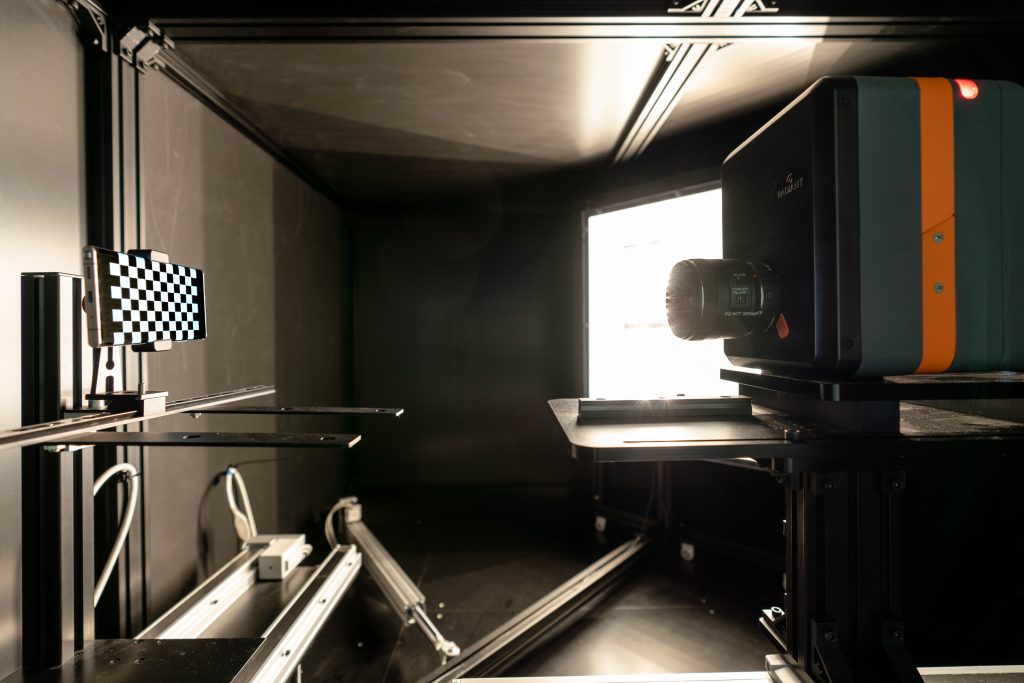
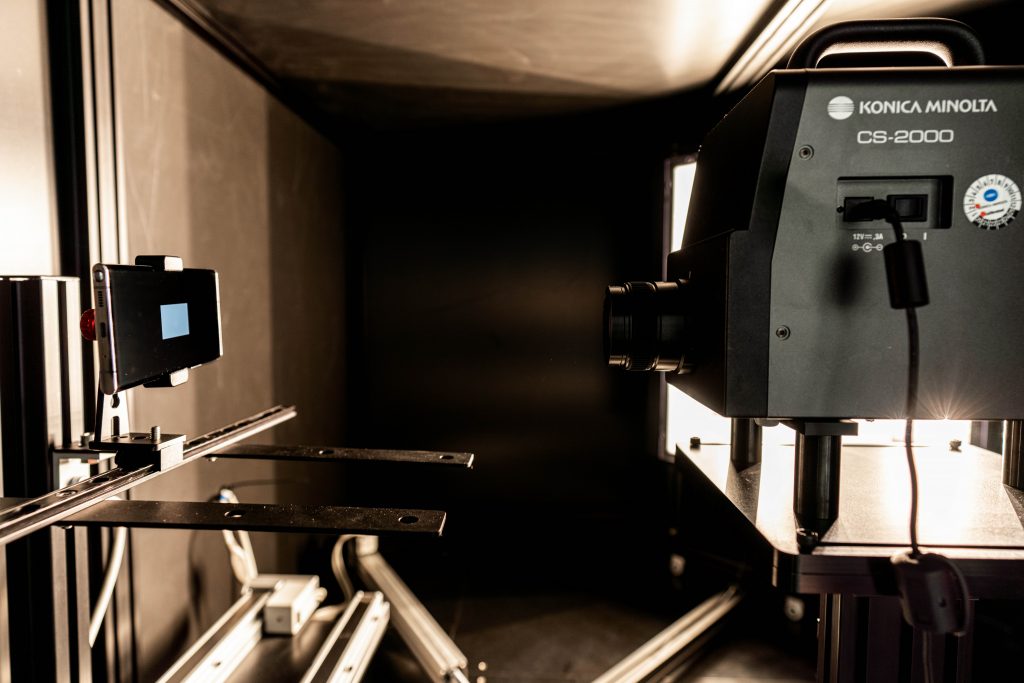
In both photos showing the inside of the DXOMARK Display Bench above, you can see a device under test (DUT) mounted on the left, with the testing instrument on the right mounted on a rail; testing engineers use computer-controlled servo motors to move the instrument to various distances from the DUT. During testing, the Bench is first sealed against any external light sources, and an engineer controls the tests via computer.
In addition to the Display Bench, we have developed a fully computer-controlled Dome System, which serves to reproduce more intense outdoor lighting conditions of up to 50,000 lux. The shape of the dome allows the very intense light to be diffused so that it hits the smartphone’s screen from all directions, in the same way that we experience lighting conditions outdoors. But the dome’s ability to reach extreme levels of brightness permits us to really challenge the limits of a device’s screen capabilities.
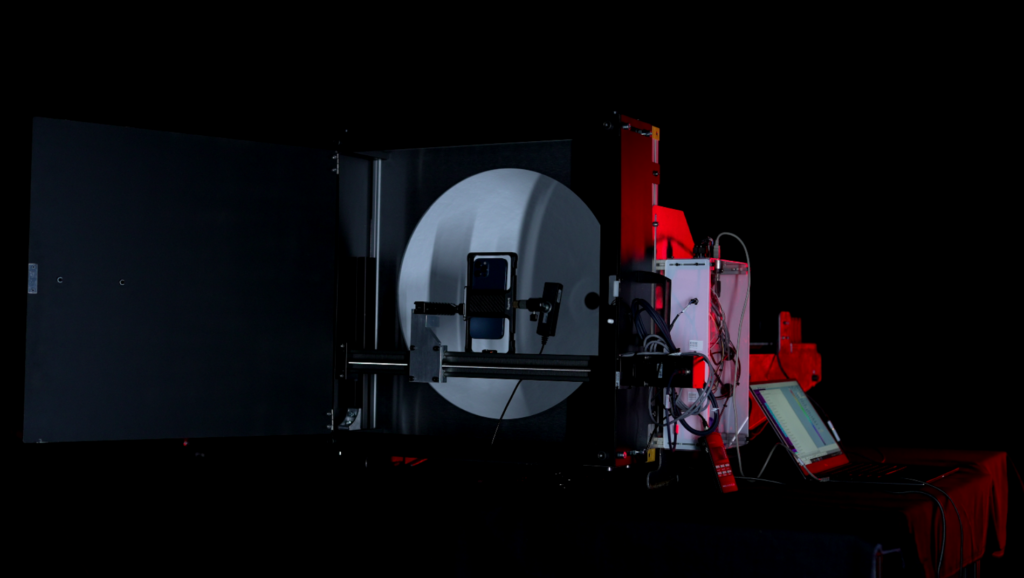
In the photo above, the DUT is attached to a rail within a chamber, with the screen facing the testing instrument. A lux meter sensor, which monitors the intensity of the light, is next to the DUT. The testing instrument, the Radiant imaging colorimeter, which is mounted on an external rail on the other side of the dome (not pictured), acquires contrast and brightness measurements through a hole at the top of the dome as the DUT’s screen displays testing patterns for measurement.
Every element of the system–the DUT, the motors (or modules) controlling the light levels, and the instrument– is controlled by a computer.
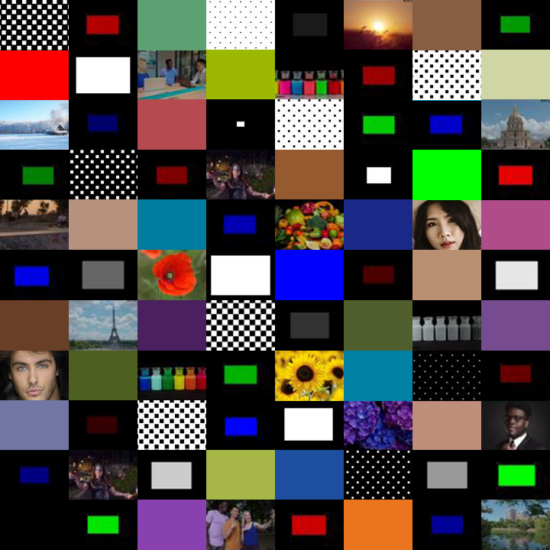
In the objective part of our testing, we measure color, contrast, luminance, reflectance, EOTF curve, etc. by displaying calibrated video and photo patterns on the device’s screen. The perceptual part of our testing involves playing a set of videos that we have produced and mastered, enabling a repeatable evaluation using real content in SDR and HDR formats.
Perceptual testing tools
One of the most important tools DXOMARK relies on for its perceptual testing is the human eye. Our perceptual tests confirm and complement our objective tests, in that we want to be sure that we can see in real life what the objective measurements are telling us. Further, objective tests measure only what they are strictly aiming to measure. Given the complexity of the software driving the display as well as the complexity of the human visual system, perceptual tests are an essential ingredient in evaluating display quality.
Our Display protocol engineers receive careful and extensive training before conducting any perceptual tests, some of which involve closely evaluating multiple devices (a DUT and two or three comparison devices) against reference images displayed on a professional monitor. The color and brightness values of each carefully chosen image on the pro display have been precisely calibrated and measured. When making comparisons, engineers follow a very strict and scientifically sound protocol that requires conducting the test multiple times using different engineers each time to avoid any bias.
Our engineers perform all perceptual evaluations by looking directly at the device’s display. We take photos only to use as illustrations, but never use them as a basis for any kind of test or evaluation.
Display protocol tests
The tables in each sub-section below cover all of the attributes that the DXOMARK Display protocol currently tests, and include information about the equipment we use, some of the testing conditions, and some of result parameters and definitions.
Readability
In our reviews, we regularly remind people that the most important consideration for end-users is how easily and comfortably they can read the display under different real-life conditions. DXOMARK uses its Display Bench and its dome system to recreate ambient light conditions ranging from total darkness to bright daylight (0, 25, 250, 830, 20 000, 50 000 lux).
Objective measurements done in the lab are always completed with perceptual evaluations, allowing us to assess the device’s performance in real-life situations.
Below is a sample graph of comparison data showing brightness/contrast measurements for three devices:
In the example above, you can see how the measured contrast in daylight conditions does not live up to the claimed contrast values of 1:1,000,000 (or infinite), which are based on measurements taken in dark conditions (< 0.01 lux). Our measurements show what users experience — that is, it hard to read our screens in sunlight.
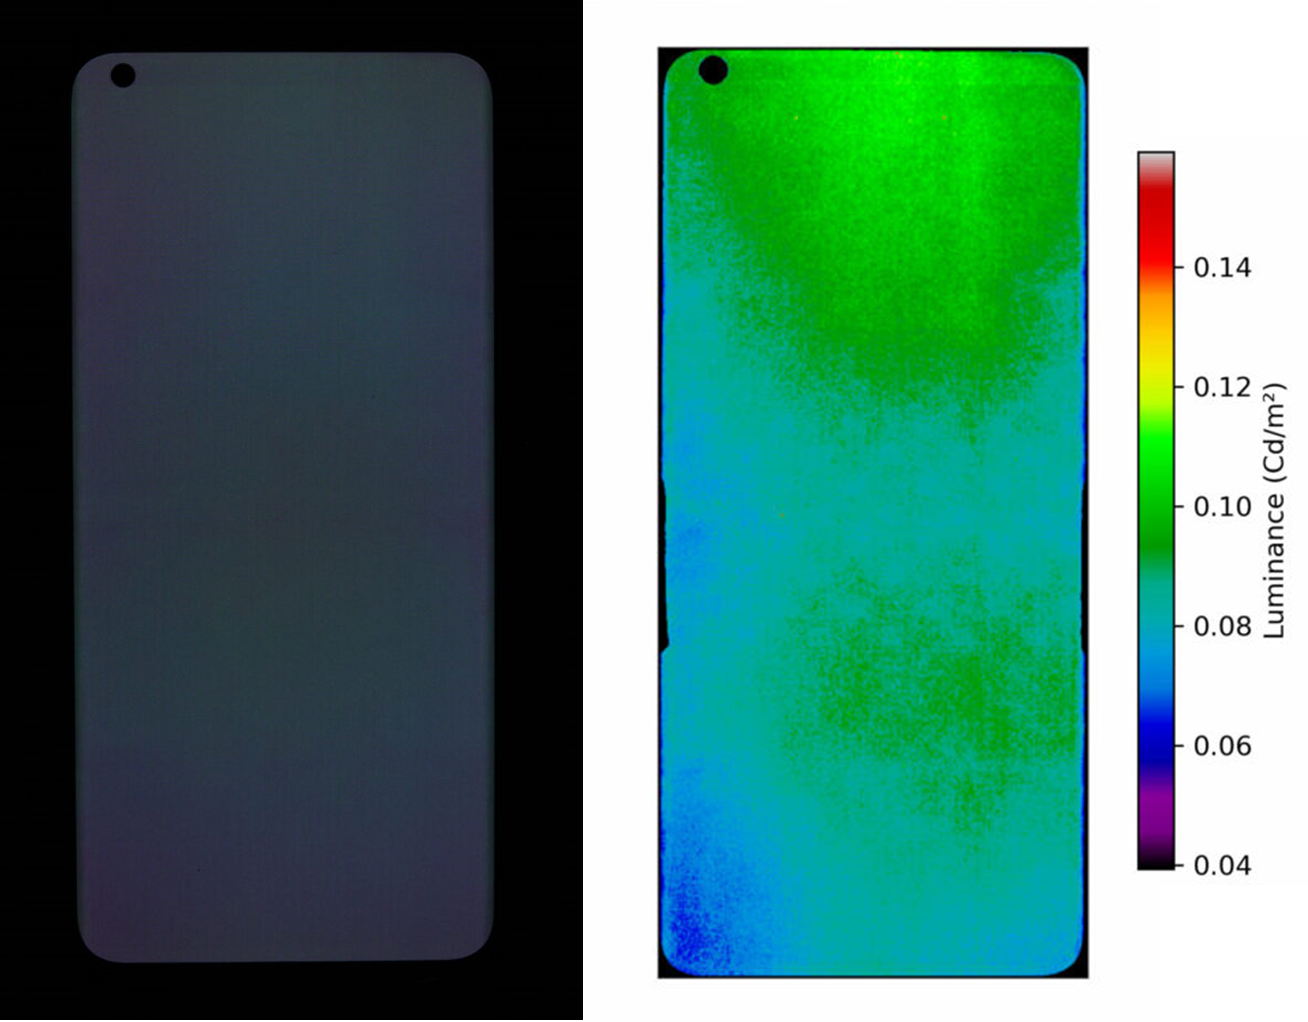
Another test of display readability measures the homogeneity or uniformity of brightness output, as shown in the illustrative image below:
Our readability tests also include looking for things that affect readability and the user experience, such as artifacts, mainly flicker and reflectance.
Flicker is a phenomenon associated with the temporal modulation of light, the quick oscillation of light output between on and off on a screen. All screens have temporal light modulation to some degree because of the interaction between the screen’s refresh rate (whether 60 Hz, 90 Hz or 120 Hz) and Pulse Width Modulation (the power that turns the light on and off for a certain duration.) Flicker relates to temporal modulation frequencies inferior to 90 Hz .
Flicker is known to create unease, eye fatigue, or in the most extreme cases, seizures. Additionally, its impact varies considerably among individuals; some people are even able to perceive the modulation. The effect of flicker tends to be stronger under dim environments as the screen and our eyes adapt to the darker light.
That’s why this measurement is important for assessing display comfort.
DXOMARK measures the behavior of a smartphone’s flicker in order to assess flicker perception. For our Eye Comfort label, the detection probability of flicker should be below 50%, in default mode or with the anti-flicker mode activated (if available).
For example, flicker tests reveal that slow pulse-width modulation (PWM) can have an impact on visual comfort even for devices with a high refresh rate. (In the graph below, the first spike corresponds to the refresh rate, and the highest spike corresponds to the PWM.)
Reflectance is an artifact that affects readability. Smartphone screens are reflective by nature. But the degree to which they reflect light affects the user experience. Reflectance impacts the contrast of the content being displayed.
To give you an example, the reflection from a simple glass sheet is around 4%, while it reaches about 6% for a plastic sheet. Although smartphones’ first surface is made of glass (or plastic for foldables), their total reflection (without coating) is usually around 5% (or higher) due to multiple reflections created by the complex optical stack that is sometimes coated with an anti-reflection layer.
To determine the device’s reflectance, we measure the reflected light intensity as a function of wavelength over the visible spectrum (400 nm to 700 nm). We use a spectrophotometer in SCI (Specular Component Included) mode to perform reflectance level measurements on smartphone displays when turned off. The SCI mode measures both the diffuse reflection and the specular reflection.
We then calculate the average based on the measurements within the visible color spectrum.
We also use our spectrophotometer in SCI (Specular Component Included) mode to perform reflectance level measurements on smartphone displays that are turned off. Below are measurements that show the reflectance level for each 10 nm-spaced wavelength within the visible spectrum range (400 nm to 700 nm).
Average reflectance is computed based on the spectral reflectance in the visible spectrum range (see graph below) and human spectral sensitivity.
| Readability
Unless specified otherwise, all tests are conducted at light levels ranging from 0 to 50,000 lux and using white color temperature/spectrum tungsten, white LED, D65 color illuminants, etc. |
||
| Sub-attribute | Equipment | Remarks |
| Vs. ambient lighting | Bench + spectroradiometer (brightness, given as cd/m2) + video colorimeter (contrast, given as :1) Light levels: 0,25,250,830 lux
Dome + |
Brightness should adapt to viewing conditions; screen content should be readable in any condition and be as close as possible to original intent. |
| Vs. average pixel level | Bench + spectroradiometer (brightness) + video colorimeter (contrast) at 20,000 lux
Dome + spectroradiometer (brightness) + video colorimeter (contrast) at 20,000 lux and 50,000 lux |
Neither brightness nor contrast should change with APL. |
| Brightness vs. time | Light booth with changing lights and brightness levels. Light levels: 0 and 830 lux | We investigate reaction time, smoothness, transition time |
| EOTF* | Bench + spectroradiometer | Tested under various light conditions (0, 830, 20,000 lux) at 20% APL; the closer to the target value of gamma, the better. |
| Uniformity | Video colorimeter + standard lens | Tested at 0 lux; results are given as a percentage (the higher, the better). |
| Vs. angle | Video colorimeter + conoscope | Tested at 0 lux; the lower the loss of brightness, the better. |
| Screen reflectance | Spectrophotometer (+glossmeter with display off) | A reflectance result of under 4% is considered good. |
| Flicker | Flickermeter | Flicker frequency corresponds to the highest peak on the graph. The higher the frequency, the better. |
*EOTF stands for Electro-Optical Transfer Function, which converts an electronic signal into a particular level of brightness on a display.
All objective tests done in the laboratories are then complemented by a series of perceptual tests.
Color
From the end-user’s point of view, color fidelity — that is, having the display faithfully reproduce the exact same hues and shades that they see with their eyes — is second in importance only to readability.
We use a conoscope in the setup below to evaluate how color shifts when users view display content on axis versus when they look at content on a screen held off axis (tilted up to 70°).
We perform color fidelity measurements for different lighting conditions to see how well the device can handle color management under different ambient lighting conditions. Below is just one of our color fidelity results taken under a D65 illuminant at 830 lux.
Most smartphone manufacturers include a feature we refer to as a blue light filter (BLF); DXOMARK measures how effectively a phone reduces blue light, and what its impact is on overall display color rendering.
The wavelength (horizontal axis) defines light color but also the capacity to see it. For example, UV, which has a very low wavelength, and infra-red, which has a high wavelength, are both not visible to the human eye. White light is composed of all wavelengths between 400 nm and 700 nm, which is the range visible to the human eye.
The wavelength (horizontal axis) defines light color but also the capacity to see it. For example, UV, which has a very low wavelength, and infra-red, which has a high wavelength, are both not visible to the human eye. White light is composed of all wavelengths between 400 nm and 700 nm, which is the range visible to the human eye.
|
Color Unless specified otherwise, all tests are conducted at light levels ranging from 0 to 20,000 lux and using white color temperature/spectrum tungsten, white LED, D65 color illuminants, etc. |
||
|
Sub-attribute |
Equipment |
Remarks |
|
White point vs. ambient lighting (scored on faithful) |
Bench + spectroradiometer |
Result is the color temperature of the white point of the device (in Kelvin). |
|
White point vs. time (scored on default) |
Light booth |
We investigate if the white point adapts to changes in ambient brightness, and if such adaptation is smooth. |
|
Gamut vs. ambient lighting (scored on faithful) |
Bench + spectroradiometer |
Result is a percentage of the color gamut coverage (the higher, the better). |
|
Color fidelity/accuracy (scored on faithful) |
Bench + spectroradiometer |
Results are the color difference between the target and the measurement, given in JNCD (“just noticeable color difference”). |
|
Vs. angle (scored on default) |
Video colorimeter + conoscope |
Tested at 0 lux, results are the color difference expressed as JNCD; the less noticeable the color shift, the better. |
|
Uniformity (scored on default) |
Video colorimeter + standard lens |
Tested at 0 lux; the fewer the color differences across the screen, the better. |
|
Blue light filter impact (scored on night mode / blue filtering mode on) |
Bench + spectroradiometer |
Tested at 0 lux; blue component wavelength should decrease without changing the gamut. |
Video
A device may be good at handling still image content better than video, or vice versa. DXOMARK tests displays using the device’s default video app. In the images below used to illustrate video test results, you can see that the device on the left has low brightness but is still visible; the image in the center has good brightness; and the device on the right is quite dark. As for color, the left-hand device shows good color rendering; the middle device has a yellow cast; and the right-hand device is too blue.


|
Video Tested in standardized conditions at 5 cd/m2 and in 0 and 830 lux lighting conditions. |
||
|
Sub-attribute |
Equipment |
Remarks |
|
Brightness/Luminance |
Bench + spectroradiometer |
Device brightness should be visually comfortable in low-light and indoor conditions |
|
|
||
|
EOTF |
Bench + spectroradiometer |
Rendering of details in dark tones, midtones, and highlights should be as close as possible to that of the target reference screen, and maintained in indoor conditions. |
|
Color |
Bench + spectroradiometer |
Color must be as close as possible to the target reference screen and maintained in indoor conditions. |
|
APL |
Bench + spectroradiometer |
Brightness should not change with APL |
|
Frame drops |
Compact camera |
Tested at 0 lux, absolute number of stutter indicators (white) and frame drops (black) between 0 and 100 for a 32-second clip |
|
Motion blur |
The smoother the image, the better |
|
| Judder | Compact camera |
Video content evaluation at 24, 30, and 60 fps |
We run perceptual testing with a Sony reference monitor.
The video part of our testing also evaluates motion and how well a display handles moving content. The left-hand image below shows our setup for testing motion blur, and the middle and right-hand images show sample test output.
We evaluate motion blur perceptually by looking at frame duplications. The image below on the left shows the setup we used to take the images in the center and the right to illustrate what we evaluated perceptually. (We did not base any of our test results on these pictures.)
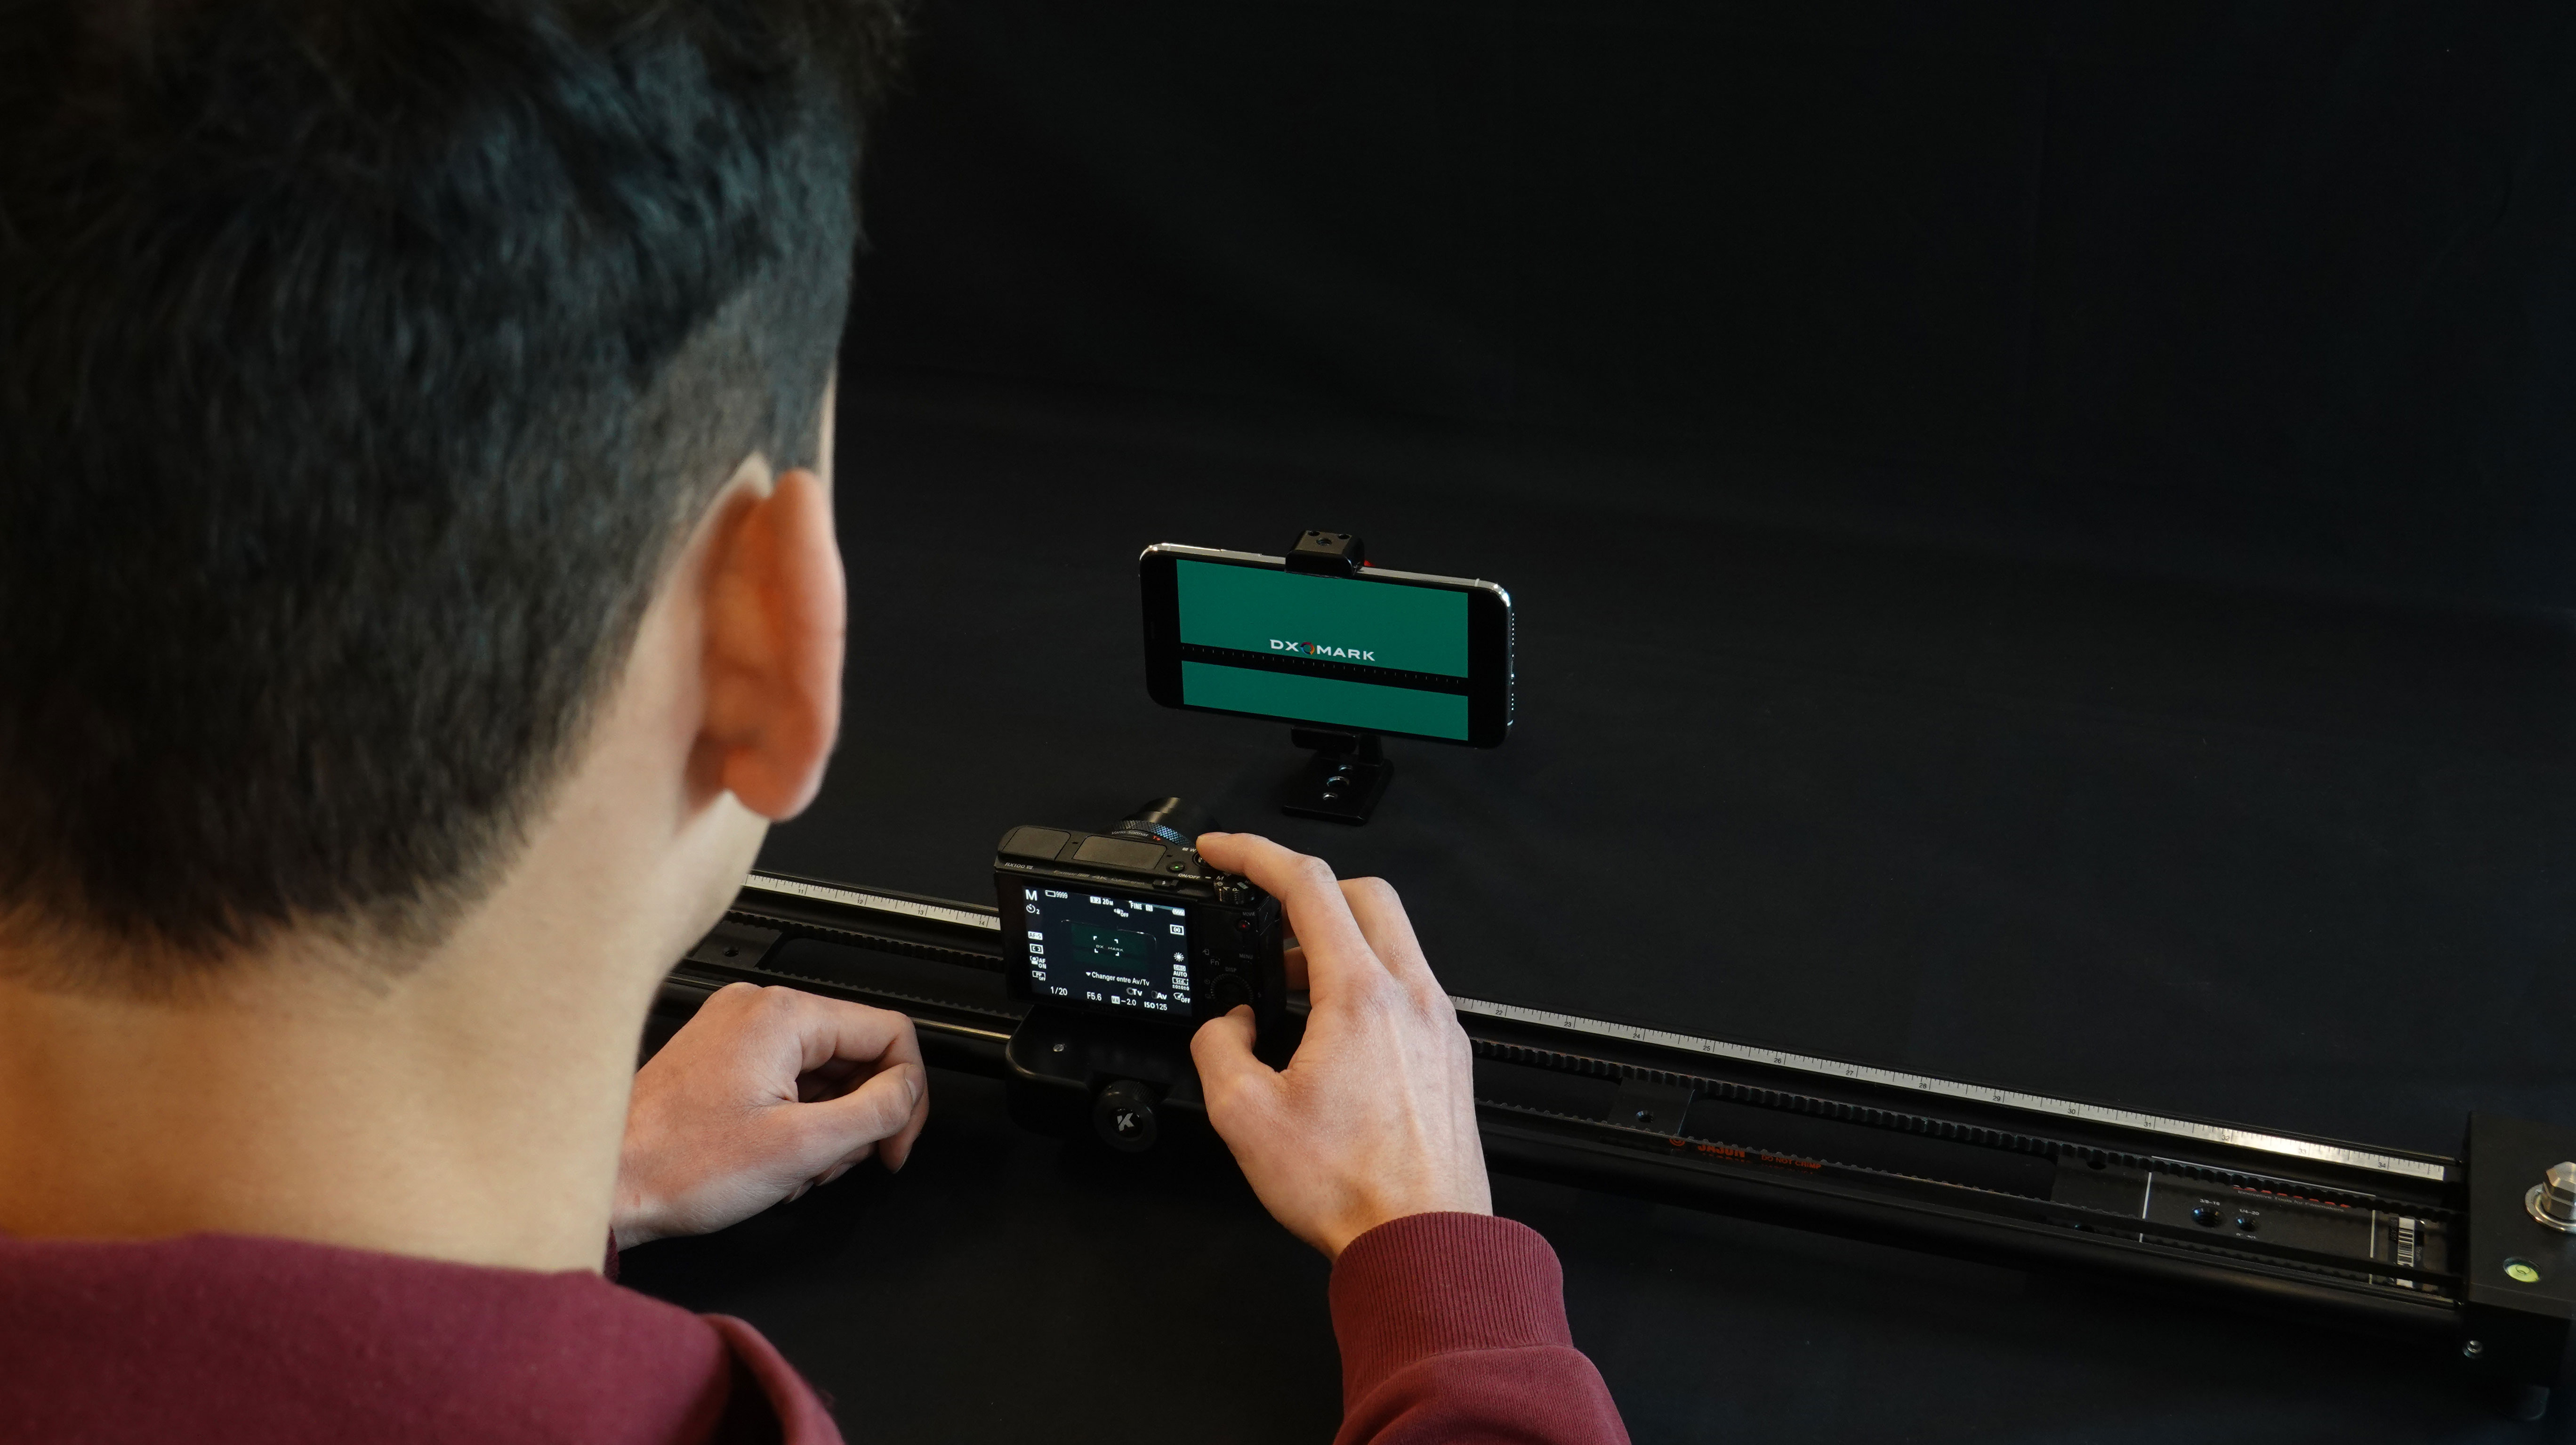


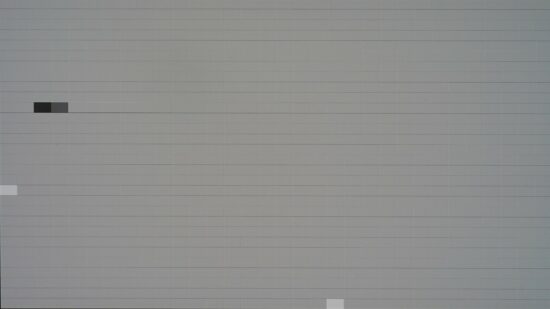
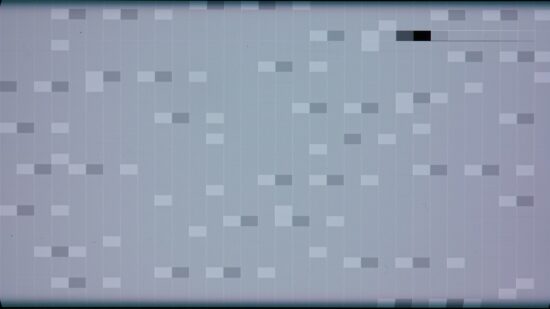
Other motion phenomena we test for are stutter and frame drops. The photo on the left shows our stutter/frame drop testing setup; the GIF on the right illustrates the test video output of a white rectangle that is lit in successive frames.

In the illustrative images below, a black or dark gray rectangle indicates a frame drop (that is, when the display fails to display a frame properly before directly moving to the next one), and a white rectangle indicates stutter (that is, the display displays a frame twice before moving to the next one).
Touch
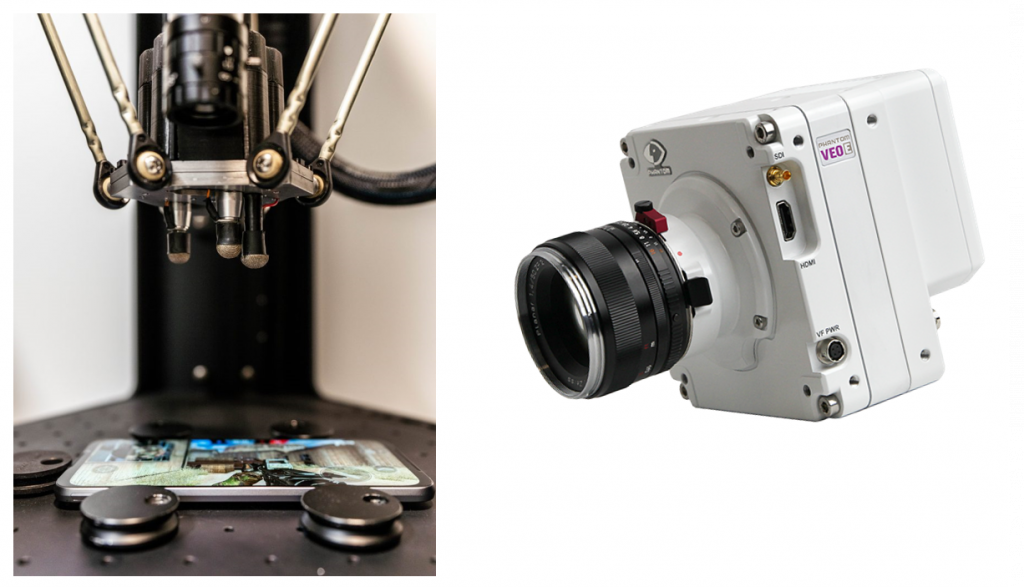
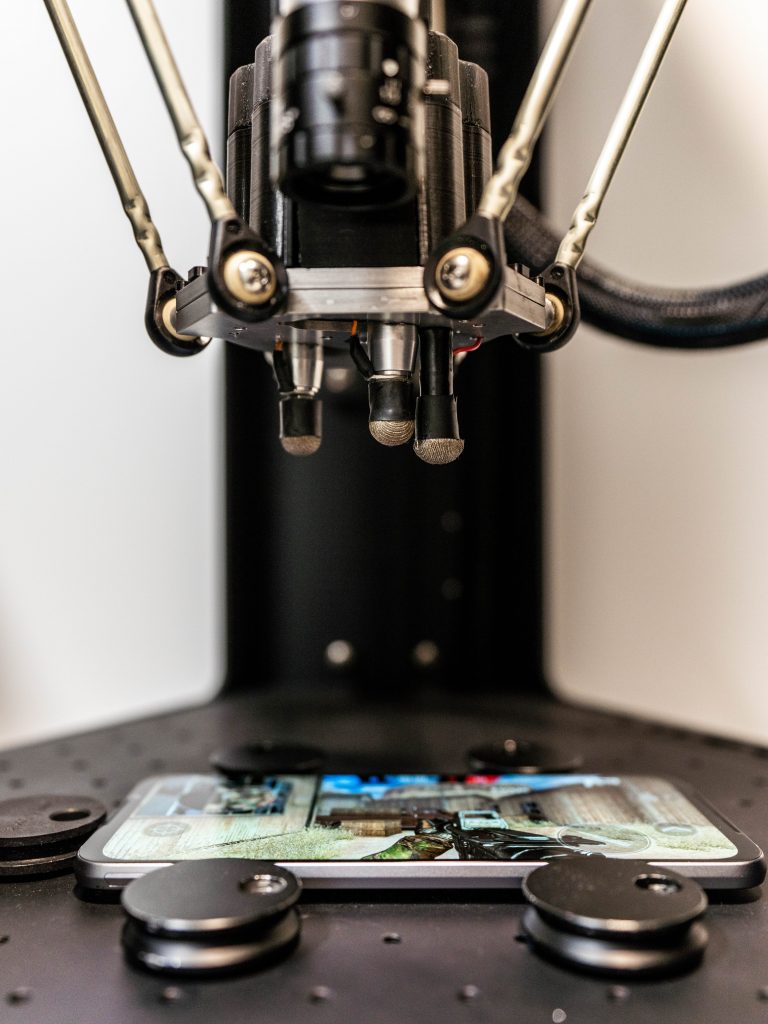
As shown below, we have a set of high-end measuring instruments for performing touch analyses, including a robot that simulates human gestures (tap, zoom, and scroll) on a touchscreen with a precision of 0.05 mm at 1.5 m/s. In addition, we use a high-speed Phantom camera that records 1440 images per second for slow-motion capture of each frame on a smartphone display.
In the video below, you can see a meaningful example of the results we obtain with our setup for touch response time measurement. In our gaming use case, the device on the left reacts three times faster than the device on the right, with response times of 3 ms and 10 ms, respectively.
In the example below showing smoothness, we observed during testing that the device on the left is not smooth and that the one on the right is very smooth when scrolling horizontally in a smartphone’s gallery app. The illustrations accurately depicts the phenomenon: On the left, we see a few sporadically spaced images, while there are many more evenly spaced images on the right.


| Touch
Tested in indoor conditions (300–830lux) |
||
| Sub-attribute | Equipment | Remarks |
| Response time | Touch robot & high-speed camera | Touch response time measured in gaming use case |
| Accuracy | Touch robot & high-speed camera; perceptual testing on a gaming app | Accuracy error and repeatability measurement on all areas of the screen (including edges) |
| Smoothness | Perceptual testing navigating in photo gallery app and on web pages | The smoother the better |
Eye Comfort Label
DXOMARK’s detailed measurements in the Display protocol can help determine whether the device is able to provide a comfortable viewing experience. We have extracted the key metrics of our protocol that we think are most important in determining whether the display experience is easy on the eyes in order to create the DXOMARK Eye Comfort Label.
Backed by solid measurements and transparency on the requirements necessary to pass, our Eye Comfort label aims to be relevant to users and helpful to manufacturers in improving their products.
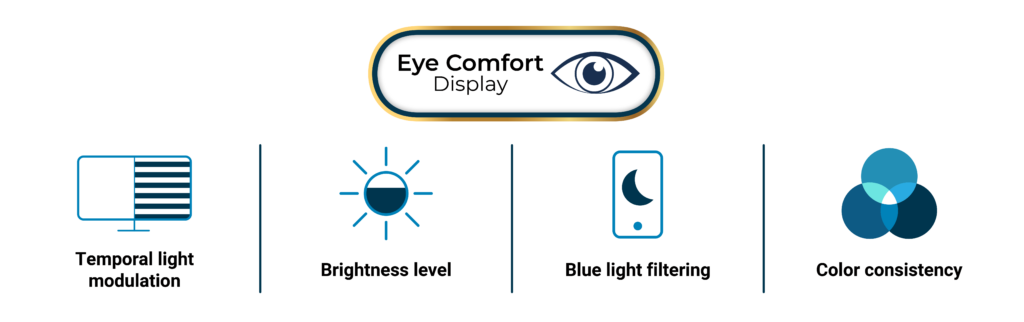
A smartphone that passes all four criteria qualifies for the DXOMARK Eye Comfort label, which will appear on the device’s product review as well in the detailed test results on dxomark.com.
Let’s go into more detail on each of the four criteria that a device must pass in order to qualify for the label and the DXOMARK measurements behind them.
• Temporal Light Artifacts
We explained earlier how we measure for flicker, which can be a factor in viewing comfort.
Our measurements look at the frequency of the light output oscillations over time and the degree of modulation restricted to under 90 Hz frequency. What interests us is the frequency point at which the modulation peaks. This peak indicates to us the Pulse Width Modulation.
We measure the flicker behavior of a smartphone and then apply our collected measurements to the flicker perception metric, which is currently used a standard to determine the relative sensitivity to flicker.11A flicker perception metric, D Bodington BS, A Bierman MS and N Narendran PhD Lighting Research Center, Rensselaer Polytechnic Institute, Troy, NY, USA
For a device to pass this criterium in our Eye Comfort label, the flicker perception metric must measure less than 1 in anti-flicker mode or default mode, meaning the probability of perception is less than 50%.
• Brightness levels
To pass this criterium, the device first must have an auto-brightness feature. We want to be sure that the device can strictly manage the amount of luminance (or brightness) it emits when activated in the dark or low light to avoid blinding the user.
The measurements come from our “luminance under various lighting conditions” testing done in the dark (0 lux).
For a device to pass, the screen’s luminance should be able to adjust in default as well as manual modes to 2 nits (or 2 candelas per square meter) or less of luminance.
• Blue-light filtering
Our studies have shown that consumers are growing more aware of and concerned about the effects that blue light from phone or computer screens can have on their vision and their sleep cycle. Research shows that artificial light, and in particular exposure to blue light at night, can disrupt the human circadian rhythm by inhibiting the production of melatonin, the hormone that helps us fall asleep. Despite the numerous studies done on what affects the circadian rhythm, there is still no scientific or medical consensus on the levels of blue light that could disrupt the sleep cycle.
For the Eye Comfort label, we extract the protocol’s blue-light filtering measurements done with night mode on and off to determine the possible impact on the human sleep cycle with metrics that are based on recent scientific research21
Oh, J., Yoo, H., Park, H. et al. Analysis of circadian properties and healthy levels of blue light from smartphones at night. Sci Rep 5, 11325 (2015). https://doi.org/10.1038/srep11325 .
By measuring a light source’s influences on the circadian rhythm and on vision, we can calculate a device’s Circadian Action Factor to determine its effect on our internal clock.
To meet the criteria for our label, the smartphone screen must have a circadian action factor equal or less than 0.65, with the default blue-light mode on. The 0.65 level corresponds to the light from a neutral white LED lamp, the kind you might use at home. Our position is that the luminance from the smartphone display should not be any more disruptive to your internal body clock than the light in your home.
• Color consistency
Color consistency looks specifically at the impact that the blue-light filtering mode has on color performance. It is a given that colors will shift when the blue light filter is activated, which also shifts the screen’s white point. A well-tuned device will minimize the effects of the color shift.
To meet our criteria for the label, the device must maintain 95% or more of the wide P3 color space gamut when the blue-light filter is activated, after a white point correction toward D65 (Bradford transform).
Conclusion
In our tests, we perform more than 600 measurements and 35 hours of perceptual analysis. These measurements are conducted in dark environments as well as in challenging indoor and outdoor lighting environments to imitate the end-user experience.
While having the latest high-quality panel on your smartphone is a good start toward reaching good display quality, it’s not enough. As we said earlier, display performance quality does not solely depend on hardware specifications, but also on the software strategy choices that manufacturers make to try to optimize end-user comfort across different use cases.
We hope this article has given you a more detailed idea about some of the scientific equipment and methods we use to test the most important characteristics of your smartphone display.