Portraits are the most valued and popular type of photography, yet capturing great portraits remains technically challenging for smartphone cameras. The specific issue of achieving accurate skin tones, for instance, has received considerable attention from researchers and manufacturers alike.
After taking into account all previous work on this topic, DXOMARK’s image quality experts conducted their own extensive qualitative study aiming to:
● identify trends in users’ preferences regarding portraits (pictures of a single person as well as a group of people)
● identify elements of satisfaction and frustration;
● explore the technical challenges.
To achieve this, we designed a unique methodology that allowed us to gather detailed insights from the most common use cases, environments, and conditions. This scientific methodology was used first for our European study in Paris, but it could be easily applied to other regions of the world, to other areas of study as well as other electronic products (laptops, for example).
We present it to you here.
The question of perception
Perception is a challenge when it comes to portrait quality evaluation. Indeed, people’s preferences when it comes to photos are often tied to their memories and familiarity with the subject. Hence, we hold our portraits and those of other people to different standards.
This begs the question: which qualities can most people agree a “good portrait” should have?
To find answers, DXOMARK’s image quality experts conducted this new qualitative study aiming to identify the reasons of frustration and the key pain points in smartphone portrait photography.
Understanding and measuring user preferences
The methodology our experts built allowed them to achieve two main objectives.
Understanding user preferences
This requires a comprehensive analysis that encompasses all smartphone camera uses (meaning types of portraits here), and the variety of conditions they take place in. Of course, each usage presents unique technological challenges.
Only by fully understanding each of these uses and the technical difficulties they pose could we simulate highly accurate test conditions.
Measuring user preferences
This is a critical component of this analysis. The scale should represent the perceived quality of each type of portrait according to an individual or a test group.
Conducting this analysis with a large group and creating a test scenario that closely resembles real-world usage was key to the success of this study.
Analyzing portrait preferences in relation to skin-tone rendering
We took on the question of skin tone rendering quality perception in smartphone portrait photography.
This required
● gathering a panel of people representative of all skin tones but also diverse cultural backgrounds, age groups, and gender inclusive
● developing a relevant shooting plan
A shooting plan includes a set of diverse photos used to identify users’ portrait preferences. We designed such a shooting plan for many years. Quantitative surveys are very useful per region to understand the preferred use cases. In the context of this study, a “relevant” plan is one that covers most use cases.
The shooting plan: A key component to anchor users’ insights in real life
The technical framework
The photographer
The shots had to be taken by professional photographers. Why? Because we needed perfectly comparable shots. The challenge lay in accurately capturing the same scenes with different devices.
The devices
Our goal was not to compare devices or evaluate their performance but rather to gain insight into user preferences regarding the top offerings on the market.
Therefore, we used the most advanced smartphones, the flagship devices, available at the time of the study, as well as a professional digital camera that allowed us to look at what the future of smartphone photography may hold.
⚠️ For each scene and type of portrait, four different devices were used: three smartphones and a professional camera.
These allow us to identify the main trends in preferences, each of which can then be studied in more depth.
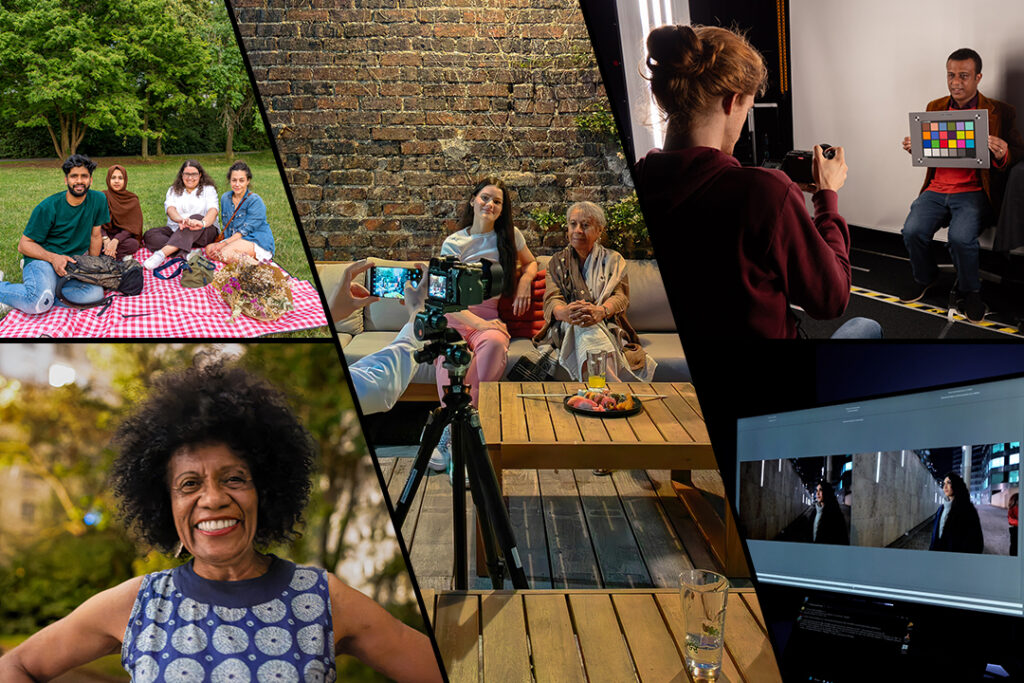
Scenes and stages
The location
The shooting plan was tailored to the specifics of the geographical area under study. In our case, it was Paris. Our professional photographers curated a plan that embodied the look, feel and essence of a European way of life. Our ultimate goal was to capture images that would resonate with the European panel.
💡This type of study can be replicated anywhere in the world, with local photographers capturing and showcasing their respective regions’ unique customs and traditions.
The stages
A stage refers to a combination of:
● places
● lighting conditions
● framing (scene composition)
● number and position of respondents
A total of 180 stages were shot, with one, two, three and four models in each.
The scenes
A scene is a specific combination of a stage and models placed within it. The model is the variable between different scenes within the same stage.


Our shooting plan was comprehensive to include all types of scenes. The were partitioned in the following way (the number represents the number of scenes shot for each condition) :
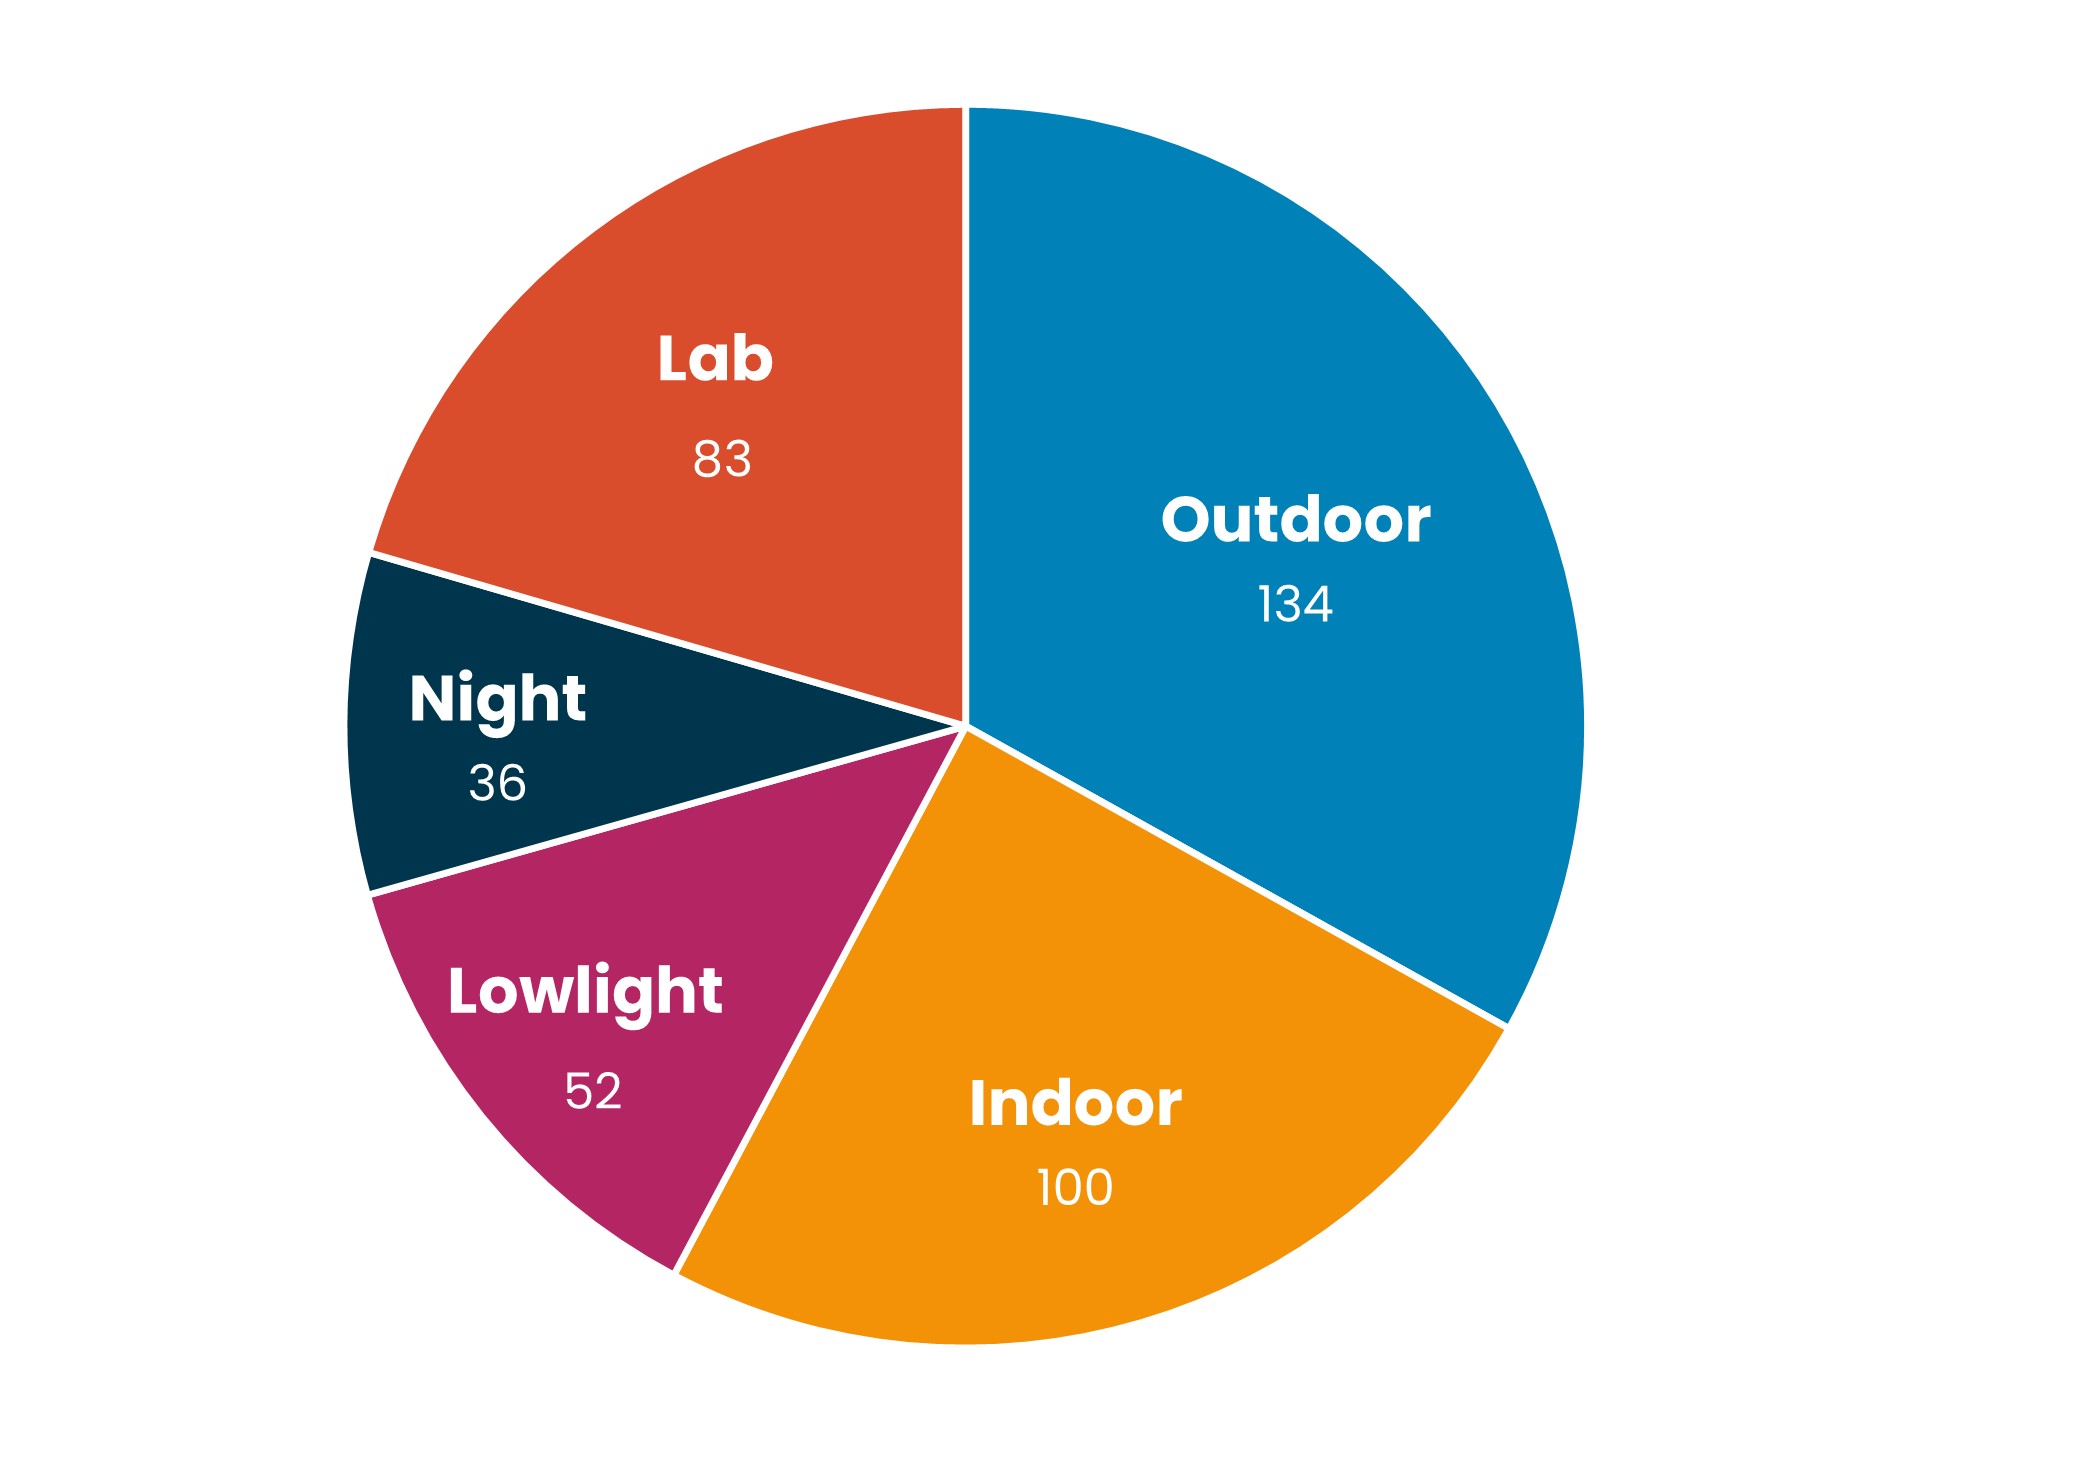
“We understand that certain test conditions, especially night scenes, can be more challenging than others. That’s why we included a large variety of conditions during testing.
We also enriched the shooting plan with lab scenes, which feature models in front of a white background, under neutral and consistent lighting. This controlled environment allowed us to focus only on the rendering of the portrait and its reception by the panel, without the scene, light or conditions affecting the results.”Hervé Macudzinski, Image Science Director, DXOMARK
The light conditions
We shot a total of 1,620 pictures in HDR, SDR and backlit conditions, partitioned as shown in the following chart:
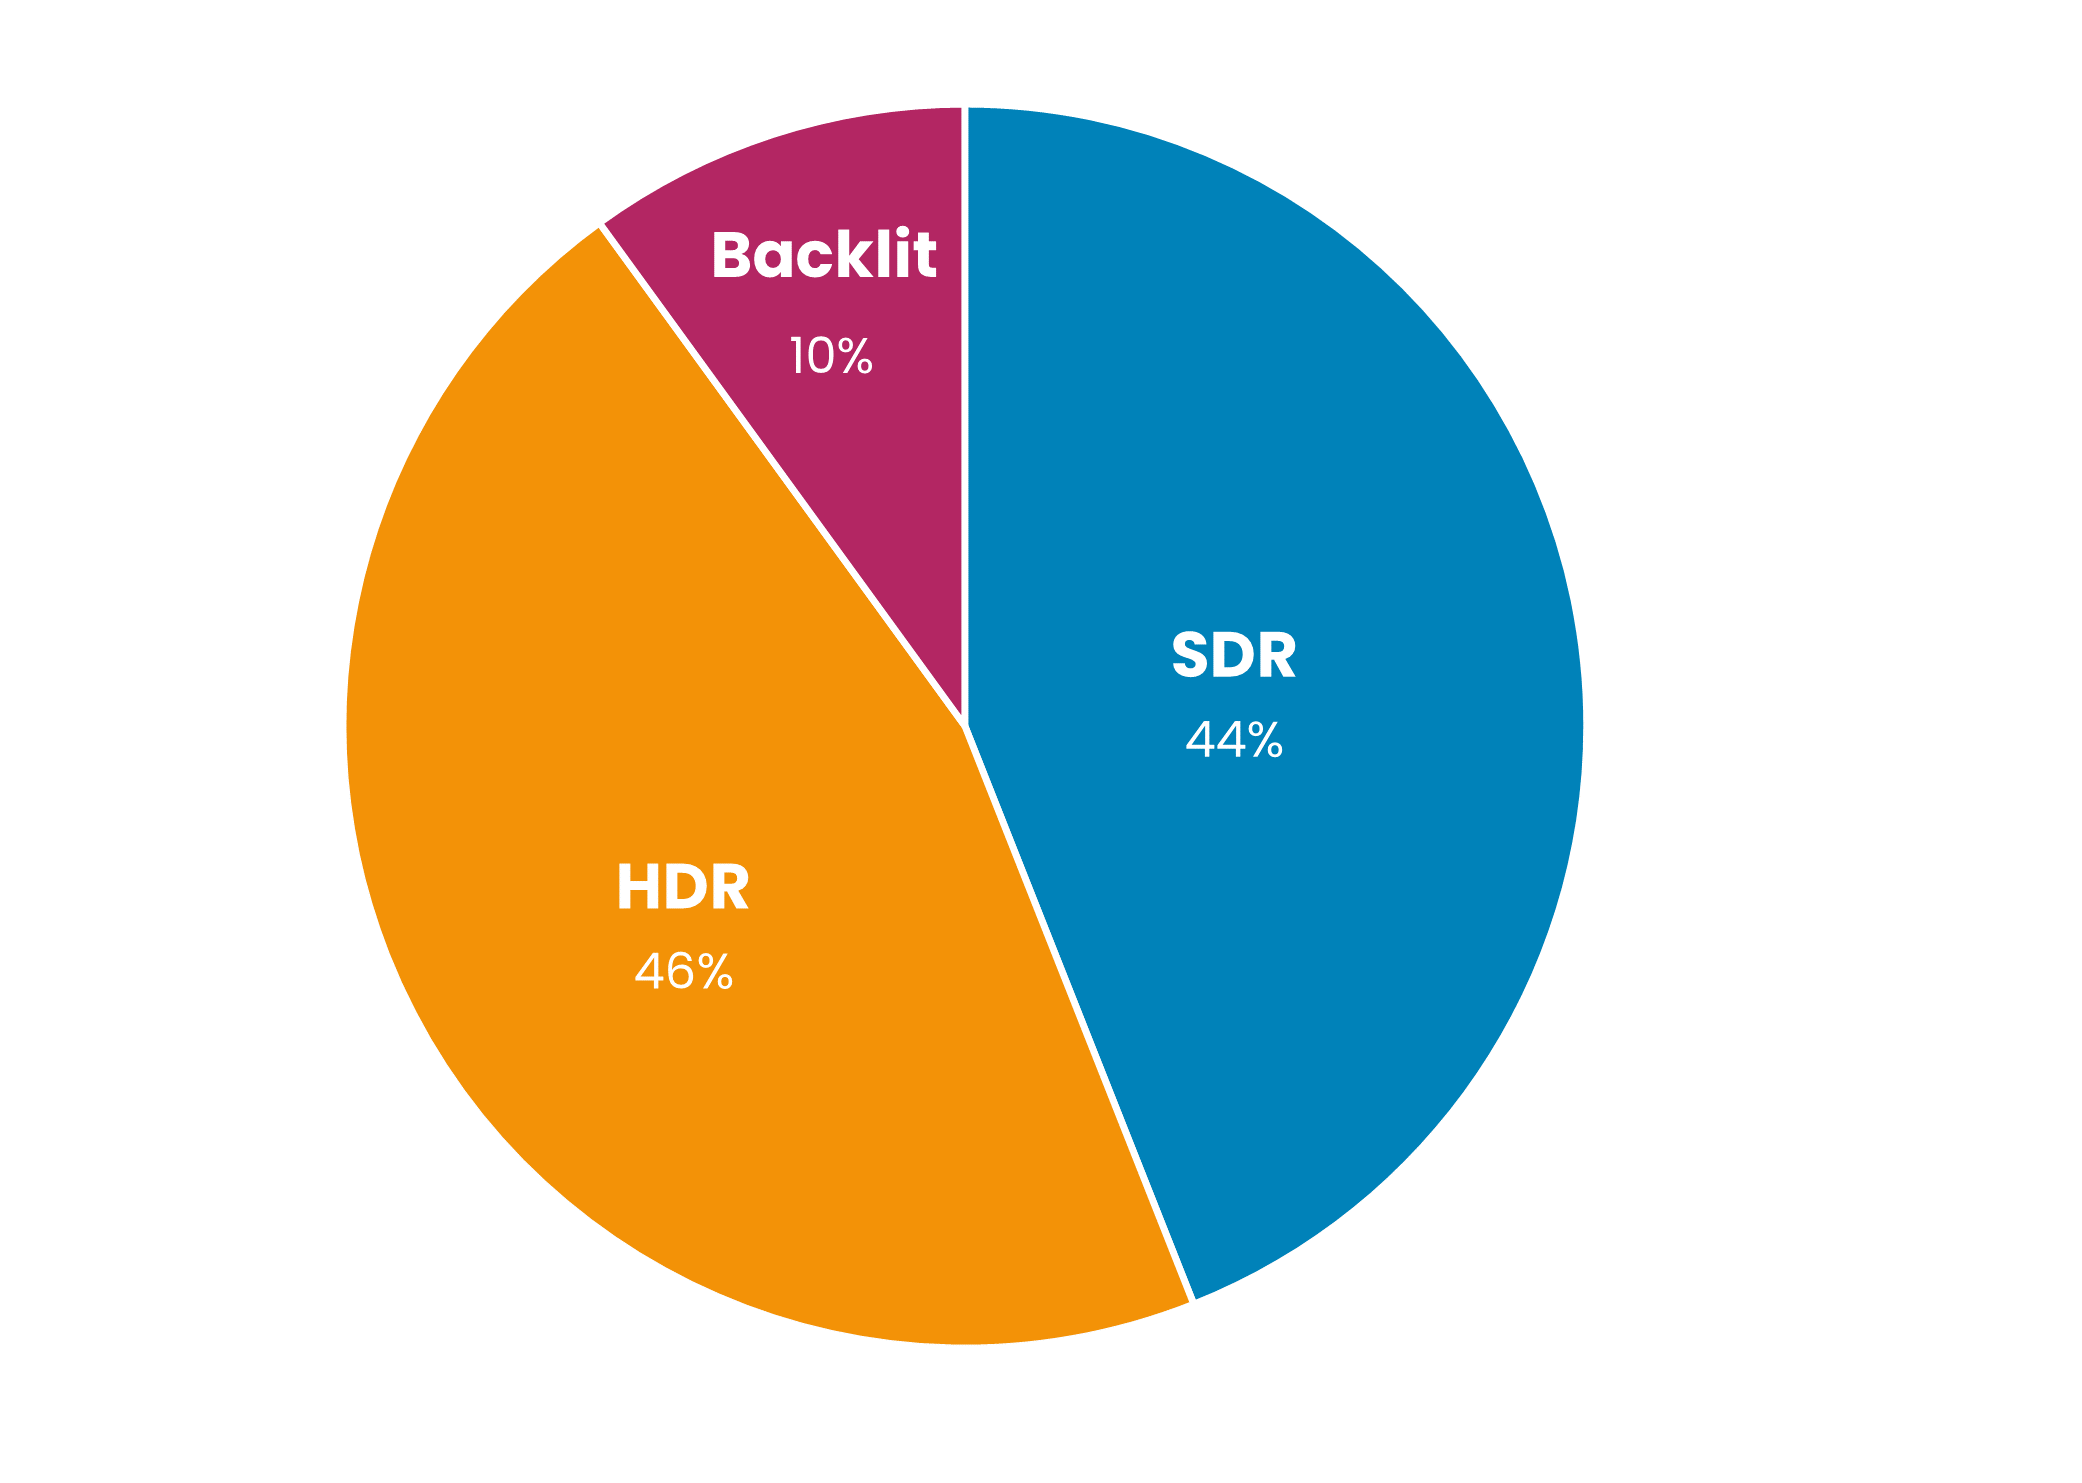
● backlit (very challenging light conditions)
● SDR or Standard Dynamic Range (limited range of brightness and colors)
● HDR or High Dynamic Range (high range of brightness and colors)
Survey respondents
The respondents
We put together a panel of European people representing all skin tones as well as a variety of cultural backgrounds, genders, and ages. A total of 123 people participated in the survey, with 83 models/respondents photographed in 405 scenes, 30 professional photographers, and 10 DXOMARK image quality experts, making this one of the largest studies of its kind.
Both genders were almost equally represented, with the panel made up of:
● 52% women
● 48% men
Every adult age group was included as well:
● 18 to 30 years old (25%)
● 30 to 40 years old (29%)
● 40 to 50 years old (19%)
● 50 to 60 years old (15%)
● Over 60 years old (12%)
To select and classify the respondents based on their skin tone, we used the Fitzpatrick scale, a tool used to determine how different skin types react to the sun. The scale organizes skin types into 6 distinct categories, all included in our study:
● Type I, “light” (12%)
● Type II, “fair” (30%)
● Type III, “medium” (23%)
● Type IV, “olive” (2 %)
● Type V, “brown” (8%)
● Type VI, “deep” (4%)
About the Fitzpatrick scale
Originally developed for medical purposes, the Fitzpatrick scale is commonly used for classifying skin across various industries. While being a robust and widely used tool, numerous scientific publications have pointed out its limitations. For example, it does not take into account the difference between skin type & skin tone. The paper “Beyond Skin Tone: A Multidimensional Measure of Apparent Skin Color”, for instance, highlights the need for a more comprehensive measure of skin color. The Fitzpatrick scale also relies on self-reporting, which can bring with it unintentional bias”.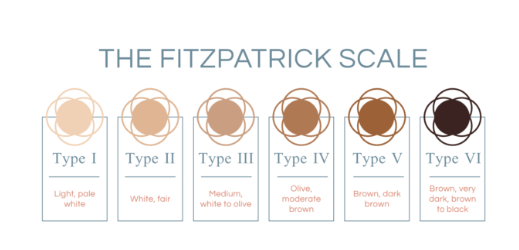
“We adopted the Fitzpatrick scale as it is widely used to classify skin tones. However, it may not provide enough granularity for medium to dark skin tones, resulting in potential classification inaccuracies. Therefore, we are exploring the possibility of using alternative scales such as the Monk scale or the Individual Typology Angle (ITA) in future rounds.”
Benoît Pochon, Image Science Director, DXOMARK
Unveiling the Satisfaction Index
The DXOMARK Satisfaction Index is a numerical representation of user preferences. It is a combination of two distinct aspects that we measured in this study: One measures preference and the other measures rejection. By combining these two results, we were able to gather insights not only about user preferences but to quantify them as well.
Participants took all the tests under controlled viewing conditions and were unaware of the devices that were used to capture the images.
The details of how we created the DXOMARK Satisfaction Index are presented below.
The two-step user survey
Step 1: The best picture
First, participants were presented with only two images, side-by-side, and asked to select the one image that they preferred based on its overall image quality.
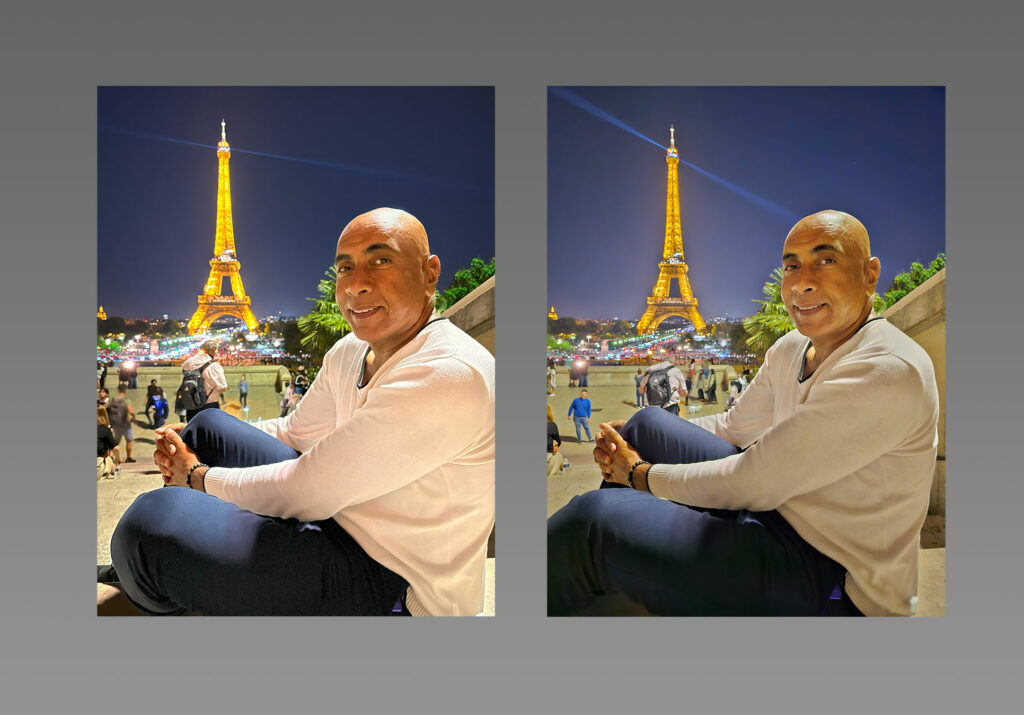
In order to quantify the perceived difference in quality our experts used a Just Objectionable Difference (JOD) scale.
Pairwise Comparison and JOD scale
This method allowed our experts to rank the pictures by crossing the results of several comparisons. For example, two images were considered to be 1 JOD apart if 75 % of observers found that one had better quality than the other.
Ranking pictures according to a JOD scale requires the use of advanced statistical techniques, in order to ensure enough comparisons are made to converge to a reliable estimate.
Those techniques also allow experts to acquire more information. For instance, a confidence interval for the JOD scores of a given group can be determined using a statistical method known as bootstrapping, which relies on repeated resampling of a set of data in order to accurately estimate a result for a particular group.
At the end of the survey, for each participant, every image taken with each of our four cameras was given a preference score. We could then aggregate those results to estimate a preference score for groups of participants.
Step 2: Social media-worthy picture
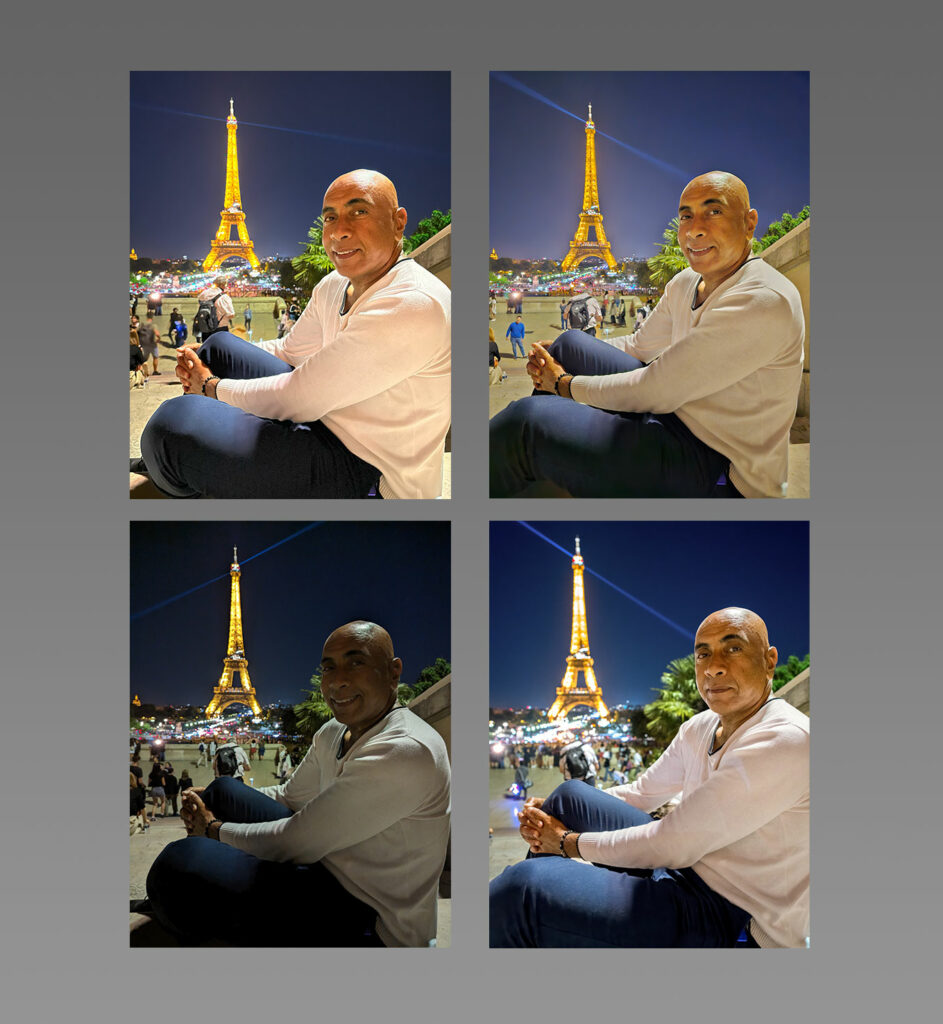
In the second part, participants were presented with four images of the same scene taken with different cameras (one with a professional camera and three with smartphones), and then asked to identify which image they would not want to post on social media, effectively, which image or images they would reject. The goal of this question was to refine our preference analysis.
Why social media?
We wanted to measure acceptability. Our question was: “what do respondents consider to be the minimum level of quality acceptable?”. In that regard, social media provides a criterion that speaks to everyone yet remains significant. If we had simply asked people which photo they would keep, they might have chosen a lower-quality option because of their sentimental attachment to it.
“We needed a criterion for evaluating the quality of photos. Social media suitability proved to be the ideal one.”Hervé Macudzinski, Image Science Director, DXOMARK
Calculating the Satisfaction Index
After conducting this two-step survey, we collected the following information for each scene:
● the overall rejection rate for all respondents
● the rejection rate for the group being studied
● the JOD scale
With the collected data, we used the formula below to calculate the Satisfaction Index score per picture, and we scaled the result so that it would fit within a range of 0 to 100.
Taking into account the confidence interval for each portion of the index, we could also determine a confidence interval for the overall Satisfaction Index.
The Satisfaction Index falling below 70/100 meant the photo may not meet user expectations.
Conversely, examining the characteristics of photos with scores above 70 helped us identify the prevailing preferences within a given use case. This understanding allowed us to establish the commonalities between satisfying renderings, as well as their technical characteristics.
Why use a Satisfaction Index?
The Satisfaction Index is a homogeneous and comparable score that can be used to compare participants, groups of participants or scenes.
By examining the Satisfaction Index for each individual, we can gain valuable insight into their ability to identify image quality issues and their preferences compared to other participants or groups, and the trends in their preferences.
Closing thoughts and considerations
This study analyzes the impact of shooting conditions and camera choice on image quality perception, but it also answers other related questions that provide us with consumer insights:
● Are smartphone users currently satisfied with the quality of their portraits?
● Do all high-end smartphones provide the same level of satisfaction in this respect?
● Do professional photographers produce more satisfying images overall compared to smartphones?
● If so, which gaps in quality can non-photographer users perceive?
● Does age influence quality perception?
● Does gender affect quality perception?
● Does the perceived quality of pictures remain the same regardless of the model’s skin tone?
● What other dimensions influence the respondents’ choices and their perception of image quality?
The complete study by DXOMARK Insights highlights the technical parameters that are key to ensuring high-quality portraits and user satisfaction. To manufacturers, that is vital information.
Stay tuned for the first results, coming soon!