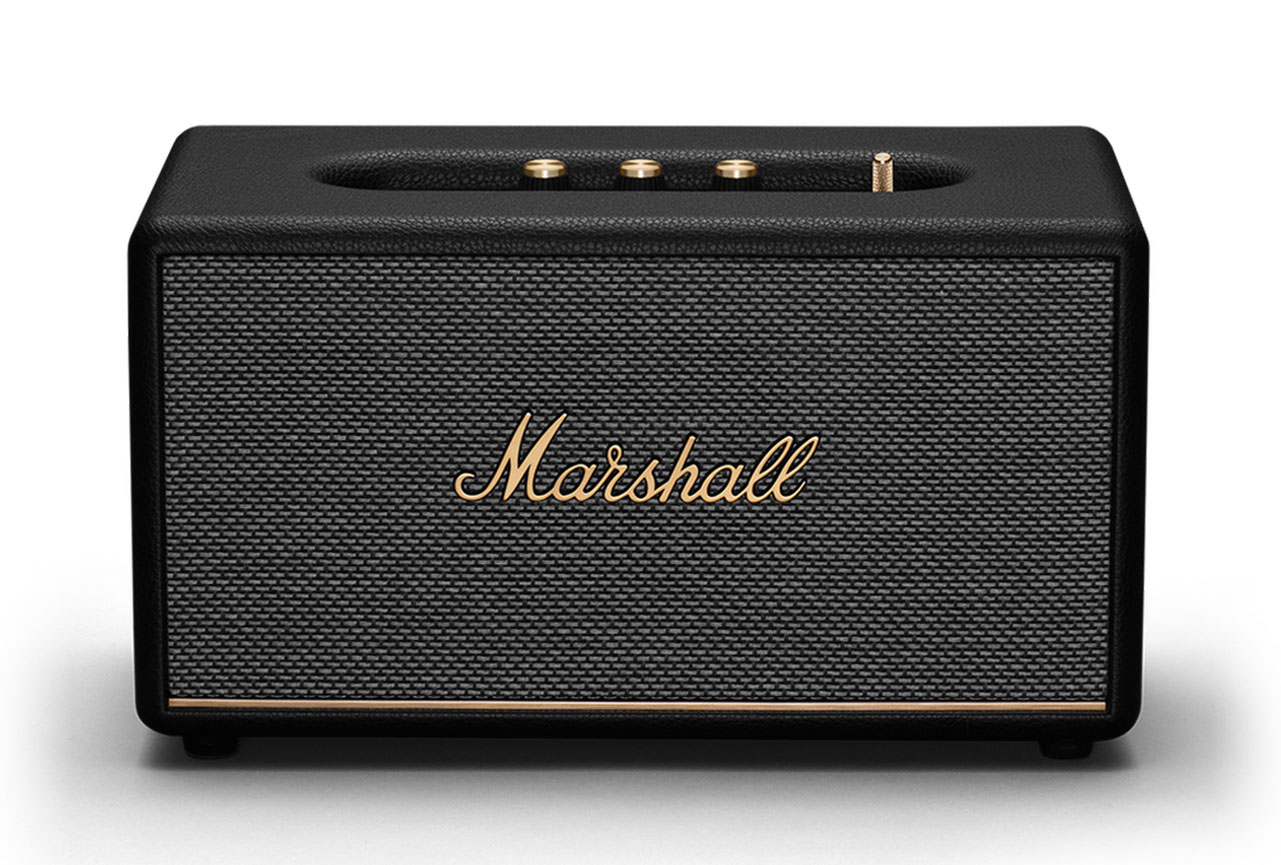
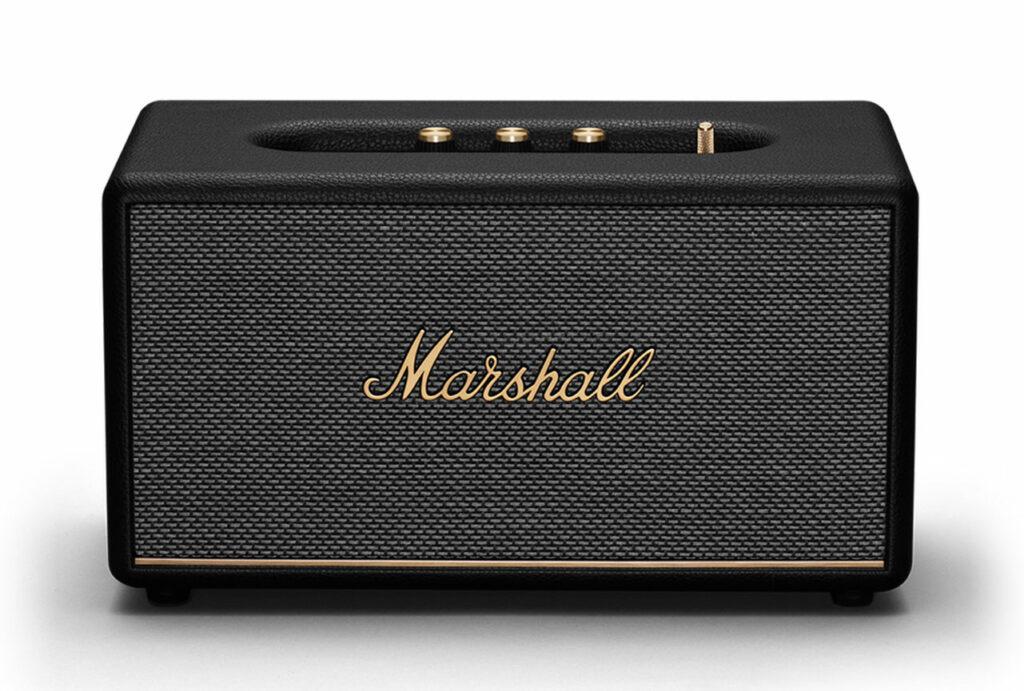
We put the Marshall Stanmore III through our rigorous DXOMARK Audio test suite to measure its performance at playing back audio. In this review, we will break down how it fared in a variety of tests and several common use cases.
Overview
Key specifications include:
- Wireless protocols : Bluetooth
- Wired connectivity : Jack
- Dimensions: 350 mm x 203 mm x 188 mm (13.78 in x 8 in x 7.40 in)
- Weight: 4.25kg (9.37 lb)
- Speakers: Frequency response 45Hz/20KHz; stereo; maximum SPL: 97dB@1m; Bass Reflex Structure; 50W class D amp for woofers; 2 15W class D amps for tweeters
Test conditions:
- Tested with Motorola smartphone
- Communication protocol used: Bluetooth
 Marshall Stanmore III


Pros
- Pleasant overall tonal balance, with deep low-end and bright treble
- Nice performance at high-SPL and in “anechoic” scenarios
- Loud maximum volume
Cons
- Lack of midrange; bass and treble are sometimes a bit exaggerated
- Bass precision and punch are too volume-dependent
- Volume steps could be fine-tuned
- More artifacts than expected
The Marshall Stanmore III provided a pleasant overall tonal balance, with a deep low-end and a bright treble. But its performance fell a bit behind its predecessor, the Stanmore II, mainly due to the presence of artifacts such as pumping and bass distortion at high-SPL, as well as the steepness in setting the first few volume steps.
The Stanmore III was very performant in a variety of scenarios, whether in relaxing and bedtime use cases that focus on music or podcasts at a quiet volume or in a party scenario when listening to music at maximum volume. Thanks to the Dynamics Loudness functionality, tonal balance subtly adapts to the listening volume, but it did not exactly suit our experts’ requirements for scenarios at nominal volume regardless.
Our tests showed that the speaker was least performant in kitchen and TV scenarios. Indeed, midrange was deemed a bit shy, directly affecting vocal content. A few other niggles included a higher Bluetooth latency than the Stanmore II, and bass and punch that were too volume dependent.
We compared the Marshall Stanmore III, which falls into our Advanced speaker category ($200 to $599) with the Marshall Stanmore II and the Klipsch The Three II.
Listen to the tested speaker’s playback performance in this comparison with its competitors:
Test summary
About DXOMARK Wireless Speaker tests: For scoring and analysis in our wireless speaker reviews, DXOMARK engineers perform a variety of objective tests and undertake more than 20 hours of perceptual evaluation under controlled lab conditions. This article highlights the most important results of our testing. Note that we evaluate playback using only the device’s built-in hardware. (For more details about our Speaker protocol, click here.) The following section gathers key elements of our exhaustive tests and analyses performed in DXOMARK laboratories. Detailed performance evaluations under the form of reports are available upon request. Do not hesitate to contact us.
The DXOMARK Speaker overall score is derived from a range of sub-scores. In this section, we will take a closer look at timbre, dynamics, spatial, volume, and artifacts, and explain what they mean for the user.

Timbre
Marshall Stanmore III
152
DXOMARK timbre tests measure how well a speaker reproduces sound across the audible tonal range and takes into account bass, midrange, treble, tonal balance, and volume dependency.
The Stanmore III, in its default settings, proposes a much different timbre than its predecessor the Stanmore II. With an emphasis on bass and brilliance, the tonal balance on the Stanmore III is slightly less homogeneous, but it still provides a pleasant listening experience. However, the lack of midrange does hinder the speaker’s performance in some use cases.
The speaker’s bass featured an impressive low-end extension. The smartphone app worked relatively well when setting the speaker’s parameters for the room, but when the Stanmore III was placed near a wall, boominess persisted to some extent, and it was particularly excessive in the TV use case. Bass performance seemed better when the speaker was placed farther away from any wall, as observed in the Lounge, Outdoor, and Party use cases.
Treble was generally very bright, featuring excellent high-end extension. While it is the upper treble that makes the Stanmore III stand out from other devices, it might be a bit excessive in some cases because it doesn’t sound very natural and could even become slightly aggressive at higher levels. But in some use cases, such as TV or Bedroom, the upper treble is quite useful.
Ultimately, the midrange is the speaker’s main weakness because it is too quiet in the default setting. This becomes a noticeable problem with vocal content, such as podcasts and movies, as voices sound disembodied and the intelligibility of the dialog is impaired.
Overall, the sound signature steers away from the warm and “analog” timbre of the Stanmore II. With a few user adjustments, the Stanmore III is capable of presenting a very pleasant tonal balance, but where it stands now in its default settings, the usage is limited.

Dynamics
Marshall Stanmore III
137
Dynamics tests measure how well a device reproduces the energy level of a sound source, taking into account attack, bass precision, and punch.
Similarly to the timbre attribute, the Stanmore III’s dynamics performance left our testers with some mixed impressions.
Attack rendition was overall very clear, and sharp, in all use cases.
Bass precision was actually quite good in “anechoic” settings such as the Party and Outdoor use cases, despite a blurry bass attack in high-SPL uses. In other use cases, however, bass rendition was unrealistic as envelope didn’t sound natural. This may be an indication that room acoustics do have an impact on the performance despite the calibration functionality, and the Stanmore III is probably not suited for all room types.
As with bass precision, punch was very good in loud use cases, especially in anechoic settings. However, the lack of low-midrange energy quickly took a toll on the overall punchiness for most use cases.

Spatial
Marshall Stanmore III
111
Spatial tests measure a speaker’s ability to reproduce stereo sound in all directions, taking into account localizability, balance, wideness, distance, and directivity. Please note that wideness is 0 on mono speakers and on speakers that cannot deliver a significant stereo effect.
Spatial performance was average. The Stanmore III’s stereo scene rendition was narrow and limited by the dimensions of the speaker, just like on its predecessor. Even though our testers expected some lack of wideness, they did not expect the Stanmore III’s blurry localizability. Sound sources were relatively hard to pinpoint in the sound scene; since stereophony is limited, localizability is more reliant on timbre information, and this is where it fell short. As for distance rendition, it was generally accurate, but somewhat inconsistent: the emphasis on upper treble would bring some elements to the foreground, while the lack of midrange would push some to the background.

Volume
Marshall Stanmore III
141
Volume tests measure both the maximum loudness a speaker is able to produce and how smoothly volume increases and decreases based on user input.
While the maximum volume performance of the Stanmore III was relatively similar to that of the Stanmore II in terms of loudness (and thus excellent), volume consistency was less convincing. Measurements showed steep jumps in the first few volume steps, which made setting the volume with precision a tedious task.
Here are a few sound pressure levels (SPL) we measured when playing our sample recordings of hip-hop and classical music at maximum volume:
| Correlated Pink Noise | Uncorrelated Pink Noise | Hip-Hop | Classical | Latin | Asian Pop | |
| Marshall Stanmore III | 94.3 dBA | 91.6 dBA | 89.9 dBA | 82.7 dBA | 91.6 dBA | 83.7 dBA |
| Marshall Stanmore II | 96.9 dBA | 94.2 dBA | 91.8 dBA | 85.3 dBA | 93.1 dBA | 84.3 dBA |
| Klipsch The Three II | 93.2 dBA | 92.7 dBA | 91.1 dBA | 85 dBA | 92.3 dBA | 86.1 dBA |

Artifacts
Marshall Stanmore III
133
Artifacts tests measure how much source audio is distorted when played back, along with such other sound artifacts as noise, pumping effects, and clipping. Distortion and other artifacts can occur both because of sound processing and because of the quality of the speakers.
The Stanmore III presented a few artifacts. Distortion was rare, but it occurred on loud bass transients, and bass in general. Compression and pumping were heard in loud use cases. Our measurements showed that Bluetooth latency was also a bit high compared to the Stanmore II.


DXOMARK encourages its readers to share comments on the articles. To read or post comments, Disqus cookies are required. Change your Cookies Preferences and read more about our Comment Policy.