
We put the Oppo Find N2 through our rigorous DXOMARK Audio test suite to measure its performance both at recording sound using its built-in microphones, and at playing audio back through its speakers.
In this review, we will break down how it fared in a variety of tests and several common use cases.
Overview
Key audio specifications include:
- Bottom-firing, left and right
- No jack audio output
Scoring
Sub-scores and attributes included in the calculations of the global score.

Oppo Find N2
Playback
Pros
- Good timbre performance
- Pleasant tonal balance, even at maximum volume
- Good speaker positioning helps avoid occlusions
Recording
Pros
- Excellent and natural timbre performance
- Very good wideness and localizability
Cons
- Inconsistent bass rendition when recording loud content, such as concerts
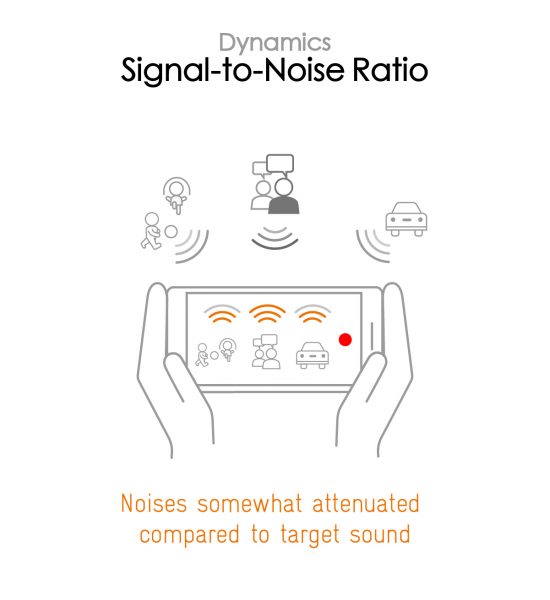
- Signal-to-noise ratio could be better in urban scenarios, background noise is quite intrusive
With a DXOMARK Audio score of 135, the Oppo Find N2 proved to be an all-round strong performer in our tests. In playback, the sound signature was very pleasant, even at maximum volume, but a lack of dual stereophony (stereo output in landscape and portrait orientation) meant that the Oppo failed to really stand out. Playback performance was overall very good when listening to music or watching movies, but it was also quite good for gaming.
Recording results were excellent, especially with the main camera. Performance was slightly less good for the front camera and recorder app, but still very good. Recording quality remained good at high sound pressure levels, for example, when recording concerts. A wide rendition of the stereo sound scene also resulted in an immersive experience.
Test summary
About DXOMARK Audio tests: For scoring and analysis in our smartphone audio reviews, DXOMARK engineers perform a variety of objective tests and undertake more than 20 hours of perceptual evaluation under controlled lab conditions.
(For more details about our Playback protocol, click here; for more details about our Recording protocol, click here.)
The following section gathers key elements of our exhaustive tests and analyses performed in DXOMARK laboratories. Detailed performance evaluations under the form of reports are available upon request. Do not hesitate to contact us.
Playback
Oppo Find N2
163
DXOMARK engineers test playback through the smartphone speakers, whose performance is evaluated in our labs and in real-life conditions, using default apps and settings.
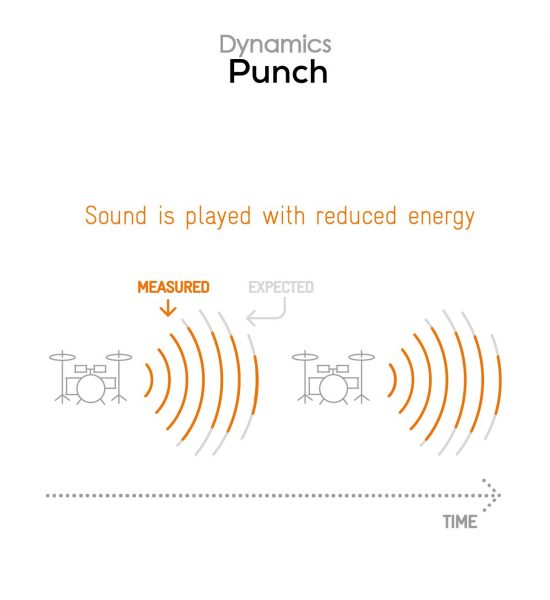
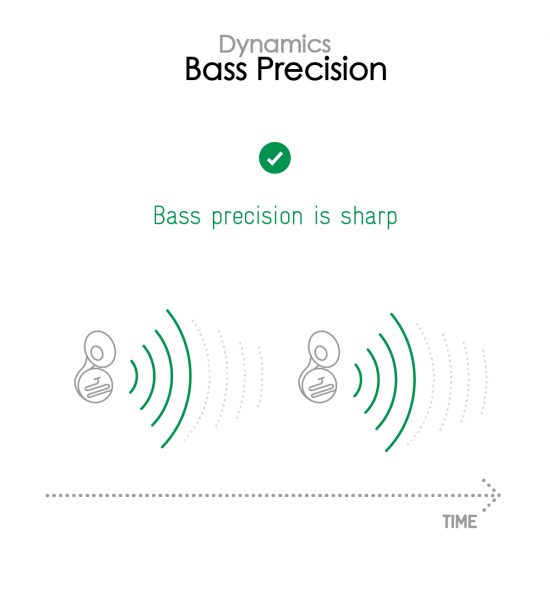
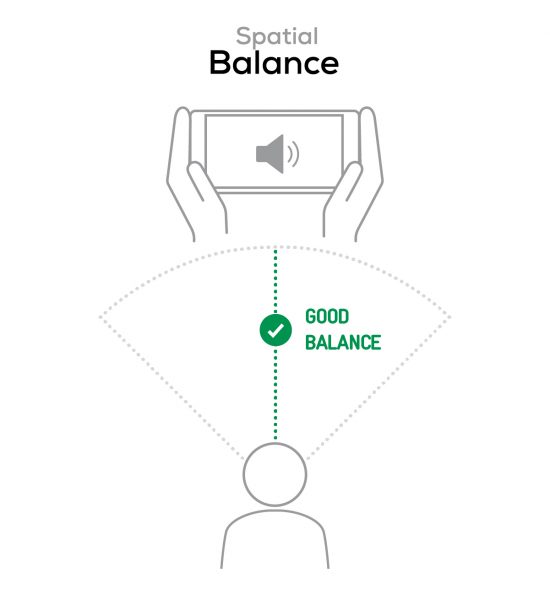
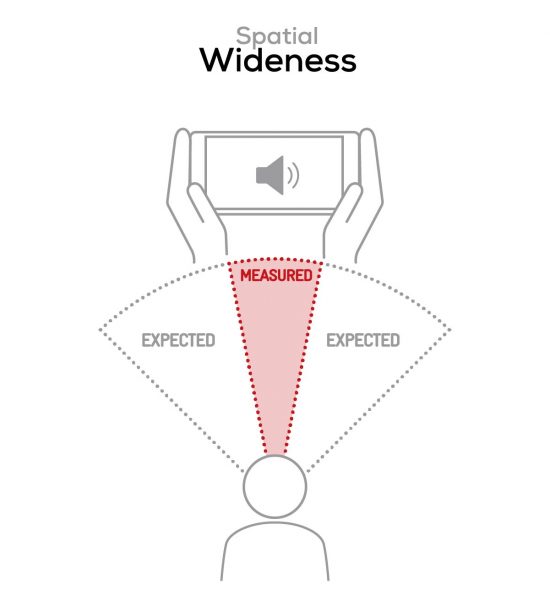
In playback, the Find N2 offered a decent tonal balance, with a quite natural and pleasant treble, pretty good midrange and a bass that had a nice roundness to it. Dynamics performance in playback was satisfying, with and sharp attack and good bass precision along with a powerful punch. For our spatial tests, the device was evaluated in what could be considered portrait orientation,considering the particular positioning of its speakers. In this orientation, wideness was decent overall but could have been better for a device of the N2’s dimensions when unfolded. Distance rendition was accurate, and individual sound sources were easy to locate in the sound scene, although it lacked depth, and could therefore be perceived as slightly shallow.
Volume step distribution was measured as pretty even. Maximum volume was average, and our experts found the minimum volume step to be slightly too quiet, limiting the intelligibility of some highly dynamic content such as classical music. In terms of audio artifacts, perceptual evaluation and measurements alike highlighted some bass distortion at maximum volume. We also found it impossible to occlude the speakers realistically when the Oppo was unfolded, making the device a great option for gaming.
Listen to the tested smartphone’s playback performance in this comparison with some of its competitors:

Timbre
Oppo Find N2
158
The Timbre score represents how well a phone reproduces sound across the audible tonal range and takes into account bass, midrange, treble, tonal balance, and volume dependency. It is the most important attribute for playback.

Dynamics
Oppo Find N2
149
The Dynamics score measures the accuracy of changes in the energy level of sound sources, for example how precisely a bass note is reproduced or the impact sound from drums.

Spatial
Oppo Find N2
162
The sub-attributes for spatial tests include pinpointing a specific sound's location, its positional balance, distance, and wideness.

Volume
Oppo Find N2
162
The Volume score represents the overall loudness of a smartphone and how smoothly volume increases and decreases based on user input.
| Hip-Hop | Classical | |
| Oppo Find N2 | 70.8 dBA | 67.2 dBA |
| Samsung Galaxy Z Fold4 | 71.1 dBA | 67.3 dBA |
| Xiaomi Mix Fold 2 | 72.2 dBA | 67.9 dBA |

Artifacts
Oppo Find N2
157
The Artifacts score measures the extent to which the sound is affected by various types of distortion. The higher the score, the less the disturbances in the sound are noticeable. Distortion can occur because of sound processing in the device and because of the quality of the speakers.
It represents the distortion and noise of the device playing our test signal (0 dB Fs, Sweep Sine in an anechoic box at 40 cm) at the device's maximum volume.
Recording
Oppo Find N2
160
DXOMARK engineers test recording by evaluating the recorded files on reference audio equipment. Those recordings are done in our labs and in real-life conditions, using default apps and settings.
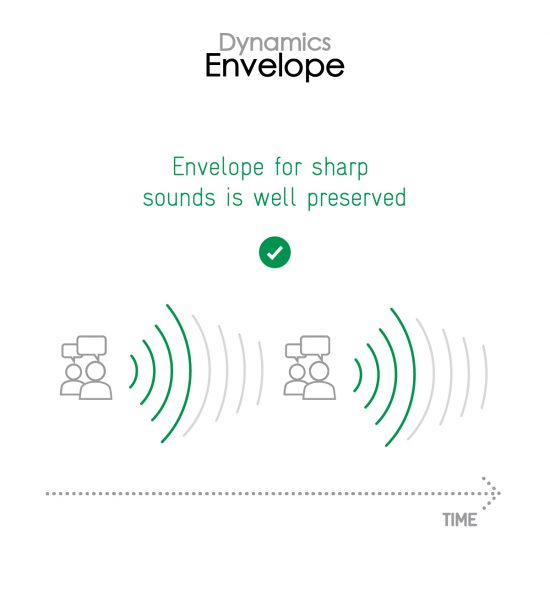
The Oppo Find N2 did very well in recording. Timbre was excellent, with the tonal balance featuring a bright and natural sound rendition with noticeable warmth. Treble was rich and a well-rendered, while midrange offered a natural and pleasant body, with great clarity and precision in its upper region. Bass was natural but somewhat inconsistent at high sound pressure levels. The device also offered a good dynamics performance, thanks to an accurate and precise envelope rendition.
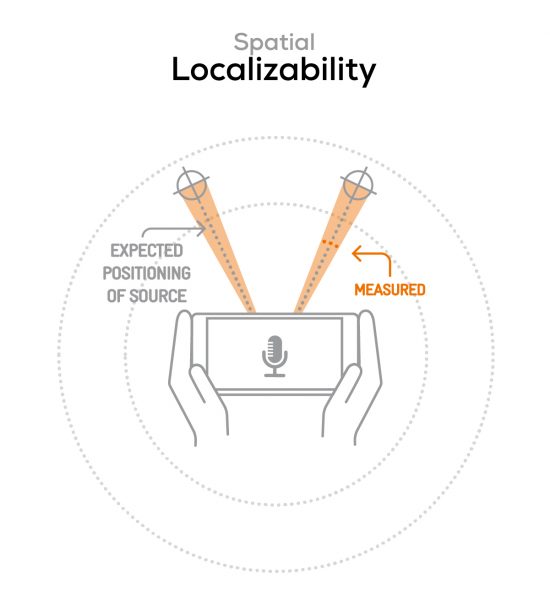
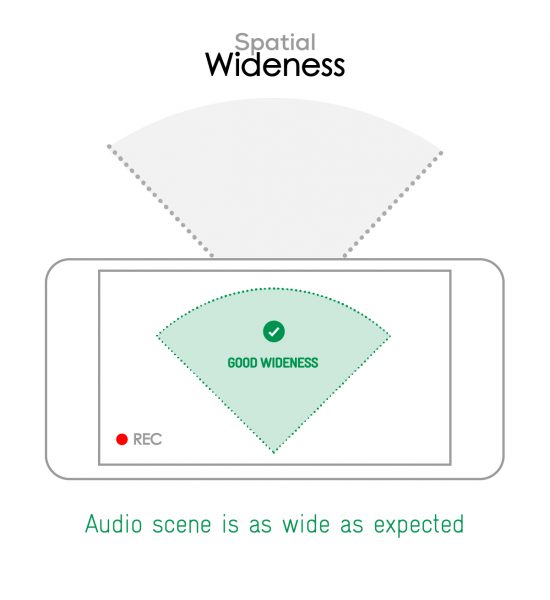
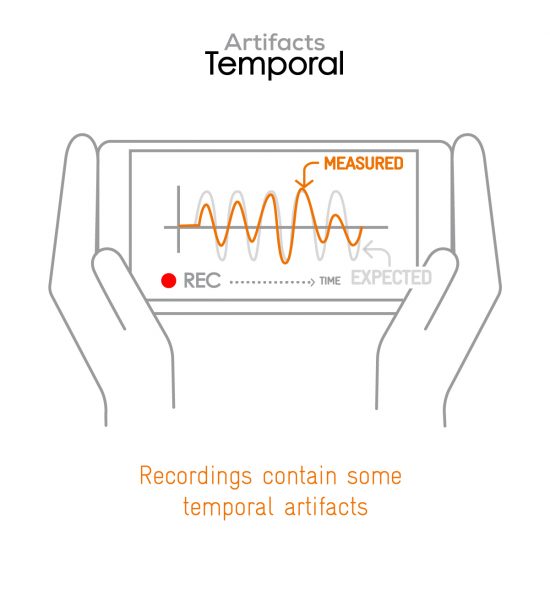
Stereo wideness was very good across all use cases, creating an immersive sound stage. This said, given the device’s large dimensions, our experts had expected even more. Distance rendition was very realistic and good localizability allowed for easy pinpointing of individual sound sources. Recording volume was loud enough and unwanted audio artifacts were pretty well under control, with only some slight distortion and compression noticed at high sound pressure levels. Background tonal balance was realistic and natural, resulting in a clear rendition, however the background tended to be a little loud compared to the main signal in urban environments, resulting in a less good signal-to-noise ratio.
Here is how the Oppo Find N2 performs in recording use cases compared to its competitors:
Timbre
Oppo Find N2
147
The Timbre score represents how well a phone captures sounds across the audible tonal range and takes into account bass, midrange, treble, and tonal balance. It is the most important attribute for recording.
Dynamics
Oppo Find N2
146
The Dynamics score measures the accuracy of changes in the energy level of sound sources, for example how precisely a voice's plosives (the p's, t's and k's, for example) are reproduced. The score also considers the Signal-to-Noise Ratio (SNR), for example how loud the main voice is compared to the background noise.
Spatial
Oppo Find N2
159
The sub-attributes for spatial tests include pinpointing a specific sound's location, its positional balance, distance, and wideness on the recorded audio files.
Volume
Oppo Find N2
170
The Volume score represents how loud audio is normalized on the recorded files and the how the device handles loud environments, such as electronic concerts, when recording.
| Meeting | Life Video | Selfie Video | Memo | |
| Oppo Find N2 | -25 LUFS | -21.3 LUFS | -19.1 LUFS | -18.3 LUFS |
| Samsung Galaxy Z Fold4 | -25.8 LUFS | -21.6 LUFS | -22.7 LUFS | -21 LUFS |
| Xiaomi Mix Fold 2 | -25.3 LUFS | -22.8 LUFS | -19.7 LUFS | -20.8 LUFS |
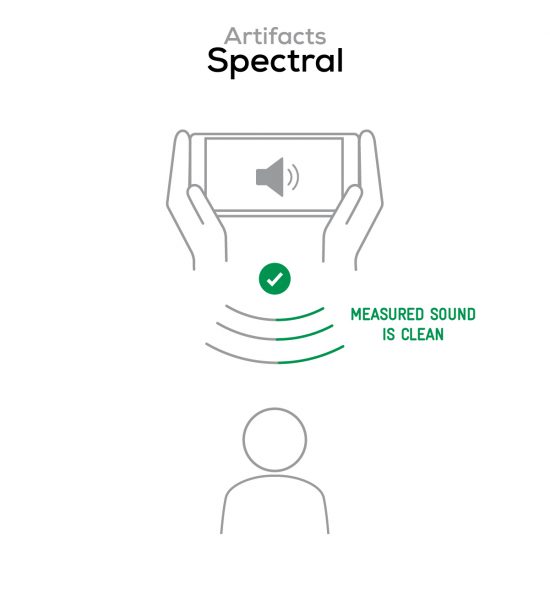
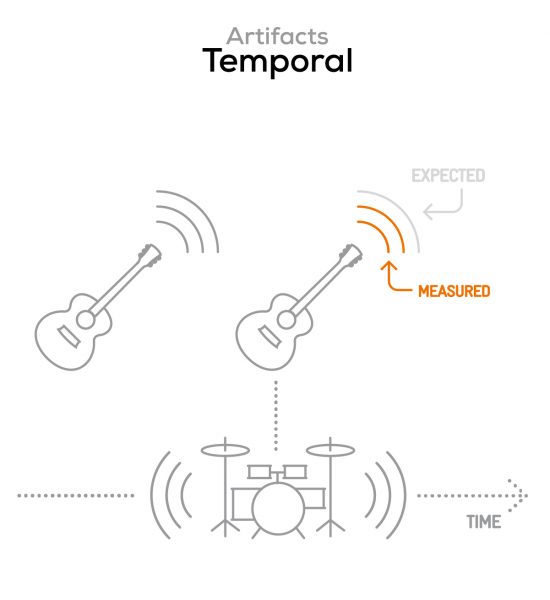
Artifacts
Oppo Find N2
145
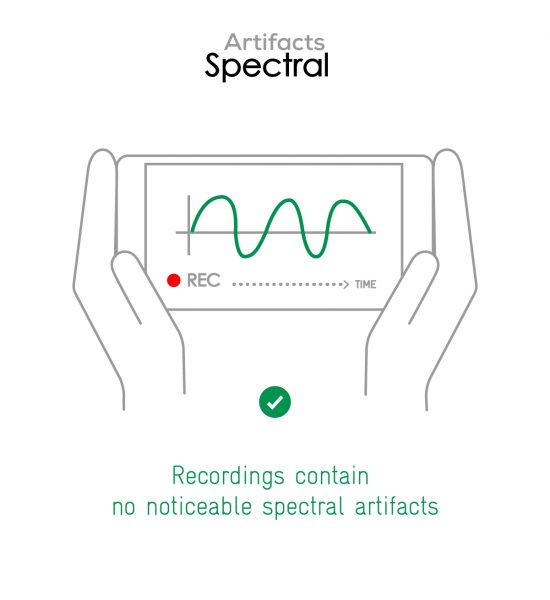
The Artifacts score measures the extent to which the recorded sounds are affected by various types of distortions. The higher the score, the less the disturbances in the sound are noticeable. Distortions can occur because of sound processing in the device and the quality of the microphones, as well as user handling, such as how the phone is held.
In this audio comparison, you can listen to the way this smartphone handles wind noise relative to its competitors:

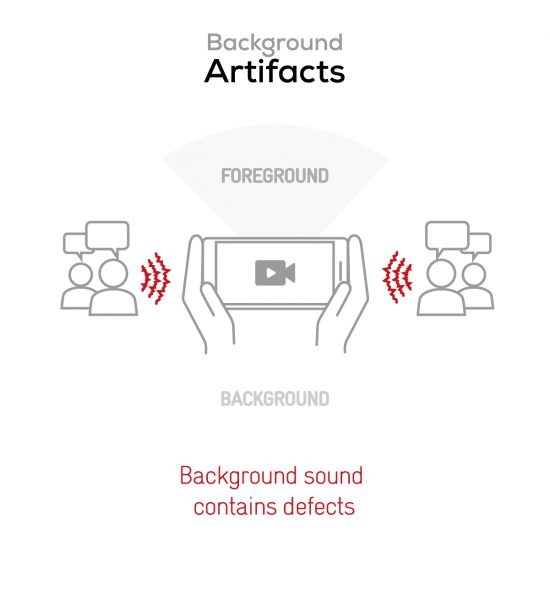
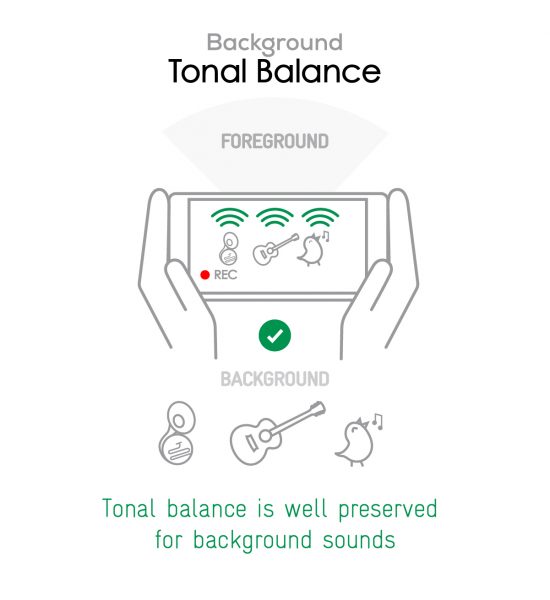
Background
Oppo Find N2
166
Background evaluates how natural the various sounds around a voice blend into the video recording file. For example, when recording a speech at an event, the background should not interfere with the main voice, yet it should provide some context of the surroundings.
DXOMARK encourages its readers to share comments on the articles. To read or post comments, Disqus cookies are required. Change your Cookies Preferences and read more about our Comment Policy.