We put the Sony Xperia 10 IV through our rigorous DXOMARK Battery test suite to measure its performance in autonomy, charging, and efficiency. In these test results, we will break down how it fared in a variety of tests and several common use cases.
Overview
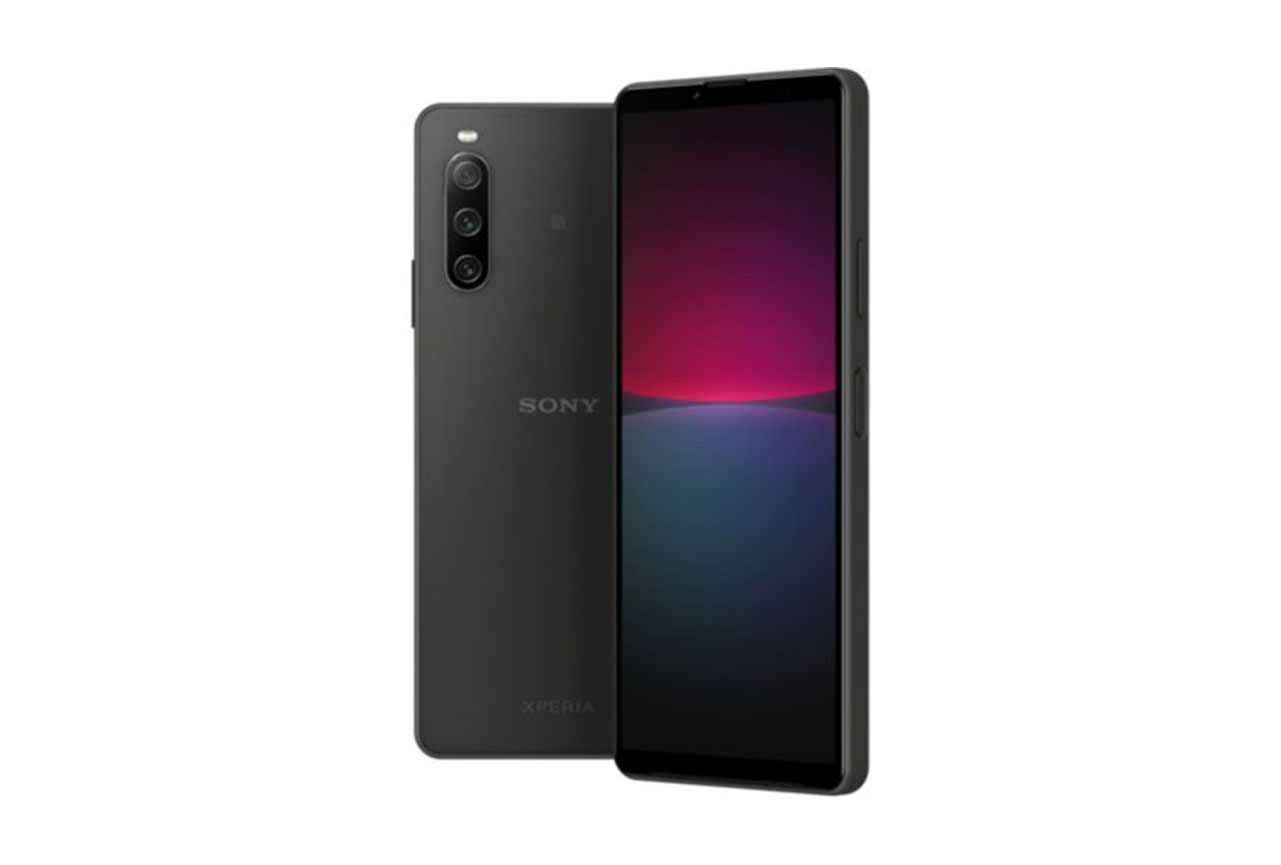
Key specifications:
- Battery capacity: 5000 mAh
- 21W charger (not included)
- 6.0-inch, 1080 x 2520, 60 Hz, OLED display
- Qualcomm Snapdragon 695 5G (6 nm)
- Tested ROM / RAM combination: 128 GB + 6 GB
Scoring
Sub-scores and attributes included in the calculations of the global score.
 Sony Xperia 10 IV

138
battery
182
Honor X7b
Best: Honor X7b (221)
184
Samsung Galaxy M51
Best: Samsung Galaxy M51 (195)
167
Samsung Galaxy M51
Best: Samsung Galaxy M51 (198)
76
Realme GT Neo 5 (240W)
Best: Realme GT Neo 5 (240W) (224)
115
Realme GT Neo 5 (240W)
Best: Realme GT Neo 5 (240W) (212)
97
Nubia RedMagic 7 Pro
Best: Nubia RedMagic 7 Pro (205)
173
Apple iPhone 14 Pro
Best: Apple iPhone 14 Pro (194)
Key performances
These key points are derived from the lab measurements during testing and do not figure into the overall score. The lab measurements, however, are used for the overall score.
3h24 autonomy
after 5-minute charge
Position in Global Ranking

30
th
6. Honor Magic6 Lite (5800 mAh)
156
14. Honor Magic6 Lite (5300 mAh)
150
15. Realme GT Neo 5 (240W)
147
24. Samsung Galaxy S23 Ultra
142
34. Samsung Galaxy A15 LTE
137
35. Apple iPhone 13 Pro Max
136
35. Xiaomi Redmi Note 12 Pro 5G
136
45. Apple iPhone 15 Pro Max
134
45. Xiaomi Redmi Note 11 Pro 5G
134
49. Apple iPhone 14 Pro Max
133
49. Vivo X60 Pro 5G (Snapdragon)
133
49. Xiaomi Redmi Note 11S 5G
133
56. Xiaomi Redmi Note 12 5G
132
56. Xiaomi Redmi Note 10S
132
64. Oppo Reno6 Pro 5G (Snapdragon)
130
64. Samsung Galaxy S24 Ultra
130
66. Samsung Galaxy A34 5G
129
66. Samsung Galaxy A23 5G
129
66. Xiaomi Redmi Note 12 Pro+ 5G
129
66. Xiaomi Redmi Note 10 Pro
129
75. Samsung Galaxy A15 5G
127
84. Samsung Galaxy A13 5G
125
92. Apple iPhone 12 Pro Max
121
92. Samsung Galaxy A55 5G
121
95. Xiaomi Redmi Note 13 Pro 5G
120
95. Xiaomi Redmi Note 10 5G
120
102. Motorola Edge 20 Pro
118
102. Nubia RedMagic 7 Pro
118
107. Samsung Galaxy A14 5G
117
107. Xiaomi Redmi Note 13
117
115. Crosscall Stellar-X5
115
119. Samsung Galaxy Z Fold5
114
119. Xiaomi Mi 10T Pro 5G
114
124. Samsung Galaxy A54 5G
113
128. Motorola Moto G62 5G
112
132. Motorola Moto G9 Power
111
132. Samsung Galaxy S21 Ultra 5G (Snapdragon)
111
132. Xiaomi Redmi Note 13 Pro Plus 5G
111
138. Samsung Galaxy Z Flip5
109
138. Samsung Galaxy S24+ (Exynos)
109
142. Samsung Galaxy S21 5G (Snapdragon)
108
146. Samsung Galaxy S24 (Exynos)
107
146. Xiaomi Mi 11 Lite 5G
107
148. Samsung Galaxy A52 5G
106
152. Samsung Galaxy S22 Ultra (Snapdragon)
103
155. Motorola moto g34 5G
102
159. Samsung Galaxy S23 FE
101
159. Samsung Galaxy A35 5G
101
161. Samsung Galaxy S21 5G (Exynos)
100
161. Xiaomi Redmi 10 2022
100
166. Apple iPhone 13 mini
99
166. Samsung Galaxy Z Fold4
99
166. Vivo X80 Pro (Snapdragon)
99
171. Motorola Edge 30 Pro
98
171. Samsung Galaxy S22 Ultra (Exynos)
98
175. Samsung Galaxy A33 5G
96
178. Samsung Galaxy Z Flip4
95
178. Samsung Galaxy S22+ (Exynos)
95
178. Samsung Galaxy A53 5G
95
183. Xiaomi Redmi Note 13 5G
94
185. Apple iPhone 12 mini
93
185. Samsung Galaxy S21 Ultra 5G (Exynos)
93
188. Samsung Galaxy Z Fold3 5G
92
189. Motorola moto g54 5G
90
189. Samsung Galaxy S22 (Snapdragon)
90
195. Apple iPhone SE (2022)
84
197. Samsung Galaxy S21 FE 5G (Snapdragon)
82
201. Samsung Galaxy S22 (Exynos)
75
Position in High-End Ranking
13
th
3. Realme GT Neo 5 (240W)
147
19. Xiaomi Redmi Note 12 Pro+ 5G
129
22. Samsung Galaxy A55 5G
121
29. Samsung Galaxy A54 5G
113
31. Xiaomi Redmi Note 13 Pro Plus 5G
111
33. Samsung Galaxy A52 5G
106
34. Samsung Galaxy S23 FE
101
39. Samsung Galaxy A53 5G
95
41. Apple iPhone SE (2022)
84
Pros
- Outstanding autonomy during a typical usage scenario
- Excellent autonomy across all test cases in calibrated mode
- Outstanding autonomy during on-the-go tests, especially when scrolling on social apps
- Low residual consumption of the charger itself
- Very low discharge currents across all our use cases
Cons
- Long charging time
- Poor autonomy recovered after a 5-minute charge
- Poor charge efficiency
The Sony Xperia 10 IV showed outstanding autonomy across all our tests. In default mode, it had one of the longest typical usage scenarios we’ve tested to date, and it had one of the best autonomy results in the on-the-go tests, especially when scrolling on social apps. When tested in calibrated mode, the device performed very well, having excellent autonomy whatever the use case.
Charging the device’s large 5000 mAh battery to its full capacity lasted 2 hours and 36 minutes because of the small charger. A 5-minute charge boost only yielded an average 3 hours and 24 minutes of autonomy. The charge efficiency was poor, and the residual consumption of the charger when the device was fully charged and still plugged in was above average. But the efficiency of the charger itself was average, and its residual consumption when the device was not plugged in was very low, consuming very little power from the outlet.
When it came to discharge efficiency, the Sony Xperia 10 IV drained very low discharge currents across all our use cases, meaning that the device was well-optimized.
Compared to devices from the same price range ($400 – $599), the Sony Xperia 10 IV’s global score places it near the top of the segment, while its autonomy score takes the top spot. The device also has among the best scores in efficiency for the segment. But its very low charging score, pulled down by the lowest full-charge subscore we have in our database so far, kept it from doing better in the segment.
Test Summary
About DXOMARK Battery tests: For scoring and analysis in our smartphone battery reviews, DXOMARK engineers perform a variety of objective tests over a week-long period both indoors and outdoors. (See our introductory and how we test articles for more details about our smartphone Battery protocol.)
The following section gathers key elements of our exhaustive tests and analyses performed in DXOMARK laboratories. Detailed performance evaluations under the form of reports are available upon request. Do not hesitate to contact us.
|
Battery |
Charger |
Wireless |
Display |
Processor |
| Sony Xperia 10 IV |
5000mAh |
21W
(not included) |
18W |
OLED
1080 x 2520 |
Qualcomm Snapdragon 695 5G |
| Google Pixel 6a |
4410mAh |
18W
(not included) |
- |
OLED
1080 x 2400 |
Google Tensor |
| Oppo Reno8 Lite 5G |
4500mAh |
33W
(not included) |
- |
AMOLED
1080 x 2400 |
Qualcomm Snapdragon 695 |
Autonomy
177
Honor Magic7 Lite
Honor Magic7 Lite
How Autonomy score is composed
Autonomy score is composed of three performance sub-scores: Stationary, On the go, and Calibrated use cases. Each sub-score comprises the results of a comprehensive range of tests for measuring autonomy in all kinds of real-life scenarios.
113h
Light Usage
Active: 2h30/day
80h
Moderate Usage
Active: 4h/day
50h
Intense Usage
Active: 7h/day
Position in Global Ranking
Battery Life (moderate)
9
th
10. Samsung Galaxy A15 LTE
78h
11. Honor Magic6 Lite (5800 mAh)
77h
13. Honor Magic6 Lite (5300 mAh)
77h
21. Xiaomi Redmi Note 11S 5G
72h
29. Xiaomi Redmi Note 10 5G
70h
33. Apple iPhone 15 Pro Max
69h
34. Samsung Galaxy A15 5G
69h
36. Samsung Galaxy A13 5G
69h
38. Apple iPhone 13 Pro Max
68h
40. Xiaomi Redmi Note 10 Pro
67h
41. Samsung Galaxy S23 Ultra
67h
42. Xiaomi Redmi Note 12 5G
67h
48. Samsung Galaxy A34 5G
65h
50. Apple iPhone 14 Pro Max
65h
53. Samsung Galaxy A23 5G
64h
59. Motorola Moto G9 Power
64h
62. Xiaomi Redmi Note 12 Pro 5G
62h
63. Samsung Galaxy A14 5G
62h
64. Xiaomi Redmi Note 11 Pro 5G
62h
65. Xiaomi Redmi Note 10S
61h
68. Samsung Galaxy A54 5G
60h
87. Samsung Galaxy A55 5G
57h
94. Samsung Galaxy S24 Ultra
56h
96. Samsung Galaxy A52 5G
56h
97. Xiaomi Redmi Note 13 Pro 5G
56h
99. Xiaomi Redmi Note 12 Pro+ 5G
55h
100. Realme GT Neo 5 (240W)
55h
110. Xiaomi Mi 11 Lite 5G
54h
111. Samsung Galaxy Z Fold5
54h
115. Motorola moto g54 5G
53h
117. Nubia RedMagic 7 Pro
53h
123. Motorola Edge 20 Pro
52h
134. Xiaomi Mi 10T Pro 5G
51h
138. Vivo X60 Pro 5G (Snapdragon)
51h
139. Xiaomi Redmi Note 13 5G
50h
145. Samsung Galaxy S21 5G (Snapdragon)
50h
147. Samsung Galaxy A35 5G
49h
148. Samsung Galaxy A53 5G
49h
153. Samsung Galaxy S24+ (Exynos)
49h
155. Xiaomi Redmi Note 13 Pro Plus 5G
49h
156. Samsung Galaxy S24 (Exynos)
49h
157. Apple iPhone 12 Pro Max
49h
158. Samsung Galaxy Z Fold4
49h
160. Samsung Galaxy S21 Ultra 5G (Snapdragon)
48h
162. Oppo Reno6 Pro 5G (Snapdragon)
48h
165. Motorola Edge 30 Pro
47h
166. Samsung Galaxy A33 5G
47h
167. Samsung Galaxy S22 Ultra (Snapdragon)
47h
168. Samsung Galaxy S23 FE
47h
170. Samsung Galaxy Z Flip5
46h
171. Samsung Galaxy S21 5G (Exynos)
46h
173. Nubia RedMagic 6 Pro
46h
178. Samsung Galaxy S22 Ultra (Exynos)
44h
181. Vivo X80 Pro (Snapdragon)
43h
183. Samsung Galaxy Z Fold3 5G
43h
184. Samsung Galaxy Z Flip4
42h
186. Samsung Galaxy S21 Ultra 5G (Exynos)
41h
188. Apple iPhone 13 mini
41h
189. Apple iPhone 12 mini
40h
191. Samsung Galaxy S22+ (Exynos)
40h
192. Samsung Galaxy S22 (Snapdragon)
39h
195. Samsung Galaxy S21 FE 5G (Snapdragon)
38h
198. Apple iPhone SE (2022)
37h
200. Samsung Galaxy S22 (Exynos)
35h
Position in High-End Ranking
Battery Life (moderate)
2
nd
10. Samsung Galaxy A54 5G
60h
19. Samsung Galaxy A55 5G
57h
22. Samsung Galaxy A52 5G
56h
23. Xiaomi Redmi Note 12 Pro+ 5G
55h
24. Realme GT Neo 5 (240W)
55h
33. Samsung Galaxy A53 5G
49h
35. Xiaomi Redmi Note 13 Pro Plus 5G
49h
37. Samsung Galaxy S23 FE
47h
41. Apple iPhone SE (2022)
37h
A robot housed in a Faraday cage performs a set of touch-based user actions during what we call our “typical usage scenario” (TUS) — making calls, video streaming, etc. — 4 hours of active use over the course of a 16-hour period, plus 8 hours of “sleep.” The robot repeats this set of actions every day until the device runs out of power.
Typical Usage Scenario discharge curves
184
Samsung Galaxy M51
Samsung Galaxy M51
Using a smartphone on the go takes a toll on autonomy because of extra “hidden” demands, such as the continuous signaling associated with cellphone network selection, for example. DXOMARK Battery experts take the phone outdoors and perform a precisely defined set of activities while following the same three-hour travel itinerary (walking, taking the bus, the subway…) for each device
Autonomy for on the go use cases (full charge)
167
Samsung Galaxy M51
Samsung Galaxy M51
For this series of tests, the smartphone returns to the Faraday cage and our robots repeatedly perform actions linked to one specific use case (such as gaming, video streaming, etc.) at a time. Starting from an 80% charge, all devices are tested until they have expended at least 5% of their battery power.
Autonomy for calibrated use cases (full charge)
Charging
93
Realme GT Neo 5 (240W)
Realme GT Neo 5 (240W)
How Charging score is composed
Charging is fully part of the overall battery experience. In some situations where autonomy is at a minimum, knowing how fast you can charge becomes a concern. The DXOMARK Battery charging score is composed of two sub-scores, (1) Full charge and (2) Quick boost.
76
Realme GT Neo 5 (240W)
Realme GT Neo 5 (240W)
Full charge tests assess the reliability of the battery power gauge; measure how long and how much power the battery takes to charge from zero to 80% capacity, from 80 to 100% as shown by the UI, and until an actual full charge.
Position in Global Ranking
Charging Time 0-80%
193
rd
1. Realme GT Neo 5 (240W)
0h08
24. Oppo Reno6 Pro 5G (Snapdragon)
0h22
31. Xiaomi Redmi Note 12 Pro+ 5G
0h24
32. Vivo X80 Pro (Snapdragon)
0h24
37. Xiaomi Redmi Note 13 Pro Plus 5G
0h26
59. Xiaomi Redmi Note 13 Pro 5G
0h31
65. Xiaomi Redmi Note 12 Pro 5G
0h33
75. Samsung Galaxy S23 Ultra
0h37
76. Samsung Galaxy S22+ (Exynos)
0h37
80. Samsung Galaxy S24 Ultra
0h38
81. Xiaomi Redmi Note 11 Pro 5G
0h38
84. Samsung Galaxy S22 Ultra (Snapdragon)
0h39
85. Samsung Galaxy S22 Ultra (Exynos)
0h40
86. Vivo X60 Pro 5G (Snapdragon)
0h40
93. Samsung Galaxy S24+ (Exynos)
0h42
99. Xiaomi Redmi Note 12 5G
0h44
102. Honor Magic5 Lite 5G
0h46
103. Samsung Galaxy S21 Ultra 5G (Snapdragon)
0h46
104. Honor Magic6 Lite (5300 mAh)
0h47
108. Samsung Galaxy Z Flip5
0h48
109. Samsung Galaxy S21 5G (Exynos)
0h48
110. Samsung Galaxy S24 (Exynos)
0h49
111. Samsung Galaxy S21 5G (Snapdragon)
0h49
113. Xiaomi Redmi Note 11
0h49
114. Samsung Galaxy S23 FE
0h49
117. Samsung Galaxy A23 5G
0h49
119. Samsung Galaxy S22 (Snapdragon)
0h50
121. Samsung Galaxy Z Fold5
0h51
122. Samsung Galaxy S22 (Exynos)
0h51
123. Samsung Galaxy A35 5G
0h51
125. Apple iPhone SE (2022)
0h51
125. Samsung Galaxy A34 5G
0h51
127. Samsung Galaxy S21 Ultra 5G (Exynos)
0h51
128. Apple iPhone 12 mini
0h52
129. Xiaomi Redmi Note 10
0h52
130. Xiaomi Redmi Note 10S
0h52
132. Samsung Galaxy A55 5G
0h52
133. Samsung Galaxy A54 5G
0h52
135. Xiaomi Redmi Note 13 5G
0h53
136. Samsung Galaxy S21 FE 5G (Snapdragon)
0h53
139. Xiaomi Redmi Note 11S 5G
0h54
139. Samsung Galaxy A33 5G
0h54
141. Samsung Galaxy A15 LTE
0h54
142. Samsung Galaxy A15 5G
0h54
143. Apple iPhone 15 Plus
0h54
144. Xiaomi Redmi Note 10 Pro
0h55
145. Apple iPhone 15 Pro Max
0h56
146. Samsung Galaxy Z Fold4
0h56
147. Honor Magic6 Lite (5800 mAh)
0h56
149. Samsung Galaxy A53 5G
0h57
150. Samsung Galaxy Z Flip4
0h57
151. Apple iPhone 12 Pro Max
0h57
152. Apple iPhone 13 mini
0h57
153. Samsung Galaxy Z Fold3 5G
0h57
159. Apple iPhone 13 Pro Max
1h01
163. Apple iPhone 14 Plus
1h03
169. Apple iPhone 14 Pro Max
1h06
175. Motorola moto g34 5G
1h12
177. Samsung Galaxy A52 5G
1h15
180. Crosscall Stellar-X5
1h20
183. Xiaomi Redmi Note 10 5G
1h22
186. Xiaomi Redmi 10 2022
1h25
188. Motorola Moto G62 5G
1h26
189. Motorola moto g54 5G
1h26
190. Samsung Galaxy A14 5G
1h28
191. Samsung Galaxy A13 5G
1h30
198. Motorola Moto G9 Power
1h53
Position in High-End Ranking
Charging Time 0-80%
41
st
1. Realme GT Neo 5 (240W)
0h08
7. Xiaomi Redmi Note 12 Pro+ 5G
0h24
11. Xiaomi Redmi Note 13 Pro Plus 5G
0h26
29. Samsung Galaxy S23 FE
0h49
30. Apple iPhone SE (2022)
0h51
31. Samsung Galaxy A55 5G
0h52
32. Samsung Galaxy A54 5G
0h52
33. Samsung Galaxy A53 5G
0h57
39. Samsung Galaxy A52 5G
1h15
Power consumption and battery level during full charge
The charging curves, in wired and wireless (if available) showing the evolution of the battery level indicator as well as the power consumption in watts during the stages of charging toward full capacity.
The time to full charge chart breaks down the necessary time to reach 80%, 100% and full charge.
115
Realme GT Neo 5 (240W)
Realme GT Neo 5 (240W)
With the phone at different charge levels (20%, 40%, 60%, 80%), Quick boost tests measure the amount of charge the battery receives after being plugged in for 5 minutes. The chart here compares the average autonomy gain from a quick 5-minute charge.
Average autonomy gain for a 5 minute charge (wired)
Efficiency
143
Oppo Reno6 5G
Oppo Reno6 5G
How Efficiency score is composed
The DXOMARK power efficiency score consists of two sub-scores, Charge up and Discharge rate, both of which combine data obtained during robot-based typical usage scenario, calibrated tests and charging evaluation, taking into consideration the device’s battery capacity. DXOMARK calculate the annual power consumption of the product, shown on below graph, which is representative of the overall efficiency during a charge and when in use.
Annual Consumption Sony Xperia 10 IV
3.3 kWh
Efficient
Good
Bad
Inefficient
97
Nubia RedMagic 7 Pro
Nubia RedMagic 7 Pro
The charge up sub-score is a combination of four factors: the overall efficiency of a full charge, related to how much energy you need to fill up the battery compared to the energy that the battery can provide; the efficiency of the travel adapter when it comes to transferring power from an outlet to your phone; the residual consumption when your phone is fully charged and still plugged into the charger; and the residual consumption of the charger itself, when the smartphone is disconnected from it. The chart here below shows the overall efficiency of a full charge in %.
Overall charge efficiency
173
Apple iPhone 14 Pro
Apple iPhone 14 Pro
The discharge subscore rates the speed of a battery’s discharge during a test, which is independent of the battery’s capacity. It is the ratio of a battery’s capacity divided by its autonomy. A small-capacity battery could have the same autonomy as a large-capacity battery, indicating that the device is well-optimized, with a low discharge rate.
Average discharge current


DXOMARK encourages its readers to share comments on the articles. To read or post comments, Disqus cookies are required. Change your Cookies Preferences and read more about our Comment Policy.