DXOMARK’s smartphone protocols are known for evolving with the latest innovations in technology and with the trends in how people use their devices. We regularly organize qualitative and quantitative research with consumer panels in order to capture what truly matters to consumers, anticipate their real-life usage and assess the latest innovations.The results of our studies feed directly into our periodic updates of our testing protocols.
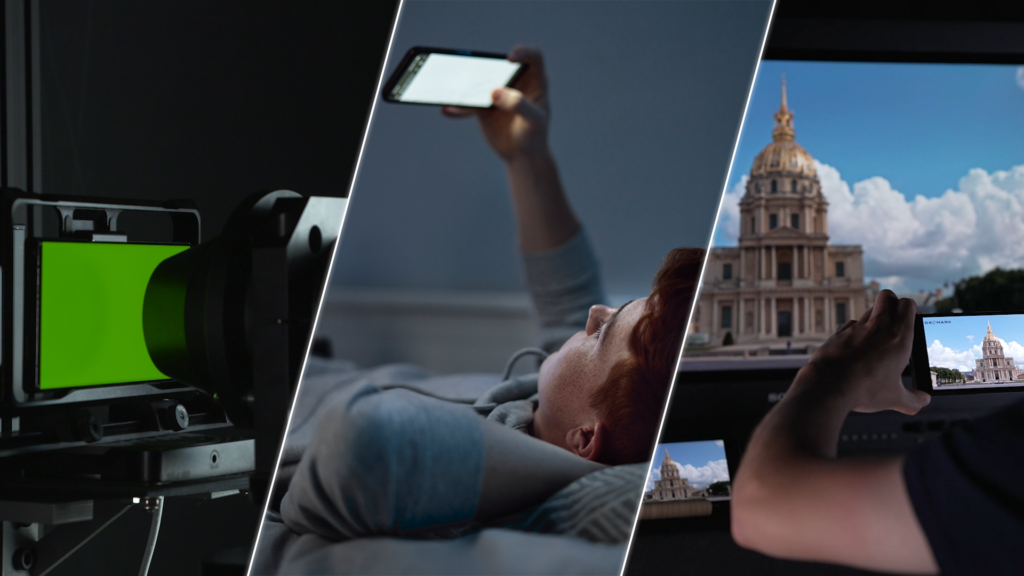
In 2020, DXOMARK launched its Display protocol, which combined lab measurements and real-life tests to evaluate thoroughly the user experience, for example, when browsing the web, watching videos, or viewing photos. But over the years, screen technology has advanced, and users’ habits and expectations have also evolved.
For example, some of the trends we’ve noticed include:
• Devices with higher screen luminance, which could lead to improved readability outdoors
• Various HDR formats that present new challenges to the screen experience
• Color settings adapted to local preferences
• Growing awareness among smartphone users that screen time can affect vision.
So after 4 years, we are now releasing a major update to our already thorough protocol, Display (Version 2), which acknowledges and takes into account the evolution of the smartphone display experience while maintaining DXOMARK’s high testing standards.
This revamp of the protocol aims to make the Display protocol easier to grasp understandable and relevant to readers with:
• new and more precise measurements
• a reorganized scoring structure that brings the number of subscores to four from six
• adjusted score weightings
We’ll go through all the new elements of the updated protocol in greater detail further in the article.
In conjunction with the release of Display v2, DXOMARK is also introducing the Eye Comfort Label, which will give consumers an instant assessment of the device’s user experience in dim light, based on a collection of metrics from our protocol.
Core changes to the protocol
The overall Display score is now derived from four subscores instead of six. Motion, fully linked to video content, has been integrated into our video sub-score while artifacts have been spread across the different subscores in which they have a direct impact. For example, reflectance and flicker, artifacts that can affect the actual readability of the smartphone have been integrated into the Readability subscore.
The new weightings will be as follows:
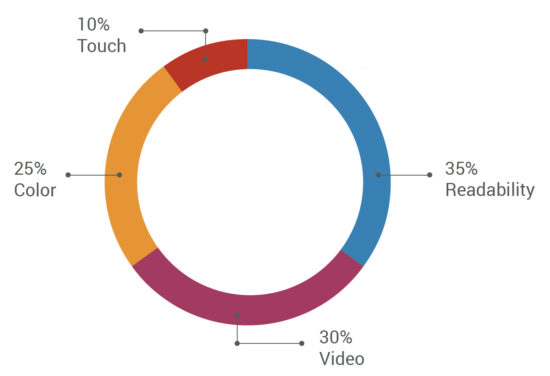
Readability
The most important consideration for end users is how easily and comfortably they can read the display under real-life conditions. The changes in this subscore were driven by the trends we saw in the new phone releases and the attention paid to improving the user experience. For example, new devices were being optimized for outdoor conditions, pushing the boundaries of peak screen brightness, which is supposed to improve readability in bright conditions.
But a phone’s screen peak luminance is not the only factor when evaluating the device’s performance in bright environments and outdoor conditions; other aspects play an important role as well, such as good tuning as well as the reflectance ratio.
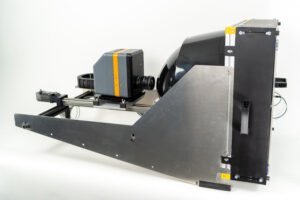
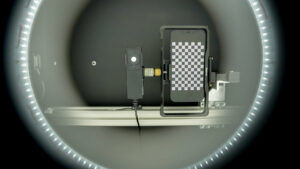
In our state-of-the-art laboratories, we can measure and challenge the display’s maximum brightness capabilities by simulating bright outdoor conditions. For this subscore, ambient adaptation testing has been expanded to include two new outdoor conditions at 20,000 lux and 50,000 lux, including diffused light, in addition to the range of lighting conditions we had before: Indoor (250 lux through 830 lux) and Low light (0 lux through 25 lux).
The artifacts flicker and reflectance have also been integrated into this subscore because they affect the readability experience. Flicker, the quick turning on and off of light, is a temporal artifact that is not perceptible to most people, but it possibly can contribute to eye fatigue when it occurs at a low frequency and a high peak, and this has an impact on readability. Reflectance, which shows how light is dispersed through the display, reduces the readability of the viewed image or information, having an impact on readability.
Color
Color fidelity is the ability of the display to faithfully reproduce the exact same hues and shades from the collected color information. The previous version of our protocol tested color only in the device’s default mode. But through our testing, we saw that a device’s default color performance in relation to the standard white point reference for outdoor conditions (D65) showed a marked difference depending on geographical preferences.
That’s why we have decided to make a major change to our color testing. To measure color accuracy, for example, we have added metrics to evaluate the “natural” or “faithful” color mode, if that mode is not the default. However, some metrics in the Color subscore will still only be tested in default mode, such as on-angle color shifts — the reason being that any angular color shift would be visible regardless of default or faithful color mode.
This subscore also includes tests for the device’s chromatic adaptation to ambient light, meaning how well it preserves the appearance of the objects’ colors in relation to the reference white point when the screen is adjusting to changes in lighting. In addition to the indoor and outdoor environments we were testing, which span 830 lux to 20,000 lux, we’ve now added challenging low-light measurements, which span 0 lux to 25 lux to the color attribute.
Video
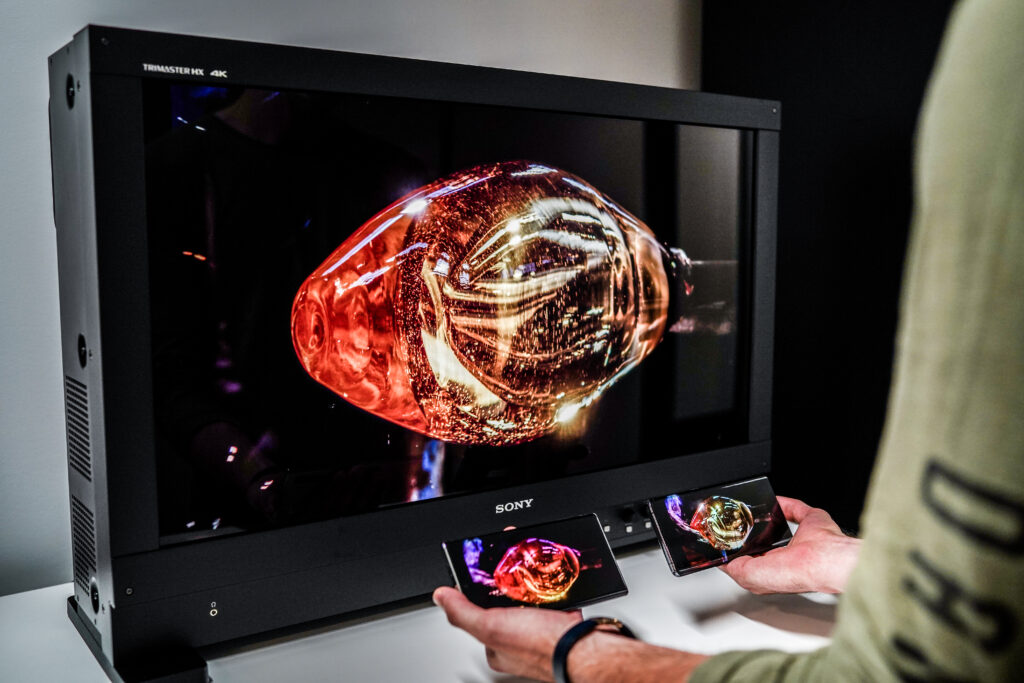
From a technical perspective, the higher screen luminance in more performant devices should be a plus for the HDR video-watching experience, even though it presents challenges in tone mapping. In addition, the variety of HDR formats and the constraints in being able to view all the benefits of HDR content mean that users are probably not getting a consistent HDR experience.
A dedicated qualitative survey11 HDR Playback user preferences, a qualitative survey by DXOMARK on a panel of 30 people in January 2024. that we conducted on the topic revealed that users had different expectations from their screens when viewing HDR content and that those preferences (for example on contrast and brightness) depended heavily on the lighting environments.
Video evaluations were previously limited to a dark room (<5 lux) environment. In the new version of the Display protocol, we have taken into account that people watch video content in various lighting conditions, so we’ve added a new bright indoor (830 lux) evaluation, with lab measurements as well as perceptual analyses.
Under these lighting conditions, our metrics will cover, among other things, the extent of the color area that the device can render, color accuracy, and luminance. We are enriching the video testing with a new perceived contrast metric derived from the HDR Electro-Optical Transfer Function (EOTF), which measures the conversion of an electronic signal into a certain level of brightness on a display.
Lighting conditions have a strong impact on a display’s brightness and reflection. The device must adapt its tone curve to every changing situation in order to provide a perceptually uniform rendering. We analyzed these strategies, and our findings on HDR Playback perceptions enabled us to define a range for contrast that would correspond to user preferences while keeping the rendering acceptable.
Another change to our Video subscore evaluation is the integration of motion testing. Here, aspects of video are measured and evaluated such as frame drops (when the display fails to display frames properly before moving to the next frame), which could lead to video artifacts such as stutter (when the same frame is shown twice before displaying the next frame).
Touch
The Touch subscore remains generally unchanged, although evaluations have been refined. For example, response time measurements will reflect average, minimum and maximum performances. Touch accuracy will also look for reactions to unwanted touches.
We have also integrated the specific “jello” artifact as part of a foldable device’s smoothness evaluation.
Introduction to the Eye Comfort Label
It is well-documented that people are spending more time in front of their phone displays. Reports and studies have also linked increased screen time to eye fatigue or trouble sleeping. Consumers in general are growing more aware that high screen usage can have some health repercussions.
Smartphone makers have started to include features on their latest devices that help users monitor their time in front of the screens or allow them to activate blue-light filters or night mode to try to alleviate potentially harmful effects.
Our consumer surveys22 According to a survey run on Social media by DXOMARK on 1737 respondents in February 2024 also have shown that users are factoring eye comfort into their buying decisions. The majority of the users we surveyed declared that they were concerned about their vision health. As a result, almost half of our respondents said that they paid attention to the mention of eye comfort. Many smartphone users responded that they always have an eye comfort setting activated or that they make it a habit of activating “Night mode” or “eye comfort mode” every evening.
DXOMARK’s detailed measurements in the Display protocol can help determine to what extent the device helps to reduce eye fatigue or the impact on the sleep cycle. We have extracted the key metrics of the protocol that determine whether the display experience is easy on the eyes to create the DXOMARK Eye Comfort Label. Backed by solid measurements and transparency on the specific requirements needed to pass, our Eye Comfort label aims to be relevant to users. Please note that the Eye Comfort Label is not part of the Display protocol and does not factor into the scoring of the device.
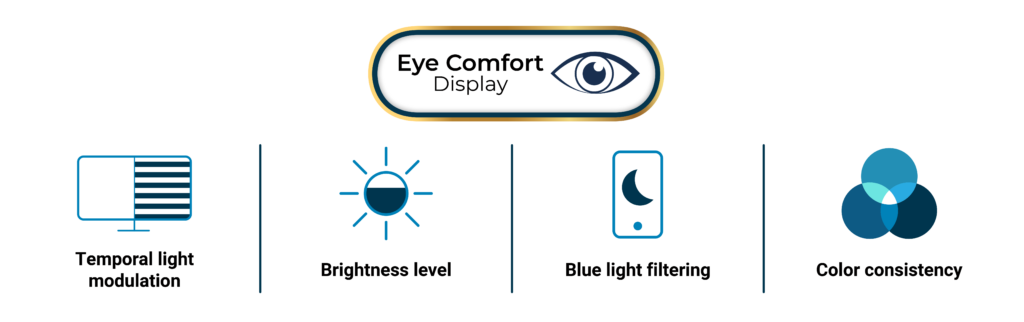
Our criteria include:
- Flicker / Temporal light modulation
Flicker is a phenomenon associated to the temporal modulation of light, the quick oscillation of light output between on and off on a screen. All screens have temporal light modulation to some degree because of the interaction between the screen’s refresh rate (whether 60 Hz, 90 Hz or 120 Hz) and Pulse Width Modulation (the power that turns the light on and off for a certain duration.) Flicker relates to temporal modulation frequencies inferior to 90 Hz .
Flicker is known to create unease, eye fatigue, or in the most extreme cases, seizures. Additionally, its impact varies considerably among individuals; some people are even able to perceive the modulation. The effect of flicker tends to be stronger under dim environments as the screen and our eyes adapt to the darker light.
That’s why this measurement is important for assessing display comfort.
DXOMARK measures the behavior of a smartphone’s flicker in order to assess flicker perception. For our Eye Comfort label, the detection probability of flicker should be below 50%, in default mode or with the anti-flicker mode activated (if available).
- Brightness levels
The objective for brightness levels in night mode is that when the screen is suddenly activated in the dark or in low light, it does not shock the eyes and blind the user as the phone’s brightness levels automatically adjust to the environment. We require the screen to reach a maximum brightness level of only 2 nits, using the manual adjustment, to be considered for the label.
- Blue light filtering
Our studies have shown that consumers are growing more aware of and concerned about the effects that blue light can have on vision and the sleep cycle. Our measurement can help illustrate how the screen performs with these features on or off.
For the Eye Comfort label, we test the night mode performance and the possible impact on the sleep cycle with metrics that are based on scientific research31
Oh, J., Yoo, H., Park, H. et al. Analysis of circadian properties and healthy levels of blue light from smartphones at night. Sci Rep 5, 11325 (2015). https://doi.org/10.1038/srep11325
Gall, D. & Bieske, Karin. (2004). Definition and measurement of circadian radiometric quantities. Proceedings of the CIE Symposium ’04 on Light and Health. 129-132. on the effects of lighting.
Artificial light can disrupt the circadian rhythm by inhibiting the production of melatonin, the hormone that helps us fall asleep. The circadian action factor, which is the ratio of the light energy that can affect the sleep cycle over the visible light energy (a contributor to vision) , is a metric that can help determine how likely the device will impact the body’s inner clock.
To meet the criteria for our label, the smartphone must have a measured circadian action factor of less than 0.65, which corresponds to the equivalent of a neutral white LED lamp, the kind you might use at home. The luminance from the smartphone display should not be any more disruptive to your circadian rhythm than the light in your home.
- Color consistency
Color consistency looks specifically at the impact that the blue-light filtering mode has on color performance. It is a given that colors will shift when the blue light filter is activated, but the user experience should still remain as ideal as possible. A well-tuned device will minimize the effects of the color shift. To meet our criteria for the label, the device must maintain 95% or more of the wide P3 color space coverage when the blue-light filter is activated.
If a product is granted the label, it will appear in the product review, however, the detailed measurements that are associated with the label will be available in the product’s test results. Labels will only apply to the qualifying products tested after April 25 (the launch of Display v2) and not to the retested devices that have been updated for the new version of the protocol.
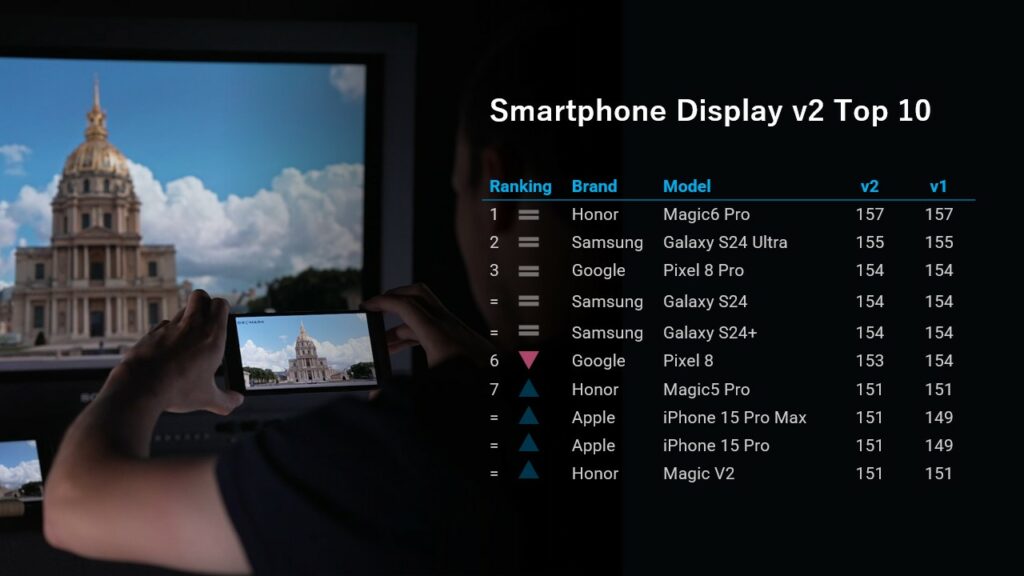
New rankings in Display v2
Now that we’ve gone through the key changes in the Display v2 protocol, let’s see how and why some of the devices shifted positions.
An overview of some retested devices
To give you a better idea of what to expect from the protocol updates described above, in this section, we give you an overview of the major changes on some specific devices.
Under this new protocol version, we saw many devices gain points in readability and video, benefiting from the additional lighting environments tested. Moving to faithful mode evaluation for color accuracy also impacted some devices.
Let’s take a few examples of popular devices to illustrate the protocol changes:
Honor Magic6 Pro
The Honor Magic6 Pro maintains a great overall display experience, remaining the top score in the new version of our protocol. Despite not bringing the maximum luminance of all the products we have tested, the screen remained consistent and comfortable in all lighting conditions, including the two very bright environments that have been added to the new version of our protocol. In video, the Magic6 Pro performed very well, particularly in low light, delivering good brightness and contrast when viewing HDR10 content. In the new indoor lighting environment (at 830 lux), the device delivered a high peak luminance compared to other typical devices, which for some users could detract from a comfortable viewing experience.
Samsung Galaxy S24 Ultra
The Samsung Galaxy S24 Ultra maintained its position in our display ranking. When tested in the new environments, it delivered a consistent and excellent experience even in the brightest conditions with a high peak luminance and low reflectance, resulting in very good readability across the different lighting conditions. In addition, it showed a very good performance in video watching at 830 lux, but when watching in low light, the screen brightness was much too high to view HDR content comfortably. As we had identified in our previous testing, the S24 Ultra’s display colors were more natural than its predecessors’ colors. In addition, testing in the faithful mode, the Samsung Galaxy S24 Ultra displayed a well-tuned natural rendering compared to default mode, despite reflecting some slight color shifts while being viewed at an angle, in a stronger way than its competitors.
Apple iPhone 15 Pro Max
The iPhone 15 Pro Max progressed considerably in our new ranking, particularly because of a strong showing in video, color, and touch. In color, testing without True Tone allowed the device to show accurate colors in all tested environments (the same experience for the iPhone 15). In readability, the device displayed a very high peak luminance and average reflectance in the new environments tested (at 50,000 lux), making the screen very readable when outdoors. However, this luminance strongly depended on the contents viewed (and on the associated APL level), meaning it was more appealing to view photos on the device than check a web page. In video, the device showed a very good performance in both environments (at 0 and 830 lux) with well-adapted brightness and contrast while viewing HDR10 content. Details were well managed indoors, while darker details were slightly too bright in dark environments.
Samsung Galaxy A55 5G
Further down in the price segments, the new version of our protocol made the Galaxy A55 5G shine, with the device gaining a few positions in the ranking. As for other Samsung products, the A55 5G delivered a very good video experience especially in our new indoor (830 lux) environment, especially for HDR10 content thanks to a proper level of brightness, despite a slight lack of luminance in indoor conditions. Tested in faithful mode, the device also showed good overall color rendering, although it showed some saturation in low-light conditions.
It should be noted that under the previous Display protocol, foldable devices benefited from bonus points linked to the size of the unfolded screen in relation to the size of the folded device. But this metric is no longer used in the scoring, resulting in some devices slipping in the ranking. There were some exceptions, though, where the suppression of the screen-to-body ratio bonus points didn’t make a difference to the final results. For example, the Honor Magic v2 and the Oppo Find N2 Flip, both rose in the ranking thanks to strong gains in the other subscores.
Conclusion
To summarize, this update to Display testing brings some new measurements to adjust to the evolution of both technology and device usage. We hope that these new measurements help make the Display protocol more transparent and easier to grasp.
Check out our Closer Look article for a more detailed look and videos about how we test displays.
At DXOMARK, we will continue to optimize our testing methodologies for new technology developments and changes in user behavior, so stay tuned for future updates.
DXOMARK encourages its readers to share comments on the articles. To read or post comments, Disqus cookies are required. Change your Cookies Preferences and read more about our Comment Policy.