Comparison with other full-frame sensors
In comparison with the sensors used by other full-frame main manufacturers, the pixel quality of the Leica M9 sensor remains low.

The results of the Leica M9 are very close to the measurements for the Canon EOS 5D, launched four years ago.
The Leica M9 provides good image quality for low ISO, but its results for high ISO are weak, with dynamic range decreasing very fast. So its Lowlight ISO score (shown below) is a little disappointing, especially for this type of camera. The Leica M9 achieves the lowest score among measured full-frame sensors.

Comparison with Leica M8
Leica improved its overall image quality by switching from the 1.3 crop factor Leica M8 sensor to a new full-frame sensor. The Leica M9 achieves a DxOMark score of 68.6 points, which is almost 10 points higher than the Leica M8 (59.4):
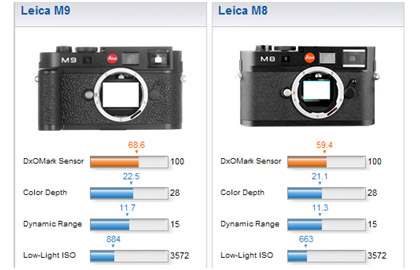
This DxOMark score improvement can be explained by the increase in sensor surface size alone: the Leica M9 sensor surface is 1.66 times larger than the Leica M8. So theoretically, the gap between these two sensors is 0.73 f-stop, leading to an increase of 11 points on the DxOMark Sensor scale for the Leica M9.
Measurement results show that Leica did not improve the quality of the pixel, but just provided more pixels on a larger surface. The results in screen mode, for exactly the same pixel pitch, are shown below:
The SNR 18% is exactly the same between the two models.

Noise reduction applied on almost every ISO
One other important fact is that a slight noise reduction has been detected on all ISOs from ISO 320. To provide the Leica M9 measurements, its noise filtering was precisely evaluated along the whole dynamic and noise curves were corrected by applying the resulting inverse coefficient. This noise filtering is very slight but constant along the whole dynamic. It increases slightly with ISO.
The autocorrelation function for mid-dynamic at ISO 2500 is shown below. Noise filtering is very low but can be observed just around the peak. By integrating this autocorrelation function, we can compute the loss of noise implied by this noise filtering and then apply the coefficient to the RAW noise curve. This allows us to measure the real RAW noise level before noise filtering.
A very slight wider base can be seen for the autocorrelation function, as shown below

The noise filtering is more perceptible when the two noise curves are compared, as shown below:
The noise filtering improves the SNR of 0.82 dB at ISO2500.

Read more information about RAW cooked
Disclaimer: This dxomark review evaluates only the selected camera’s RAW sensor performance metrics (i.e., Color Depth, Dynamic Range, and Low-Light ISO), and should not be construed as a review of the camera’s overall performance, as it does not address such other important criteria as image signal processing, mechanical robustness, ease of use, flexibility, optics, value for money, etc. While RAW sensor performance is critically important, it is not the only factor that should be taken into consideration when choosing a digital camera.
DXOMARK encourages its readers to share comments on the articles. To read or post comments, Disqus cookies are required. Change your Cookies Preferences and read more about our Comment Policy.