
We put the Xiaomi 15 Ultra through our rigorous DXOMARK Camera test suite to measure its performance in photo, video, and zoom quality from an end-user perspective. This article breaks down how the device fared in a variety of tests and several common use cases and is intended to highlight the most important results of our testing with an extract of the captured data.
Overview
Key camera specifications:
- Primary: 50MP 1.0″ sensor, 3.2 µm (4-in-1) pixels,23mm equivalent f/1.63 aperture lens, OIS
- Tele 1: 50MP, 1.4 µm (4-in-1) pixels, 70mm equivalent f/1.8-aperture lens, OIS
- Tele 2: 200MP, 2.24 µm pixels, 100mm equivalent f/2.6-aperture lens (periscope design), OIS
- Ultra-wide: 50MP, 1.28 µm (4-in-1) pixels, 14mm f/2.2-aperture lens
Scoring
Sub-scores and attributes included in the calculations of the global score.
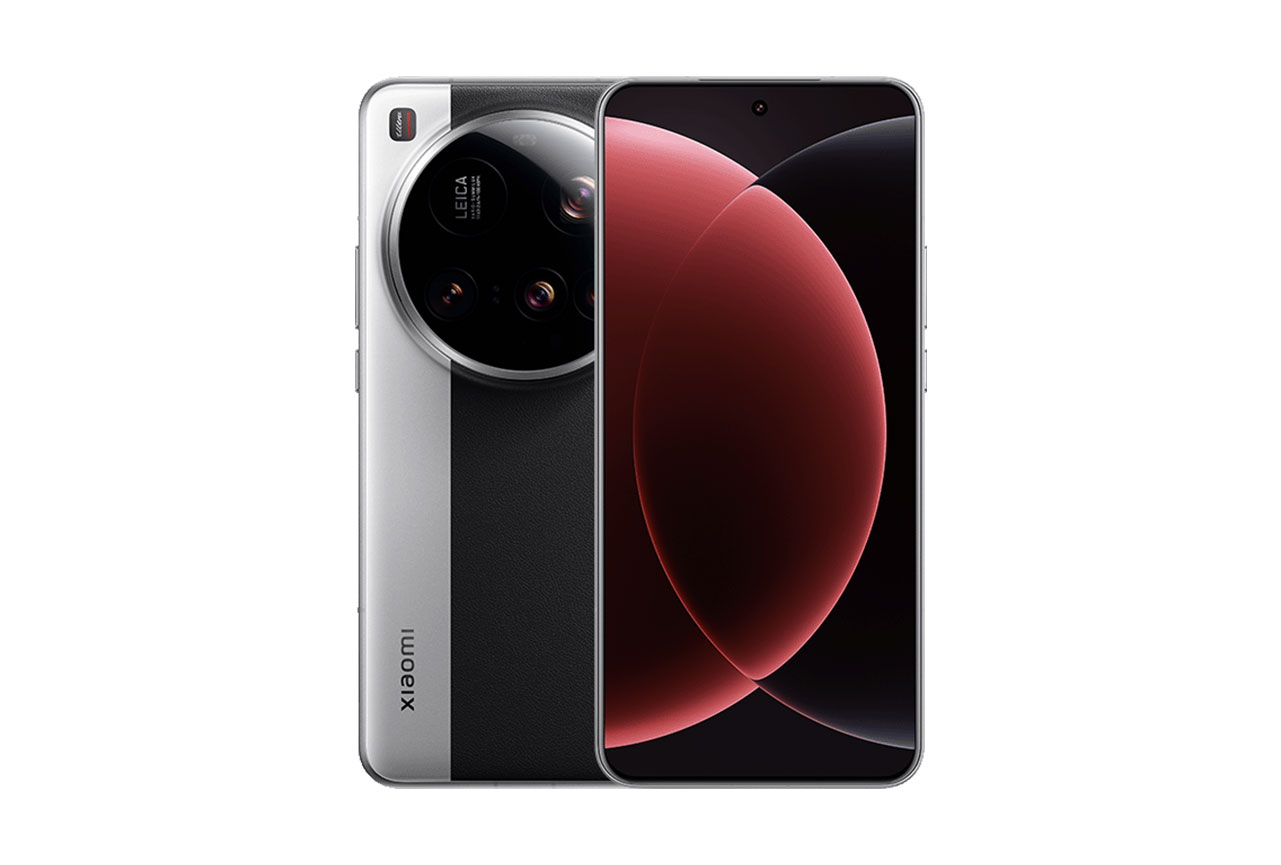
Xiaomi 15 Ultra
Use cases & Conditions
Use case scores indicate the product performance in specific situations. They are not included in the overall score calculations.
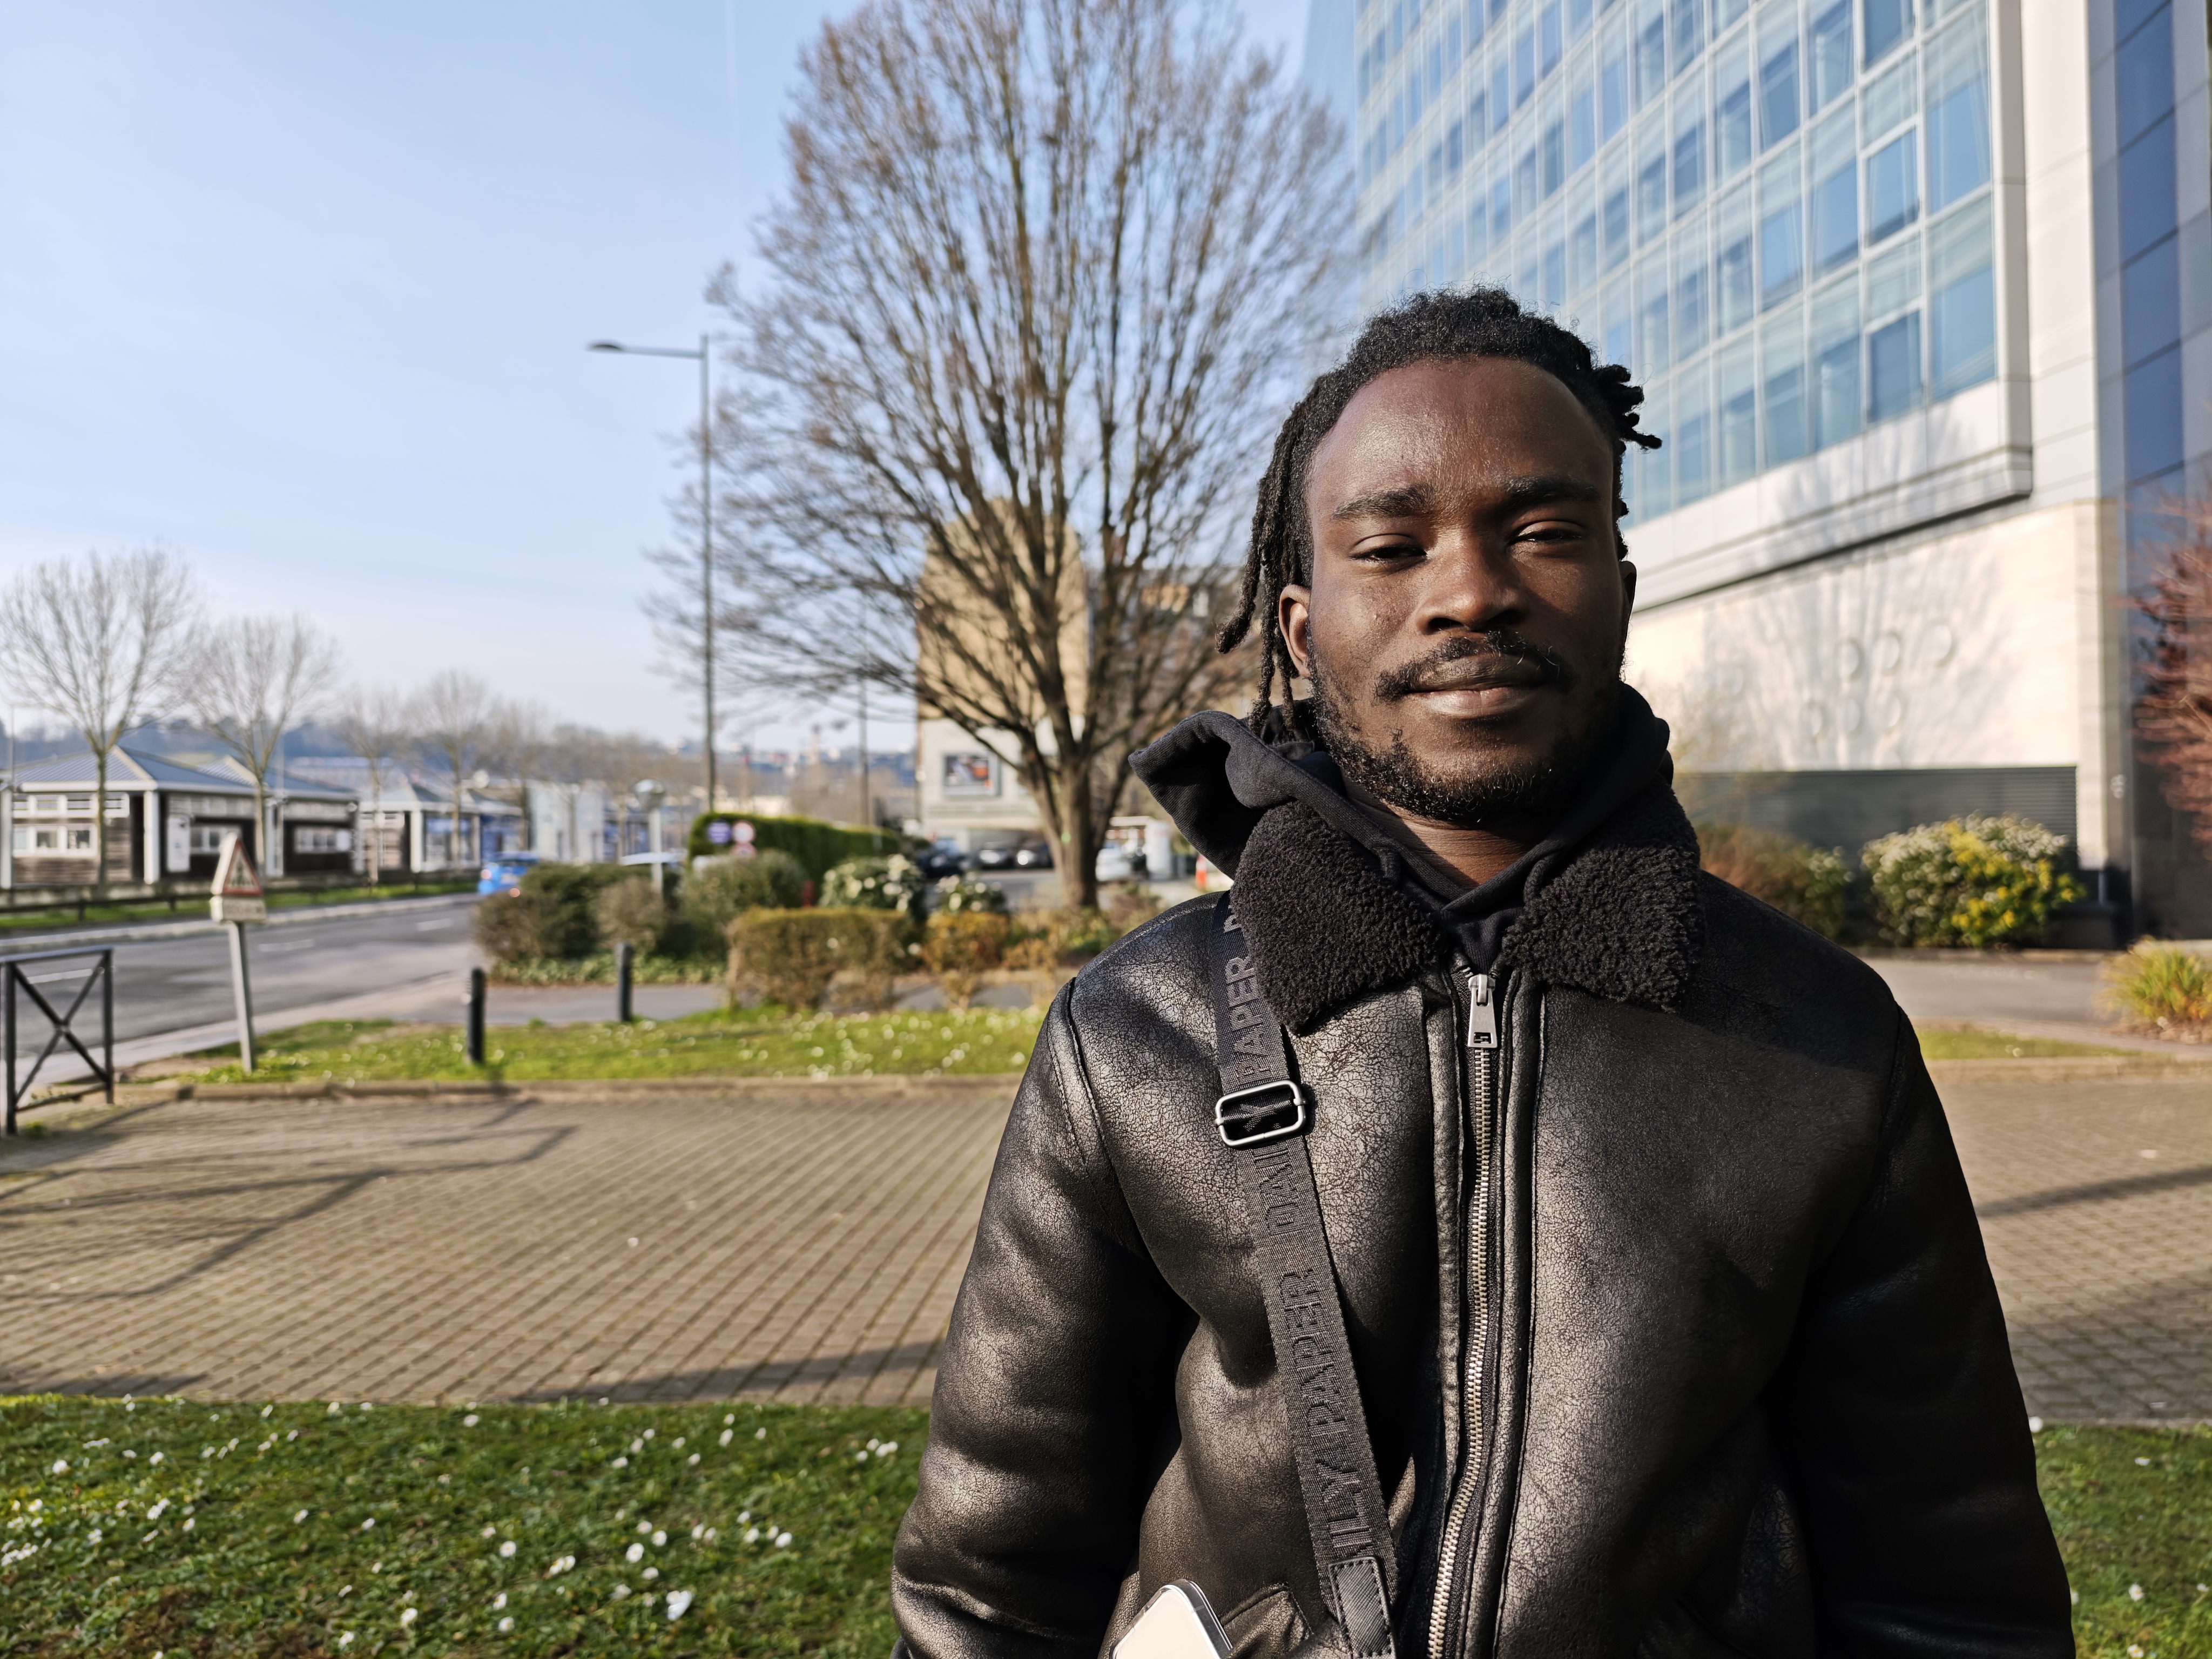
Portrait
Portrait photos of either one person or a group of people
Outdoor
Photos & videos shot in bright light conditions (≥1000 lux)
Indoor
Photos & videos shot in good lighting conditions (≥100lux)
Lowlight
Photos & videos shot in low lighting conditions (<100 lux)
Zoom
Photos and videos captured using zoom (more than 1x)
Pros
- High texture levels and low noise in photo
- Accurate exposure and wide dynamic range in photo and video
- Accurate color rendering and pleasant white balance in bright light photo and video
- High levels of detail across all zoom settings
- Fairly low noise in bright light video
Cons
- Occasional warm color casts in photo and video
- Limited depth of field results in blurred background faces in group shots
- Occasional contrast issues
- Artifacts, including ghosting and flare
- Loss of texture in some shots, especially in low light
- Occasional autofocus stepping
- Less effective video stabilization than some competitors
The Xiaomi Ultra 15 delivered a very good performance in the DXOMARK Camera tests, achieving the best results of a Xiaomi device to date. The new flagship comes with impressive imaging specs, including a total of four image sensors, with pixel counts from 50MP to a whopping 200MP, photo and video HDR modes, as well as a host of other features and modes. In terms of camera hardware, the main improvements over the predecessor are the pixel count on the long tele camera (now 200MP sensor) and the new Qualcomm Snapdragon 8 Elite chipset.
In our photo tests, overall image quality was excellent, with a wide dynamic range, low noise and nice colors. With its consistent performance in preserving details and controlling noise, along with its ability to keep single portraits well-focused and sharp in most conditions, the device has achieved a higher ranking than its predecessor in the DXOMARK protocol.
The tele zoom is the Xiaomi’s main strength, with excellent performance across all tele-zoom settings. In our tests, the 15 Ultra achieved the best results for photo tele zoom to date and was particularly impressive at long-range tele settings. However, at the opposite end of the zoom spectrum, ultra-wide results lagged behind other flagships in some test categories. In the latest version of our protocol, as telephoto and especially long ranges performances play an increasingly important role in the user experience, the smartphone has become even more competitive within the DXOMARK rankings.
Video performance was pretty strong, too, thanks to good exposure and a wide dynamic range, nice colors and low noise. However it could not quite match the best competitors in terms of exposure and color adaptation during scene changes, autofocus, and texture. Video stabilization did a good job at keeping video footage smooth and stable, but was less effective than on the best flagship models, such as the Apple iPhone 16 Pro Max or the Huawei Pura 70 Ultra.
In low light, the Xiaomi 15 Ultra delivered a nice imaging experience, with the camera providing a warm white balance and impressive noise reduction. Exposure was spot on and a wide dynamic range ensured good detail in both the shadow and highlight areas of the frame. On the downside, colors could be oversaturated on occasion, and warm color casts could impact the image output. While the balance between texture retention and noise reduction was impressive for still images, low-light video footage lacked detail and fine textures. When recording video in dim conditions, our testers also noticed some exposure and color adaptation issues when the content of the scene changed.

The Xiaomi 15 Ultra was capable of capturing overall nice portrait shots, with realistic skin tones and good exposure across all light conditions. Still portraits also had high levels of fine detail. The camera’s main drawback in terms of portraiture was its narrow depth of field, which made it difficult to keep all subjects in group shots in focus. Subjects towards the back of a group scene were often blurry.
Xiaomi’s telephoto performance, is among the strongest in the market, offering excellent detail retention, and sharpness, across a wide zoom range. The periscope tele lens delivers clear and vibrant images, even at long distances. Autofocus is fast and accurate, ensuring sharp subjects in both bright and low-light conditions. Noise is well controlled, and HDR processing helps maintain good dynamic range in challenging scenes. While extreme zoom levels can still show some softness, Xiaomi’s telephoto cameras generally perform better than many competitors, providing reliable, high-quality zoom shots that excel in both everyday and demanding photographic scenarios
Test summary
About DXOMARK Camera tests: DXOMARK’s camera evaluations take place in laboratories and real-world situations using a wide variety of use-cases. The scores rely on objective tests for which the results are calculated directly using measurement software in our laboratory setups, and on perceptual tests where a sophisticated set of metrics allow a panel of image experts to compare aspects of image quality that require human judgment. Testing a smartphone involves a team of engineers and technicians for about a week. Photo and Video quality are scored separately and then combined into an overall score for comparison among the cameras in different devices. For more information about the DXOMARK Camera protocol, click here. More details on smartphone camera scores are available here. The following section gathers key elements of DXOMARK’s exhaustive tests and analyses. Full performance evaluations are available upon request. Please contact us on how to receive a full report.
Photo
Xiaomi 15 Ultra
180
For scoring and analysis, DXOMARK engineers capture and evaluate more than 3,800 test images in controlled lab environments as well as outdoor, indoor and low-light natural scenes, using the camera’s default settings. The photo protocol is designed to take into account the main use cases and is based on typical shooting scenarios, such as portraits, landscape and zoom photography. The evaluation is performed by visually inspecting images against a reference of natural scenes, and by running objective measurements on images of charts captured in the lab under different lighting conditions from 0.1 to 10,000+ lux and color temperatures from 2,300K to 6,500K.

Main
Xiaomi 15 Ultra
184
The 15 Ultra delivered an excellent performance in photo mode, making it a great option for any ambitious stills photographer. The HDR format delivered very good contrast and a wide dynamic range, ensuring good exposure and nice color rendering. The level of captured detail was excellent, preserving fine detail with a natural look, without oversharpening. In addition, noise levels were low, even when shooting in low light. This made for an excellent texture/noise trade-off.
Colors were generally nice, with natural skin tones in portrait shots. However, our testers also noticed some local contrast issues in scenes with strong backlighting often being to high and leading to lost information on faces. While the autofocus was mostly reliable and stable, the camera’s primary camera has a very wide aperture, which is great for light collection, but the resulting narrow depth of field made it difficult to keep all subjects in group shots in focus. People at the back were often out of focus.
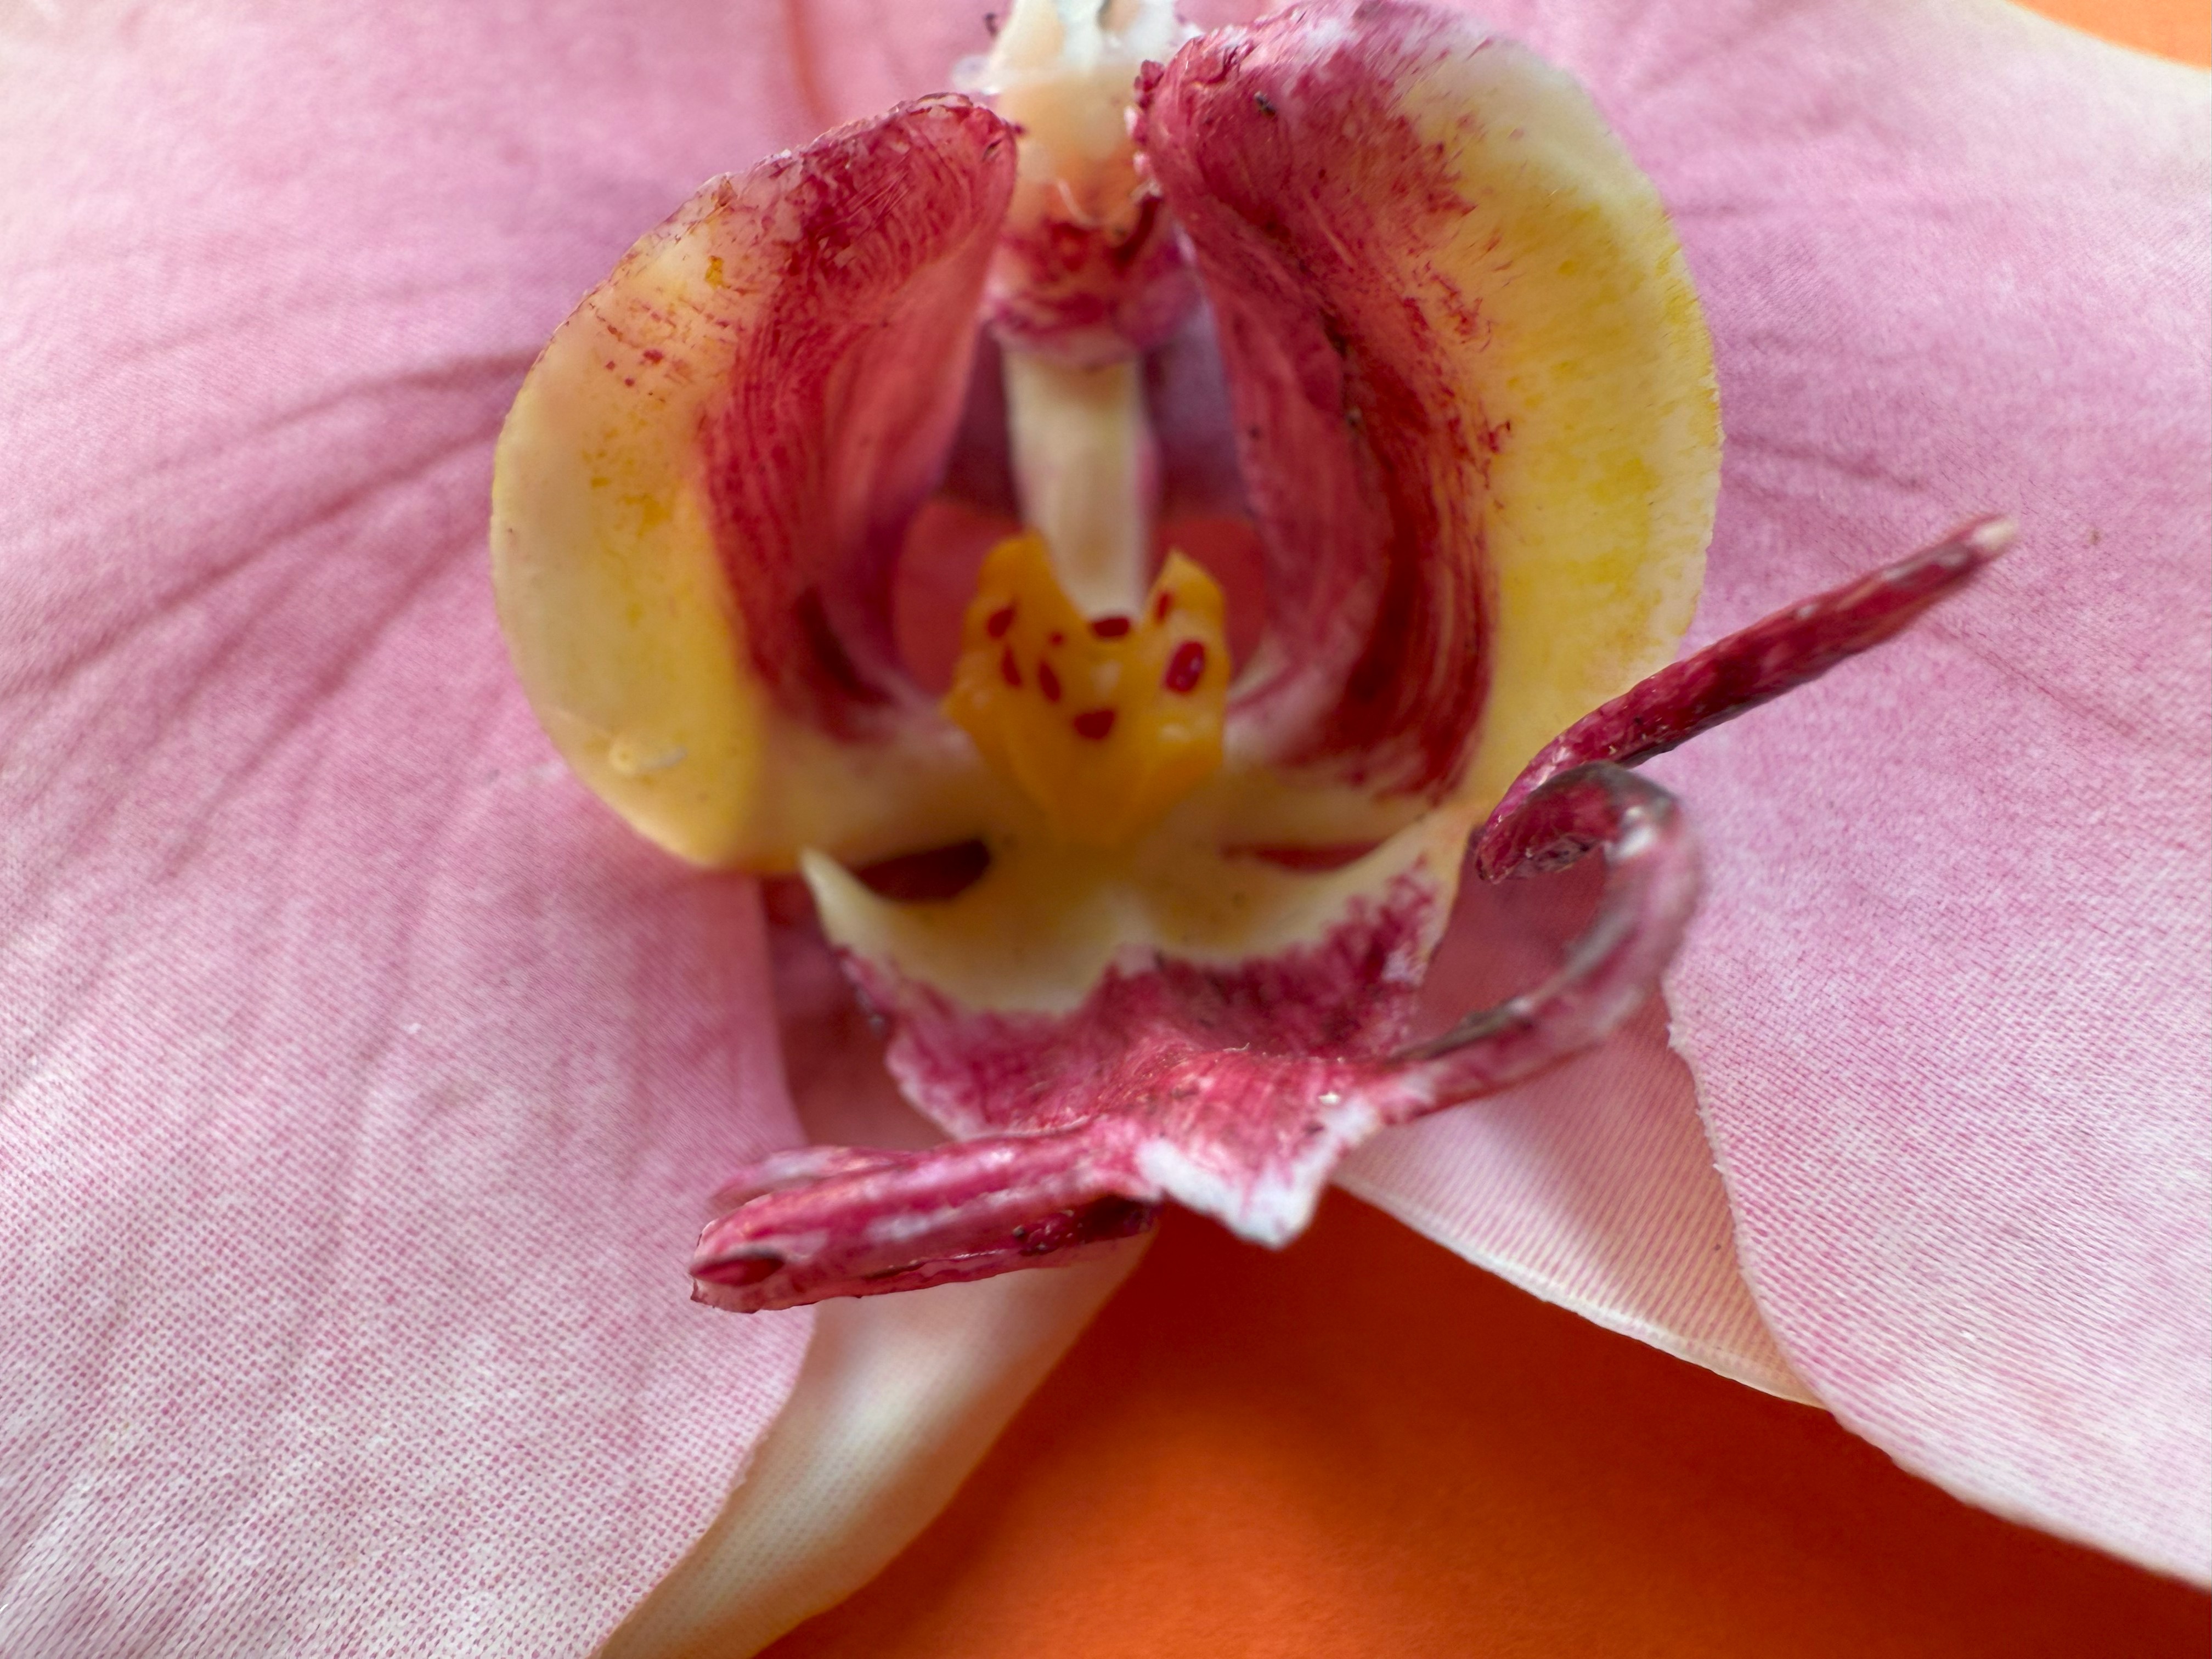
Close-Up
In our tests, the 15 Ultra’s close-up mode did a very good job, capturing good levels of details at close distance. A slight loss of sharpness could be observed at very close shooting distances, but this is similar on most competing devices.


Exposure
Xiaomi 15 Ultra
134
Exposure is one of the key attributes for technically good pictures. The main attribute evaluated is the brightness level of the main subject through various use cases such as landscape, portrait, or still life. Other factors evaluated are the global contrast and the ability to render the dynamic range of the scene (ability to render visible details in both bright and dark areas). When the camera provides Photo HDR format, the images are analyzed with a visualization on an HDR reference monitor, under reference conditions specified in the ISO-22028-5 standard. Repeatability is also important because it demonstrates the camera's ability to provide the same rendering when shooting several images of the same scene.
The Xiaomi delivered very well-exposed pictures in most conditions. Exposure was also very stable and spot-on for portrait, landscape, and still-life shots alike. The camera’s wide dynamic range allowed for good image quality in difficult high-contrast conditions, including strongly backlit scenes. Xiaomi’s HDR rendering was capable of creating nice contrast, tough sometimes slightly strong for users.


Color
Xiaomi 15 Ultra
133
Color is one of the key attributes for technically good pictures. The image quality attributes analyzed are skin-tone rendering, white balance, color shading, and repeatability. For color and skin tone rendering, we penalize unnatural colors according to results gathered in various studies and consumer insights while respecting the manufacturer's choice of color signature.
The 15 Ultra comes with Xiaomi’s signature color rendering, providing neutral but saturated colors in most conditions. Colors were nice, with neutral white balance and accurate skin tones when taking pictures in bright light. Under typical indoor conditions and in low light, colors remained saturated, but our testers observed some, mostly warm, color casts that appears to be well tolerated by users in our Insights studies.

Sharpness & Timing
Xiaomi 15 Ultra
135
Autofocus tests concentrate on focus accuracy, focus repeatability, shooting time delay, and depth of field. Shooting delay is the difference between the time the user presses the capture button and the time the image is actually taken. It includes focusing speed and the capability of the device to capture images at the right time, what is called 'zero shutter lag' capability. Even if a shallow depth of field can be pleasant for a single subject portrait or close-up shot, it can also be a problem in some specific conditions such as group portraits; Both situations are tested. Focus accuracy is also evaluated in all the real-life images taken, from infinity to close-up objects and in low light to outdoor conditions.
Unlike its predecessor, the 14 Ultra, the Xiaomi 15 Ultra is capable of delivering zero shutter lag with a reliable autofocus. We noticed very few autofocus failures in bright light, but when shooting in low light, the autofocus could be slower than the best-in-class devices. Overall the autofocus was quite stable across consecutive shots, with focus reliably locking onto the subject. This said, the primary camera’s quite narrow depth of field meant that subjects not in the focal plane could be out of focus.


Texture
Xiaomi 15 Ultra
132
Texture tests analyze the level of details and the texture of subjects in the images taken in the lab as well as in real-life scenarios. For natural shots, particular attention is paid to the level of details in the bright and dark areas of the image. Objective measurements are performed on chart images taken in various lighting conditions from 0.1 to 10,000+ lux and different kinds of dynamic range conditions. The charts used are the proprietary DXOMARK chart (DMC), and the Dead Leaves chart. We also have an AI based metric for the level of details on our realistic mannequins Eugene and Diana.
The Xiaomi 15 Ultra captured high levels of detail in most conditions, especially when shooting in bright light. Fine detail was preserved well, without being oversharpened, for a natural look of textures. Texture performance in bright light was equal to, or even better than on the Huawei Pura 70 Ultra, but fine detail looked slightly more natural. This said, some detail was lost in low-light shooting. In addition, motion blur was often noticeable on moving subjects in low light.


Noise
Xiaomi 15 Ultra
129
Noise tests analyze various attributes of noise such as intensity, chromaticity, grain, structure on real-life images as well as images of charts taken in the lab. For natural images, particular attention is paid to the noise on faces, landscapes, but also on dark areas and high dynamic range conditions. Noise on moving objects is also evaluated on natural images. Objective measurements are performed on images of charts taken in various conditions from 0.1 to 10000 lux and different kinds of dynamic range conditions. The chart used is the Dead Leaves chart and the standardized measurement such as Visual Noise derived from ISO 15739.
Image noise was well under control in most shooting conditions, with only some barely noticeable fine luminance noise in outdoor and indoor scenes. Even in low light, noise was hardly noticeable, with images retaining good levels of detail.


Artifacts
Xiaomi 15 Ultra
81
The artifacts evaluation looks at flare, lens shading, chromatic aberrations, geometrical distortion, edges ringing, halos, ghosting, quantization, unexpected color hue shifts, among others type of possible unnatural effects on photos. The more severe and the more frequent the artifact, the higher the point deduction on the score. The main artifacts observed and corresponding point loss are listed below.

Bokeh
Xiaomi 15 Ultra
175
Bokeh is tested in one dedicated mode, usually portrait or aperture mode, and analyzed by visually inspecting all the images captured in the lab and in natural conditions. The goal is to reproduce portrait photography comparable to one taken with a DLSR and a wide aperture. The main image quality attributes paid attention to are depth estimation, artifacts, blur gradient, and the shape of the bokeh blur spotlights. Portrait image quality attributes (exposure, color, texture) are also taken into account.
The Xiaomi 15 Ultra’s bokeh mode captured natural-looking images. Subject isolation was mostly natural, with a soft-looking simulated aperture and natural blur gradient. However, some depth estimation artifacts could be noticeable, in addition to some slight exposure and artifact instabilities across consecutive shots. Thanks to its impressive zoom performances, Bokeh usually provided very sharp faces in comparison to Huawei Pura 70 Ultra and even more Apple iPhone 16 Pro Max making it one of our best contester on this feature, along with Oppo Find X8 Ultra.


Tele
Xiaomi 15 Ultra
169
All image quality attributes are evaluated at focal lengths from approximately 40 mm to 300 mm, with particular attention paid to texture and detail. The score is derived from a number of objective measurements in the lab and perceptual analysis of real-life images.
Zoom performance is the Xiaomi 15 Ultra’s main strong point. Thanks to the combination of two tele modules (50MP and 200MP periscope), the 15 Ultra offered very high levels of tele zoom detail, from the primary camera to the long-range tele. Its camera modules delivered impressive levels of detail from close to long-range tele, outperforming even the best competitors in bright light. In addition, image noise was well under control, earning the Xiaomi the top score in the tele zoom category. On the downside, some slight highlight clipping could be noticeable in difficult conditions, for example backlit scenes. We also observed a reduction of detail in low light, but overall tele zoom performance was impressive.


UltraWide
Xiaomi 15 Ultra
169
These tests analyze the performance of the ultra-wide camera at several focal lengths from 12 mm to 20 mm. All image quality attributes are evaluated, with particular attention paid to such artifacts as chromatic aberrations, lens softness, and distortion. Pictures below are an extract of tested scenes.
The 15 Ultra’s 13mm/50MP ultra-wide camera delivered good image quality overall. Distortion on ultra-wide shots was fairly well under control, exposure was mostly accurate and, despite the occasional color cast, colors were nice. Detail levels could be a little low in some conditions. Fine detail was lost, especially in low-light scenes. Our testers also observed some image noise in indoor and low-light shots.


Video
Xiaomi 15 Ultra
172
DXOMARK engineers capture and evaluate almost 3 hours of video in controlled lab environments and in natural low-light, indoor and outdoor scenes, using the camera’s default settings. The evaluation consists of visually inspecting natural videos taken in various conditions and running objective measurements on videos of charts recorded in the lab under different conditions from 0.1 to 10000+ lux and color temperatures from 2,300K to 6,500K.
Main
Xiaomi 15 Ultra
186
The Xiaomi 15 Ultra video mode offers a range of resolution and frame rate settings, up to 8K/30fps and 4K/120fps. Dolby Vision 10-bit HDR recording is available at 4K/60fps and at 1080p resolution settings. The DXOMARK video tests were performed at 4K/60fps with Dolby Vision HDR, which provided the overall best results with image stabilization.
With these settings in our tests, the 15 Ultra delivered good video quality, with good exposure and nice colors. However, it lagged slightly behind the best competitors in terms of detail, noise, and stabilization. Our testers also occasionally found video recording to be slightly unstable, with exposure and color adaptation issues in changing scenes, as well as some autofocus instabilities with stepping.
Exposure
Xiaomi 15 Ultra
127
Exposure tests evaluate the brightness level of the main subject, the global contrast and the ability to render the dynamic range of the scene (ability to render visible details in both bright and dark areas). When the camera provides Video HDR format, the videos are analyzed with a visualization on an HDR reference monitor, under reference conditions specified in the metadata. Stability and temporal adaption of the exposure are also analyzed.
Video exposure was accurate, and the dynamic range of recorded footage was wide in most conditions. We did observe some highlight clipping when shooting in low-light settings, but the Xiaomi’s main area for improvement in terms of video exposure was adaptation to scene changes. Instabilities were noticeable when the content or lighting of a scene changed quickly, and exposure had to adapt.
Color
Xiaomi 15 Ultra
131
Image-quality color analysis looks at color rendering, skin-tone rendering, white balance, color shading, stability of the white balance and its adaption when light is changing.
When recording in bright light, the Xiaomi 15 Ultra delivered accurate and nice color rendering with a neutral white balance. In outdoor settings and under typical indoor lighting, our testers found white balance to be mostly neutral with saturated colors. However, like for exposure, some adaptation issues were noticeable, mostly in low light. In addition, low-light white balance was often very warm, resulting in an overall slightly unnatural color rendering of the scene.
Sharpness & Timing
Xiaomi 15 Ultra
124
For video, autofocus tests concentrate on focus accuracy, focus stability and analysis of convergence regarding speed and smoothness.
Video autofocus was generally fast and reliable in most conditions. However, occasionally the autofocus struggled to adapt to changes in the scene and could lock onto the wrong target. We also noticed some slight autofocus stepping, making transitions less smooth than on the best-in-class rivals.
Texture
Xiaomi 15 Ultra
118
Texture tests analyze the level of details and texture of the real-life videos as well as the videos of charts recorded in the lab. Natural videos recordings are visually evaluated, with particular attention paid to the level of details in the bright and areas as well as in the dark. Objective measurements are performed of images of charts taken in various conditions from 0.1 to 10000 lux. The charts used are the DXOMARK chart (DMC) and Dead Leaves chart.
While detail was excellent when taking still images with the primary and tele-zoom cameras, the Xiaomi struggled slightly with detail capture in video mode. Levels of detail were quite high when recording in bright light, but dropped under indoor conditions and in low light, with a noticeable loss of fine detail. In very low light, scene integrity artifacts (slightly moving texture patches) could further reduce texture quality.
Noise
Xiaomi 15 Ultra
129
Noise tests analyze various attributes of noise such as intensity, chromaticity, grain, structure, temporal aspects on real-life video recording as well as videos of charts taken in the lab. Natural videos are visually evaluated, with particular attention paid to the noise in the dark areas and high dynamic range conditions. Objective measurements are performed on the videos of charts recorded in various conditions from 0.1 to 10000 lux. The chart used is the DXOMARK visual noise chart.
Video noise levels were well-controlled in bright light, but some shadow noise could be noticeable. In low-light recordings, noise was more intrusive, with chroma noise creeping in. Overall, noise was more noticeable than on the best rivals in the 15 Ultra’s class.

Stabilization
Xiaomi 15 Ultra
124
Stabilization evaluation tests the ability of the device to stabilize footage thanks to software or hardware technologies such as OIS, EIS, or any others means. The evaluation looks at residual motion, smoothness, jello artifacts and residual motion blur on walk and run use cases in various lighting conditions. The video below is an extract from one of the tested scenes.
Video stabilization was quite effective but not quite up to the same level as the best competitors. Camera shake was still noticeable in many recordings, both when holding the camera still and when walking or running during recording. Slight sharpness differences between frames could be seen in low-light footage.
Artifacts
Xiaomi 15 Ultra
89
Artifacts are evaluated with MTF and ringing measurements on the SFR chart in the lab as well as frame-rate measurements using the LED Universal Timer. Natural videos are visually evaluated by paying particular attention to artifacts such as aliasing, quantization, blocking, and hue shift, among others. The more severe and the more frequent the artifact, the higher the point deduction from the score. The main artifacts and corresponding point loss are listed below.
UltraWide
Xiaomi 15 Ultra
148
All image quality attributes are evaluated at focal lengths from approximately 12 mm to 30 mm, with particular attention paid to texture and smoothness of the zooming effect. The score is derived from a number of objective measurements in the lab and perceptual analysis of real-life video recordings.
Tele
Xiaomi 15 Ultra
140
All image quality attributes are evaluated at focal lengths from approximately 50 mm to 300 mm, with particular attention paid to texture and smoothness of the zooming effect. The score is derived from a number of objective measurements in the lab and perceptual analysis of real-life video recordings.
The Xiaomi 15 Ultra delivers pleasant video zoom performance, as it offers excellent detail retention, sharpness, and natural color reproduction across various zoom levels, allowing versatile framing without significant quality loss. Autofocus is smooth and reliable in both bright and low-light conditions, ensuring consistently sharp subjects. While some softness and noise can appear at extreme zoom distances, especially in challenging lighting, the Xiaomi 15 Ultra remains one of the top performers in video zoom, though it faces strong competition from other flagship devices pushing the limits of long-range video quality. The device is mostly impacted by its lowlight performances where it struggles to preserve the quality visible in brighter light conditions. Overall, it provides strong performances, but still behind key competitors like Oppo Find X8 Ultra and Apple iPhone 16 Pro Max.