Smartphones  >  Xiaomi 15T Pro  >  Camera Test Results
premium ?

Xiaomi 15T Pro

149
camera

We put the Xiaomi 15T Pro through our rigorous DXOMARK Camera test suite to measure its performance in photo, video, and zoom quality from an end-user perspective. This article breaks down how the device fared in a variety of tests and several common use cases and is intended to highlight the most important results of our testing with an extract of the captured data.

Overview

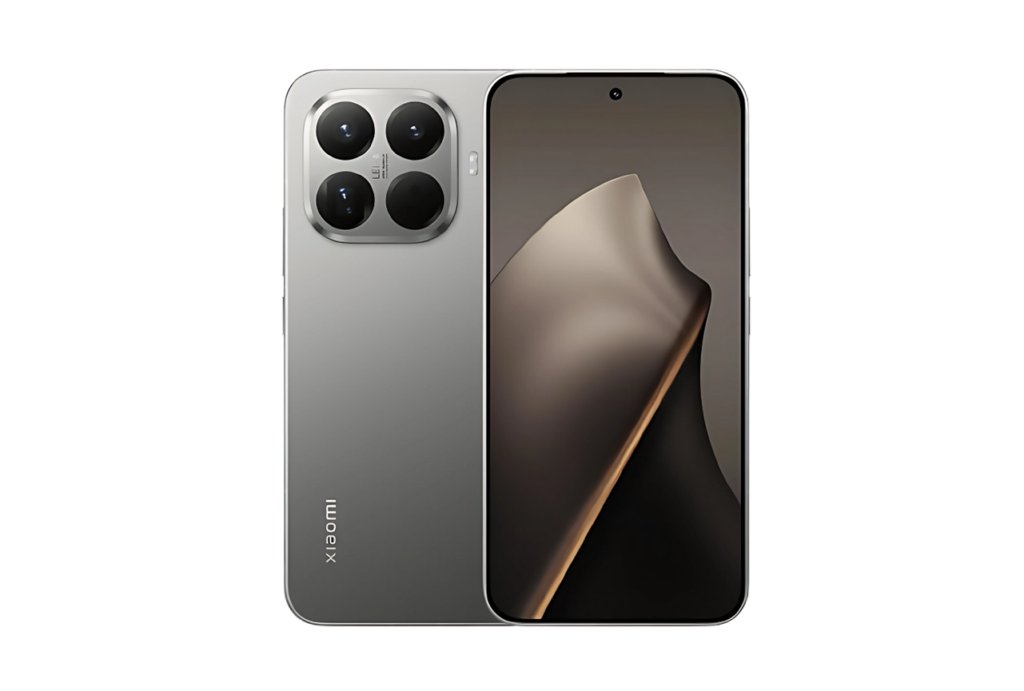
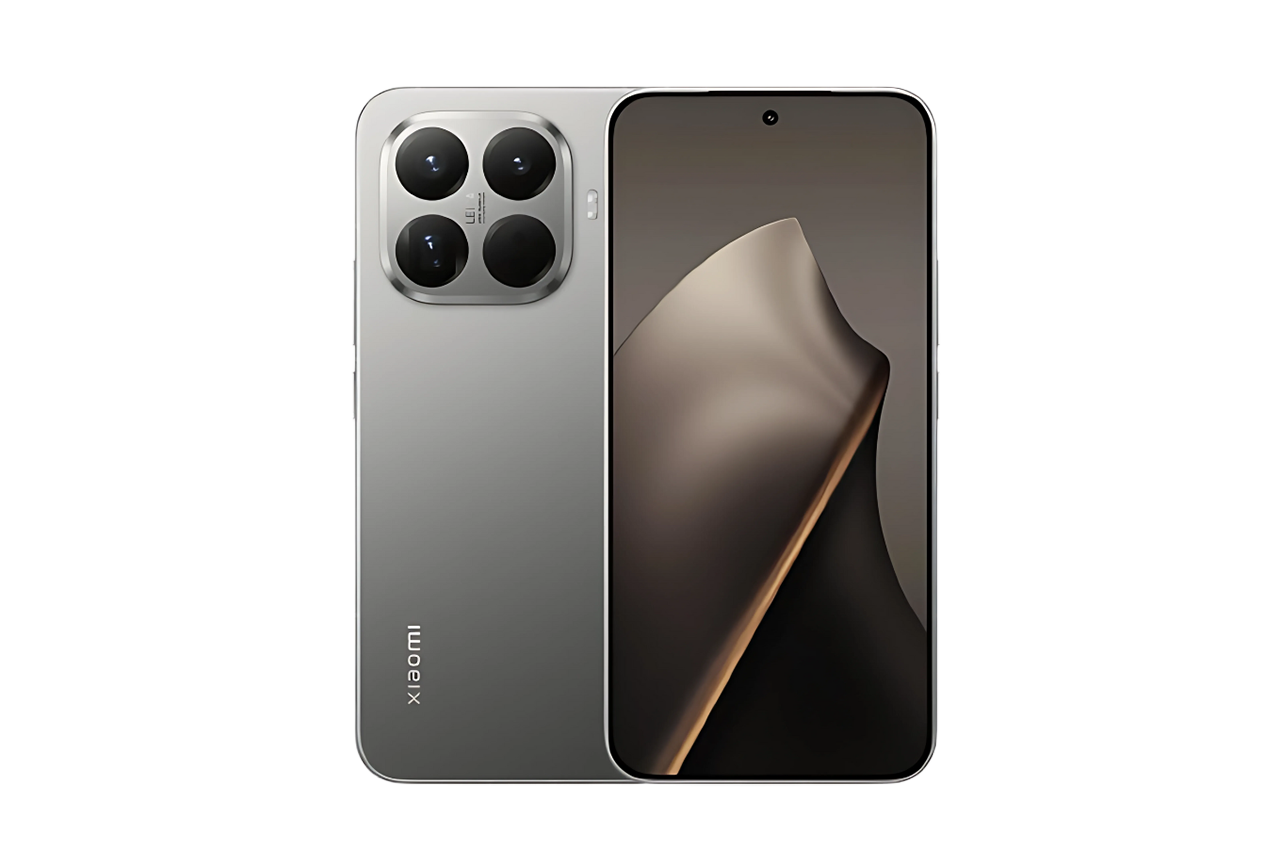
Key camera specifications:

  • Primary: 50 MP, f/1.62, 23mm (wide), 1/1.31″, 2.4µm, multi-directional PDAF, OIS
  • Ultra-wide: 12 MP, f/2.2, 15mm, 120˚ (ultrawide)
  • Tele: 50 MP, f/3.0, 115mm (telephoto), OIS, 5x optical zoom

Scoring

Sub-scores and attributes included in the calculations of the global score.


Xiaomi 15T Pro
149
camera
152
Photo
157

184

160

180

147

169

135

170

144
Video
152

186

139

151

112

140

Use cases & Conditions

Use case scores indicate the product performance in specific situations. They are not included in the overall score calculations.

BEST 169

Portrait

Portrait photos of either one person or a group of people

BEST 185

Outdoor

Photos & videos shot in bright light conditions (≥1000 lux)

BEST 180

Indoor

Photos & videos shot in good lighting conditions (≥100lux)

BEST 149

Lowlight

Photos & videos shot in low lighting conditions (<100 lux)

BEST 159

Zoom

Photos and videos captured using zoom (more than 1x)

Pros

  • Accurate and stable Autofocus
  • Generally accurate target exposure in outdoor and indoor conditions
  • Generally well preserved details in photo

Cons

  • Inaccurate skintones in some situations and visible white balance casts in lowlight conditions.
  • Lost details and visible noise especially in lower light conditions in video and tele
  • Contrast can be low in backlit conditions in photo

The Xiaomi 15T Pro arrives as a compelling contender in the premium segment, offering an ambitious camera system backed by Leica’s optics and computational photography features. While its overall DXOMARK Camera score trails that of the Xiaomi 15 Ultra by approximately 10 points, it still offers an interesting balance of strengths and compromises. Its triple camera configuration enables broad photographic versatility from wide to significant optical zoom, although it is not up to the Xiaomi 15 Ultra which benefits from a quad-camera setup larger sensors that help boost detail and dynamic range.

For users seeking a well-rounded shooter with zoom flexibility and confident performance across most situations, the Xiaomi 15T Pro is a very capable choice, with accurate targeting exposure and autofocus as significant assets. While strong in many everyday conditions, it stumbles in nuanced areas like color fidelity, lowlight noise control, and contrast in high dynamic range scenes.

Test summary

About DXOMARK Camera tests: DXOMARK’s camera evaluations take place in laboratories and real-world situations using a wide variety of use-cases. The scores rely on objective tests for which the results are calculated directly using measurement software in our laboratory setups, and on perceptual tests where a sophisticated set of metrics allow a panel of image experts to compare aspects of image quality that require human judgment. Testing a smartphone involves a team of engineers and technicians for about a week. Photo and Video quality are scored separately and then combined into an overall score for comparison among the cameras in different devices. For more information about the DXOMARK Camera protocol, click here. More details on smartphone camera scores are available here. The following section gathers key elements of DXOMARK’s exhaustive tests and analyses. Full performance evaluations are available upon request. Please contact us  on how to receive a full report.

Xiaomi 15T Pro Camera Scores
This graph compares DXOMARK photo and video scores between the tested device and references. Average and maximum scores of the price segment are also indicated. Average and maximum scores for each price segment are computed based on the DXOMARK database of devices tested.

Photo

152

Xiaomi 15T Pro

180

Huawei Pura 80 Ultra
About DXOMARK Camera Photo tests

For scoring and analysis, DXOMARK engineers capture and evaluate more than 3,800 test images in controlled lab environments as well as outdoor, indoor and low-light natural scenes, using the camera’s default settings. The photo protocol is designed to take into account the main use cases and is based on typical shooting scenarios, such as portraits, landscape and zoom photography. The evaluation is performed by visually inspecting images against a reference of natural scenes, and by running objective measurements on images of charts captured in the lab under different lighting conditions from 0.1 to 10,000+ lux and color temperatures from 2,300K to 6,500K.

In photo default mode, the Xiaomi 15T Pro is a rather trustable device. In favorable conditions, like outdoor and indoor conditions, it delivers high quality images with accurate target exposure and decent texture noise compromise. It comes with its drawbacks, especially in backlit conditions where contrast can be low on faces and deep skintone rendering can be unnatural. Going into lowlight conditions, orange white balance casts are visible. Autofocus is accurate and repeatable, although depth of field can be limited for group pictures with the second person being out of focus. Few artifacts are visible, mostly ghosting and fusion artifacts can be visible when there is movement.

Main

157

Xiaomi 15T Pro

184

Huawei Pura 80 Ultra
Xiaomi 15T Pro Photo scores
The photo Main tests analyze image quality attributes such as exposure, color, texture, and noise in various light conditions. Autofocus performances and the presence of artifacts on all images captured in controlled lab conditions and in real-life images are also evaluated. All these attributes have a significant impact on the final quality of the images captured with the tested device and can help to understand the camera's main strengths and weaknesses at 1x.
Exposure
113

Xiaomi 15T Pro

134

Huawei Pura 80 Ultra
Color
114

Xiaomi 15T Pro

133

Huawei Pura 80 Ultra

Exposure and color are the key attributes for technically good pictures. For exposure, the main attribute evaluated is the brightness level of the main subject through various use cases such as landscape, portrait, or still life. Other factors evaluated are the global contrast and the ability to render the dynamic range of the scene (ability to render visible details in both bright and dark areas). When the camera provides Photo HDR format, the images are analyzed with a visualization on an HDR reference monitor, under reference conditions specified in the ISO-22028-5 standard. Repeatability is also important because it demonstrates the camera's ability to provide the same rendering when shooting several images of the same scene.
For color, the image quality attributes analyzed are skin-tone rendering, white balance, color shading, and repeatability. For color and skin tone rendering, we penalize unnatural colors according to results gathered in various studies and consumer insights while respecting the manufacturer's choice of color signature.

Xiaomi 15T Pro – Accurate target exposure, slightly inaccurate skintone rendering
Xiaomi 15 Ultra – Accurate target exposure and pleasant skintone rendering
Samsung Galaxy S25 Ultra – Accurate target exposure, slightly low contrast and slightly inaccurate skintone rendering
Sharpness & Timing
122

Xiaomi 15T Pro

135

Huawei Pura 80 Ultra

Autofocus tests concentrate on focus accuracy, focus repeatability, shooting time delay, and depth of field. Shooting delay is the difference between the time the user presses the capture button and the time the image is actually taken. It includes focusing speed and the capability of the device to capture images at the right time, what is called 'zero shutter lag' capability. Even if a shallow depth of field can be pleasant for a single subject portrait or close-up shot, it can also be a problem in some specific conditions such as group portraits; Both situations are tested. Focus accuracy is also evaluated in all the real-life images taken, from infinity to close-up objects and in low light to outdoor conditions.

Edge acutance irregularity and average shooting delay along all tested conditions
This graph illustrates focus irregularity and speed as well as zero shutter lag capability, for different light conditions. Each point is the result of the aggregation of the measurements for a group of 30 pictures per conditions. The y-axis shows the average acutance difference with the best focus in percentage. The lower the better. On the x-axis, a negative delay means the photo is taken just before the user triggers the shutter, a positive delay means the photo is taken just after. The closer to 0 ms, the better. Acutance and delay are measured respectively using the Dead leaves chart and the LED Universal Timer, on the AF HDR Setup.
Autofocus irregularity and speed: 1000Lux Δ0EV Daylight Handheld
This graph illustrates focus accuracy and speed as well as zero shutter lag capability by showing the edge acutance versus the shooting time measured on the AFHDR setup on a series of pictures. All pictures were taken in one light condition and indicated illuminant, 500ms after the defocus. The edge acutance is measured on the four edges of the Dead Leaves chart, and the shooting time is measured on the LED Universal Timer.
Texture
123

Xiaomi 15T Pro

132

Vivo X200 Ultra

Texture tests analyze the level of details and the texture of subjects in the images taken in the lab as well as in real-life scenarios. For natural shots, particular attention is paid to the level of details in the bright and dark areas of the image. Objective measurements are performed on chart images taken in various lighting conditions from 0.1 to 10,000+ lux and different kinds of dynamic range conditions. The charts used are the proprietary DXOMARK chart (DMC), and the Dead Leaves chart. We also have an AI based metric for the level of details on our realistic mannequins Eugene and Diana.

DXOMARK CHART (DMC) detail preservation score vs lux levels for handheld conditions
This graph shows the evolution of the DMC detail preservation score with the level of lux, for two holding conditions. DMC detail preservation score is derived from an AI-based metric trained to evaluate texture and details rendering on a selection of crops of our DXOMARK chart.
Noise
121

Xiaomi 15T Pro

129

Oppo Find X8 Ultra

Noise tests analyze various attributes of noise such as intensity, chromaticity, grain, structure on real-life images as well as images of charts taken in the lab. For natural images, particular attention is paid to the noise on faces, landscapes, but also on dark areas and high dynamic range conditions. Noise on moving objects is also evaluated on natural images. Objective measurements are performed on images of charts taken in various conditions from 0.1 to 10000 lux and different kinds of dynamic range conditions. The chart used is the Dead Leaves chart and the standardized measurement such as Visual Noise derived from ISO 15739.

Visual noise evolution with illuminance levels in handheld condition
This graph shows the evolution of visual noise metric with the level of lux in handheld condition. The visual noise metric is the mean of visual noise measurement on all patches of the Dead Leaves chart in the AFHDR setup. DXOMARK visual noise measurement is derived from ISO15739 standard.
Artifacts
73

Xiaomi 15T Pro

81

Google Pixel 10 Pro XL

The artifacts evaluation looks at flare, lens shading, chromatic aberrations, geometrical distortion, edges ringing, halos, ghosting, quantization, unexpected color hue shifts, among others type of possible unnatural effects on photos. The more severe and the more frequent the artifact, the higher the point deduction on the score. The main artifacts observed and corresponding point loss are listed below.
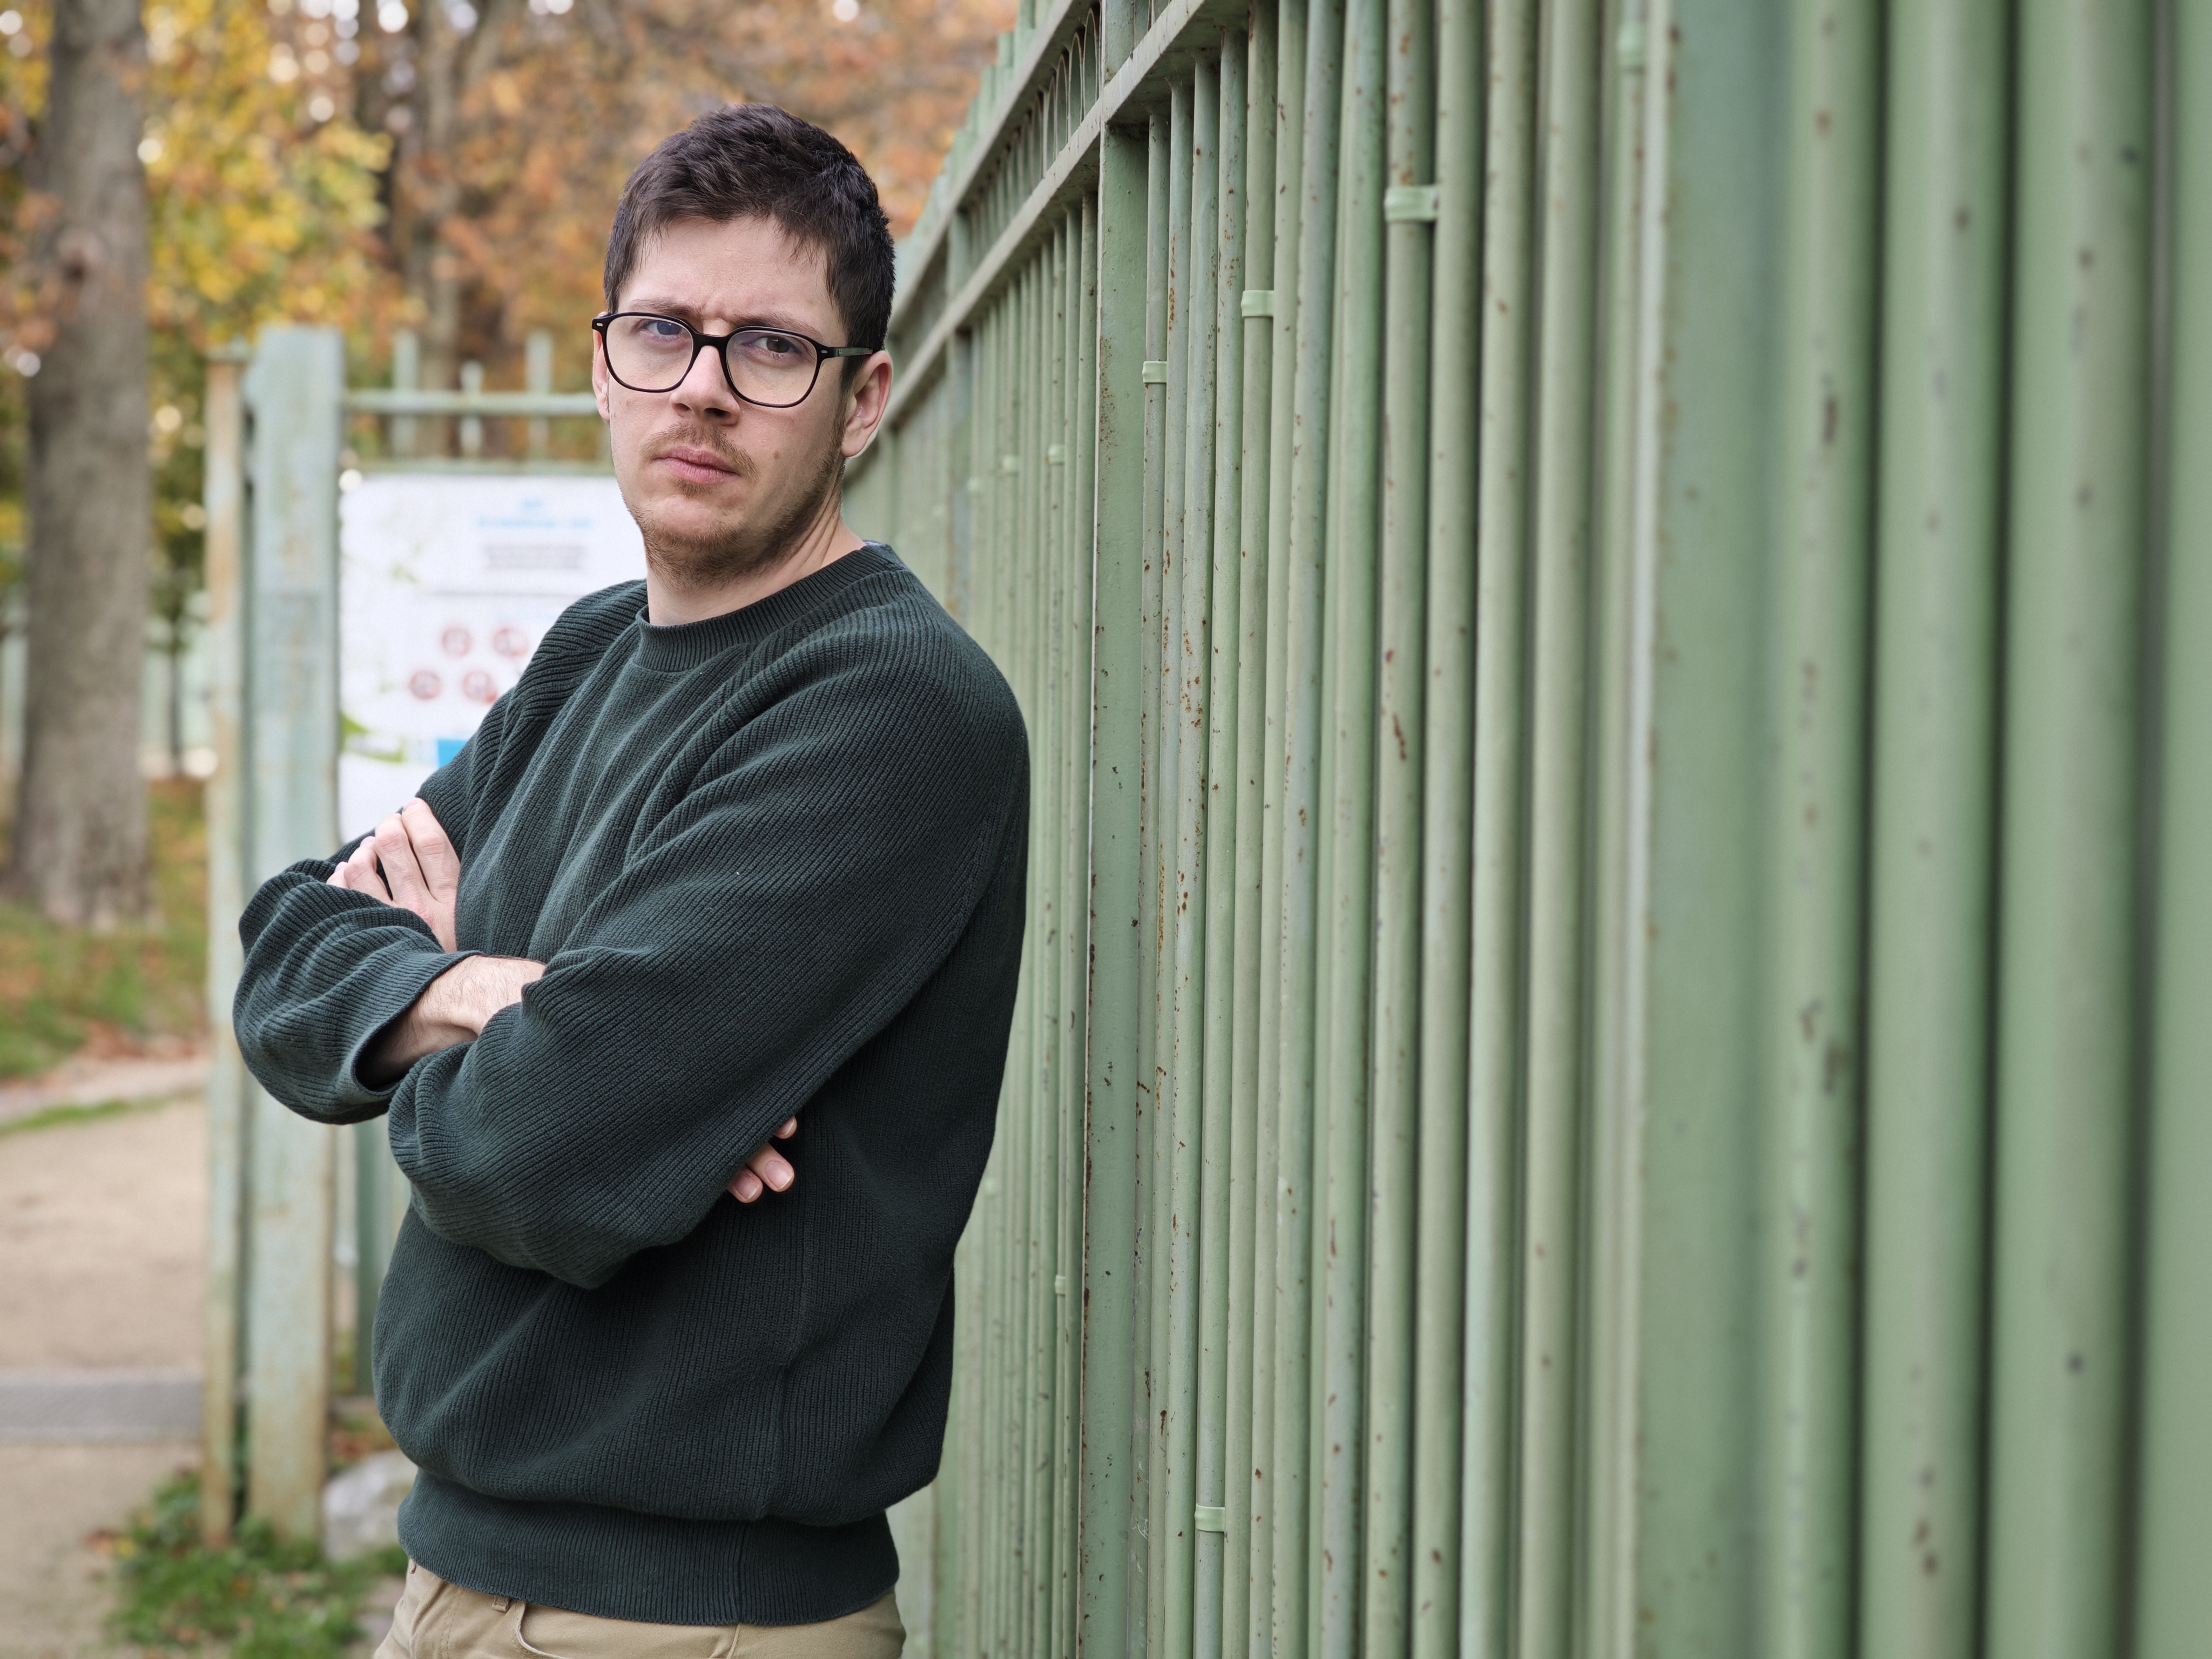
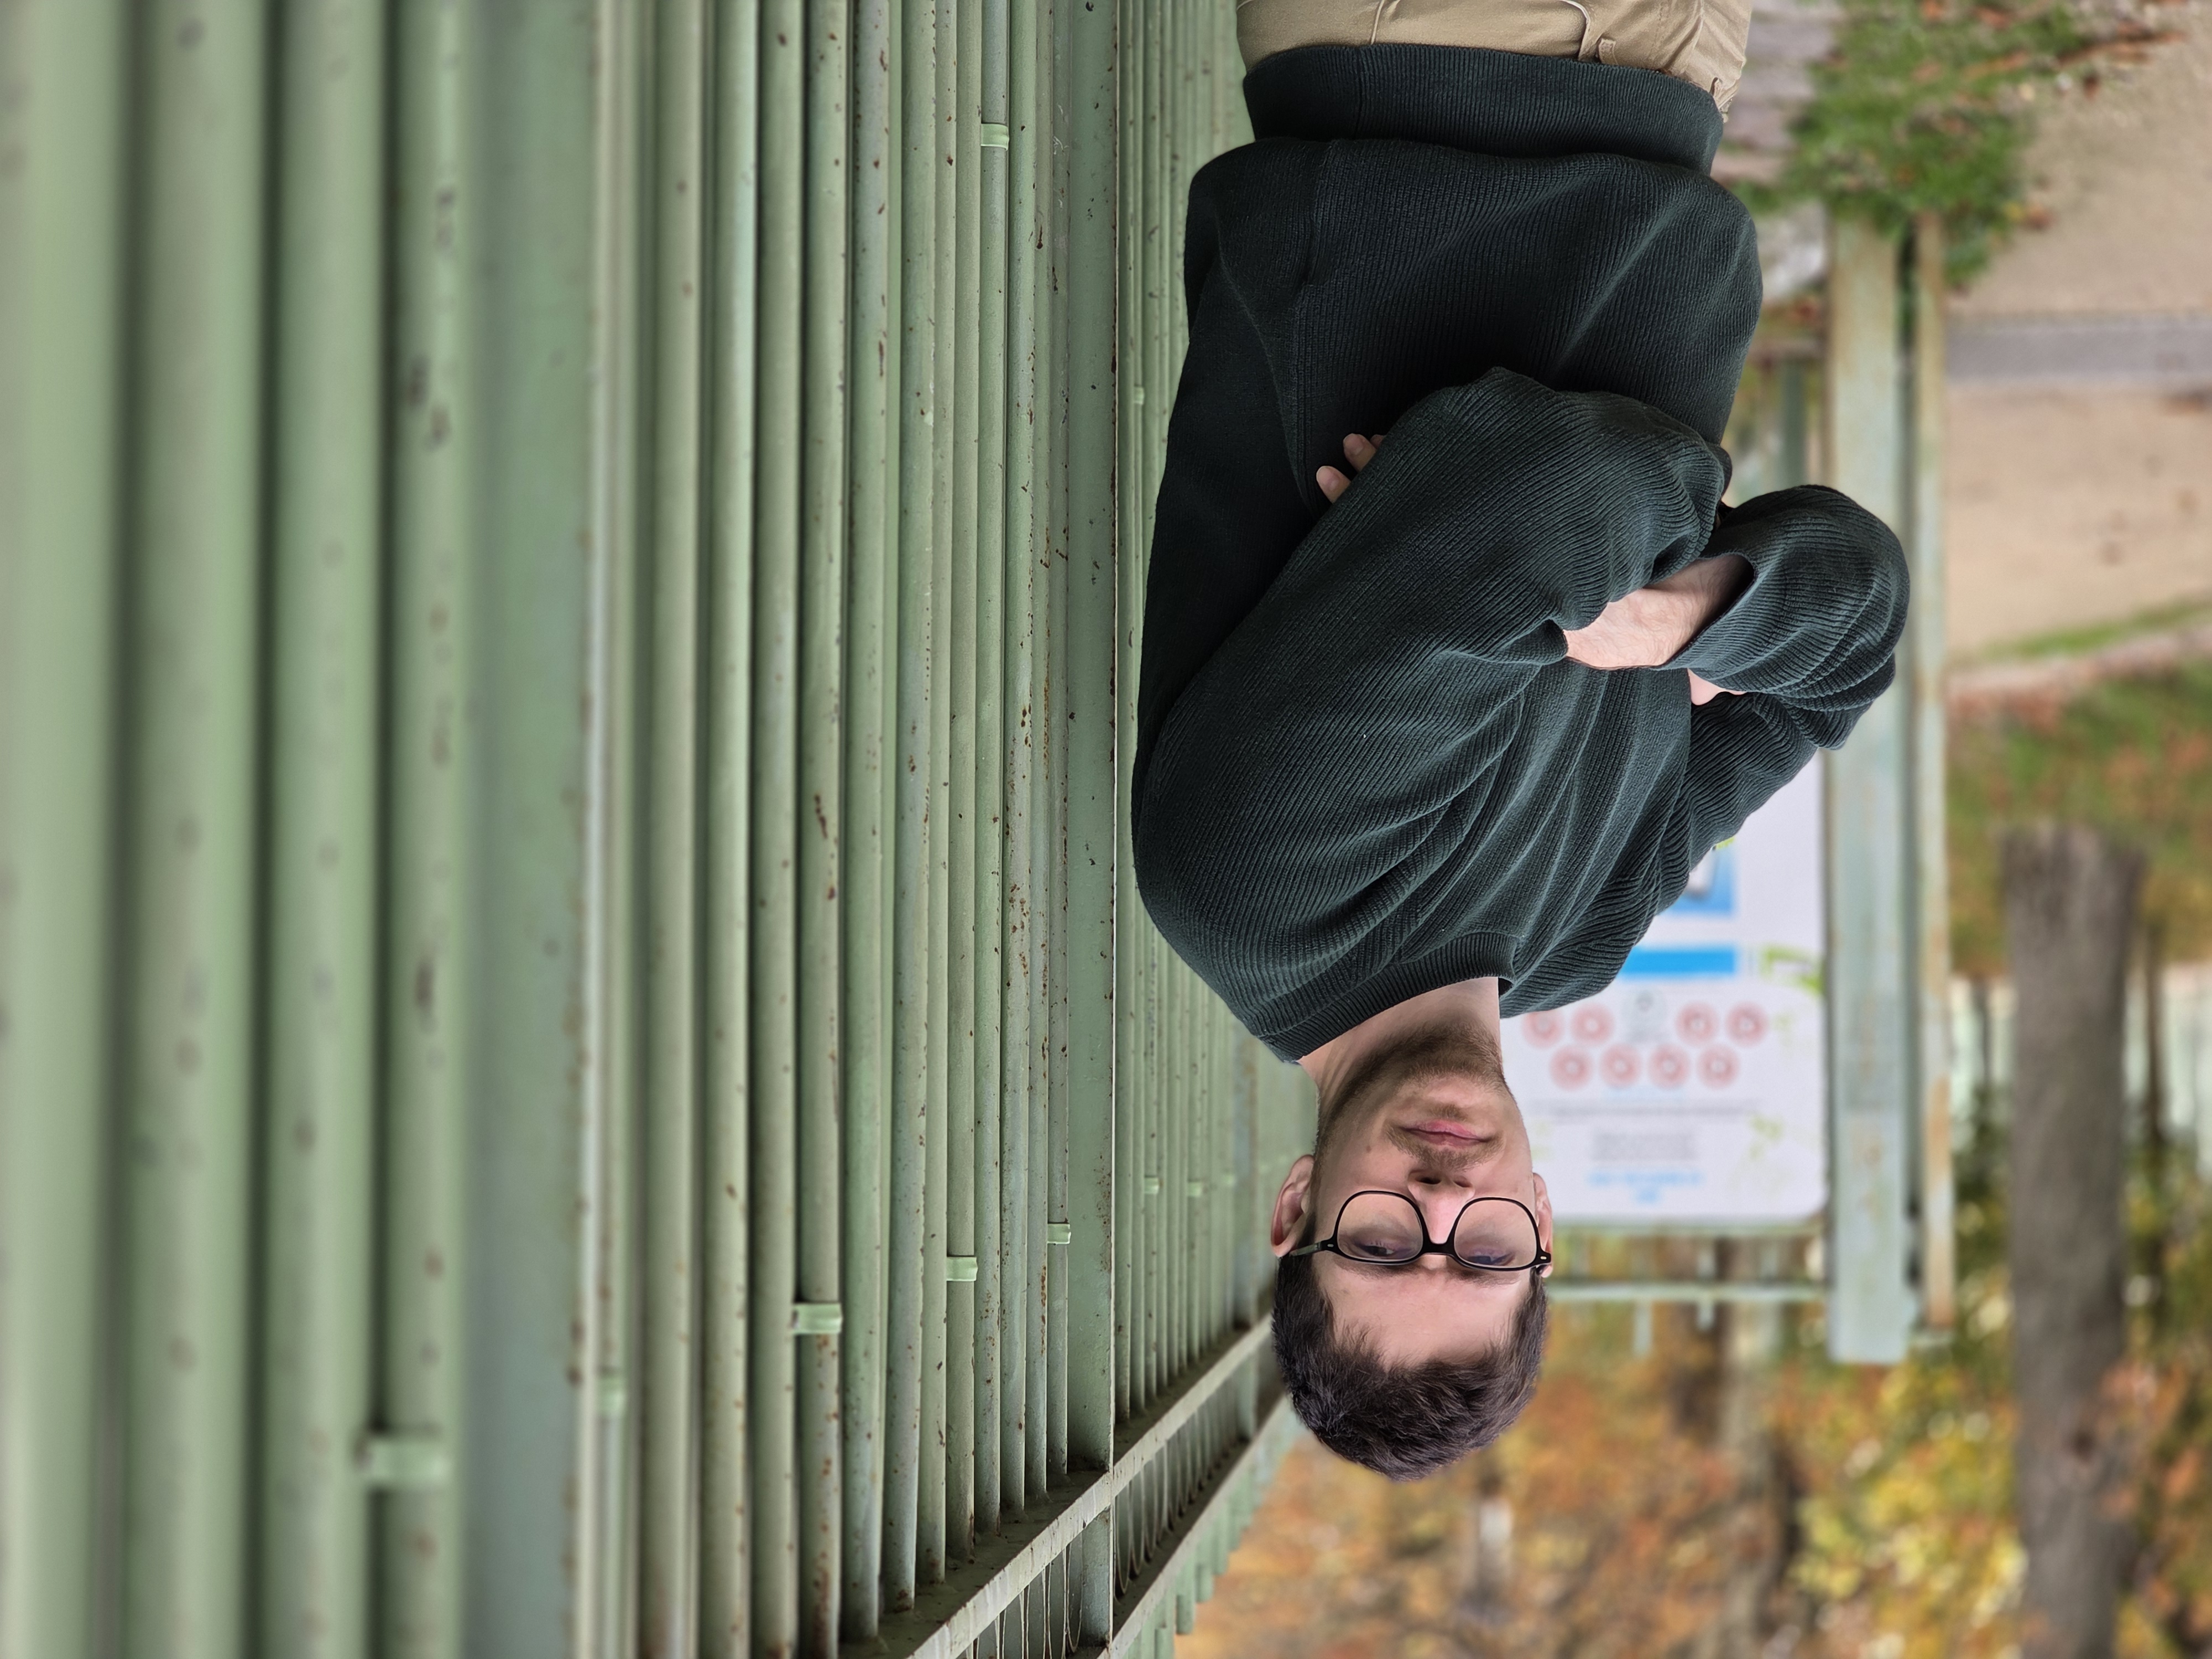
Main photo artifacts penalties

Bokeh

160

Xiaomi 15T Pro

180

Vivo X300 Pro

Bokeh is tested in one dedicated mode, usually portrait or aperture mode, and analyzed by visually inspecting all the images captured in the lab and in natural conditions. The goal is to reproduce portrait photography comparable to one taken with a DLSR and a wide aperture. The main image quality attributes paid attention to are depth estimation, artifacts, blur gradient, and the shape of the bokeh blur spotlights. Portrait image quality attributes (exposure, color, texture) are also taken into account.

In bokeh mode, blur simulation and depth estimation is descent, but behind what flagships can do. Using a equivalent focal length of 46mm via a numerical zoom, level of details is low on faces compared for example to the Xiaomi 15 Ultra which uses its short tele module for Bokeh mode.

Xiaomi 15T Pro
Xiaomi 15 Ultra
Samsung Galaxy S25 Ultra

Tele

135

Xiaomi 15T Pro

170

Vivo X300 Pro

All image quality attributes are evaluated at focal lengths from approximately 40 mm to 300 mm, with particular attention paid to texture and detail. The score is derived from a number of objective measurements in the lab and perceptual analysis of real-life images.

Xiaomi 15T Pro Telephoto Scores
This graph illustrates the relative scores for the different zoom ranges evaluated. The abscissa is expressed in 35mm equivalent focal length.
DXOMARK CHART (DMC) detail preservation score per focal length
This graph shows the evolution of the DMC detail preservation score with respect to the full-frame equivalent focal length for different light conditions. The x-axis represents the equivalent focal length measured for each corresponding shooting distance and the y-axis represents the maximum details preservation metric score: higher value means better quality. Large dots correspond to zoom ratio available in the user interface of the camera application.

UltraWide

147

Xiaomi 15T Pro

169

Vivo X200 Ultra

These tests analyze the performance of the ultra-wide camera at several focal lengths from 12 mm to 20 mm. All image quality attributes are evaluated, with particular attention paid to such artifacts as chromatic aberrations, lens softness, and distortion. Pictures below are an extract of tested scenes.

Xiaomi 15T Pro Ultra-Wide Scores
This graph illustrates the relative scores for the different zoom ranges evaluated. The abscissa is expressed in 35mm equivalent focal length.
DXOMARK CHART (DMC) detail preservation score per focal length
This graph shows the evolution of the DMC detail preservation score with respect to the full-frame equivalent focal length for different light conditions. The x-axis represents the equivalent focal length measured for each corresponding shooting distance and the y-axis represents the maximum details preservation metric score: higher value means better quality. Large dots correspond to zoom ratio available in the user interface of the camera application.
DXOMARK CHART (DMC) detail preservation score per focal length
This graph shows the evolution of the DMC detail preservation score with respect to the full-frame equivalent focal length for different light conditions. The x-axis represents the equivalent focal length measured for each corresponding shooting distance and the y-axis represents the maximum details preservation metric score: higher value means better quality. Large dots correspond to zoom ratio available in the user interface of the camera application.
DXOMARK CHART (DMC) detail preservation score per focal length
This graph shows the evolution of the DMC detail preservation score with respect to the full-frame equivalent focal length for different light conditions. The x-axis represents the equivalent focal length measured for each corresponding shooting distance and the y-axis represents the maximum details preservation metric score: higher value means better quality. Large dots correspond to zoom ratio available in the user interface of the camera application.
DXOMARK CHART (DMC) detail preservation score per focal length
This graph shows the evolution of the DMC detail preservation score with respect to the full-frame equivalent focal length for different light conditions. The x-axis represents the equivalent focal length measured for each corresponding shooting distance and the y-axis represents the maximum details preservation metric score: higher value means better quality. Large dots correspond to zoom ratio available in the user interface of the camera application.

Video

144

Xiaomi 15T Pro

172

Apple iPhone 17 Pro
About DXOMARK Camera Video tests

DXOMARK engineers capture and evaluate almost 3 hours of video in controlled lab environments and in natural low-light, indoor and outdoor scenes, using the camera’s default settings. The evaluation consists of visually inspecting natural videos taken in various conditions and running objective measurements on videos of charts recorded in the lab under different conditions from 0.1 to 10000+ lux and color temperatures from 2,300K to 6,500K.

The Xiaomi 15T Pro video mode offers a range of resolution and frame rate settings, up to 8K/30fps and 4K/120fps. Dolby Vision 10-bit HDR recording is available at 4K/60fps and at 1080p resolution settings. The DXOMARK video tests were performed at 4K/30fps with Dolby Vision HDR, which provided the overall best results with image stabilization.

With these settings, the Xiaomi 15T Pro is actually a decent choice for its segment, offering a good overall video quality, which earns it a similar score to the Xiaomi 15 Ultra. The 15T Pro gains on the 15 Ultra with a more accurate autofocus in challenging situations (backlit and lowlight) and slightly less noise and noise artifacts for a similar level of texture. The 15T Pro offers a slightly lower target exposure while still being accurate, gaining in bright preservation compared to the 15 Ultra. However the 15T Pro lacks in stability and smoothness while adapting to changing conditions. Colors are a bit off, particularly with redish skintones in outdoor conditions and visible orange white balance casts in lowlight conditions.

Main

152

Xiaomi 15T Pro

186

Apple iPhone 17 Pro
Xiaomi 15T Pro Video scores
Video Main tests analyze the same image quality attributes as for still images, such as exposure, color, texture, or noise, in addition to temporal aspects such as speed, and smoothness and stability of exposure, white balance, and autofocus transitions.
Exposure
95

Xiaomi 15T Pro

133

Vivo X300 Pro
Color
100

Xiaomi 15T Pro

131

Apple iPhone 17 Pro

Exposure tests evaluate the brightness level of the main subject, the global contrast and the ability to render the dynamic range of the scene (ability to render visible details in both bright and dark areas). When the camera provides Video HDR format, the videos are analyzed with visualization on an HDR reference monitor, under reference conditions specified in the metadata. Stability and temporal adaption of the exposure are also analyzed.
Image-quality color analysis looks at color rendering, skin-tone rendering, white balance, color shading, stability of the white balance and its adaption when light is changing.

Xiaomi 15T Pro – Accurate target exposure, abrupt adaptation and inaccurate colors

Xiaomi 15 Ultra – Accurate target exposure and smooth adaptation, pleasant color rendering

Samsung Galaxy S25 Ultra – Accurate target exposure and smooth adaptation, pleasant color rendering
Texture
112

Xiaomi 15T Pro

118

Huawei Pura 80 Ultra

Texture tests analyze the level of details and texture of the real-life videos as well as the videos of charts recorded in the lab. Natural videos recordings are visually evaluated, with particular attention paid to the level of details in the bright and areas as well as in the dark. Objective measurements are performed of images of charts taken in various conditions from 0.1 to 10000 lux. The charts used are the DXOMARK chart (DMC) and Dead Leaves chart.

DXOMARK CHART (DMC) detail preservation video score vs lux levels
This graph shows the evolution of the DMC detail preservation video score with the level of lux in video. DMC detail preservation score is derived from an AI-based metric trained to evaluate texture and details rendering on a selection of crops of our DXOMARK chart.
Noise
112

Xiaomi 15T Pro

129

Apple iPhone 17 Pro

Noise tests analyze various attributes of noise such as intensity, chromaticity, grain, structure, temporal aspects on real-life video recording as well as videos of charts taken in the lab. Natural videos are visually evaluated, with particular attention paid to the noise in the dark areas and high dynamic range conditions. Objective measurements are performed on the videos of charts recorded in various conditions from 0.1 to 10000 lux. The chart used is the DXOMARK visual noise chart.

Spatial visual noise evolution with the illuminance level
This graph shows the evolution of spatial visual noise with the level of lux. Spatial visual noise is measured on the visual noise chart in the video noise setup. DXOMARK visual noise measurement is derived from ISO15739 standard.
Temporal visual noise evolution with the illuminance level
This graph shows the evolution of temporal visual noise with the level of lux. Temporal visual noise is measured on the visual noise chart in the video noise setup.
Stabilization
107

Xiaomi 15T Pro

124

Apple iPhone 17 Pro

Stabilization evaluation tests the ability of the device to stabilize footage thanks to software or hardware technologies such as OIS, EIS, or any others means. The evaluation looks at residual motion, smoothness, jello artifacts and residual motion blur on walk and run use cases in various lighting conditions. The video below is an extract from one of the tested scenes.

Xiaomi 15T Pro – Residual motion and sharpness difference between frames visible

Xiaomi 15 Ultra – Residual motion and sharpness difference between frames visible

Samsung Galaxy S25 Ultra – Residual motion and sharpness difference between frames visible
Artifacts
83

Xiaomi 15T Pro

89

Apple iPhone 17 Pro

Artifacts are evaluated with MTF and ringing measurements on the SFR chart in the lab as well as frame-rate measurements using the LED Universal Timer. Natural videos are visually evaluated by paying particular attention to artifacts such as aliasing, quantization, blocking, and hue shift, among others. The more severe and the more frequent the artifact, the higher the point deduction from the score. The main artifacts and corresponding point loss are listed below.

Main video artifacts penalties

UltraWide

139

Xiaomi 15T Pro

151

Motorola Signature
DXOMARK CHART (DMC) detail preservation score per focal length
This graph shows the evolution of the DMC detail preservation score with respect to the full-frame equivalent focal length for different light conditions. The x-axis represents the equivalent focal length measured for each corresponding shooting distance and the y-axis represents the maximum details preservation metric score: higher value means better quality. Large dots correspond to zoom ratio available in the user interface of the camera application.

Tele

112

Xiaomi 15T Pro

140

Vivo X200 Ultra
DXOMARK CHART (DMC) detail preservation score per focal length
This graph shows the evolution of the DMC detail preservation score with respect to the full-frame equivalent focal length for different light conditions. The x-axis represents the equivalent focal length measured for each corresponding shooting distance and the y-axis represents the maximum details preservation metric score: higher value means better quality. Large dots correspond to zoom ratio available in the user interface of the camera application.

All image quality attributes are evaluated at focal lengths from approximately 12 mm to 300 mm, with particular attention paid to texture and smoothness of the zooming effect. The score is derived from a number of objective measurements in the lab and perceptual analysis of real-life video recordings.

Xiaomi 15T Pro – low quality at long range with residual motions visible

Xiaomi 15 Ultra – good detail preservation at long range; abrupt transitions between camera modules

Samsung Galaxy S25 Ultra – good detail preservation at long range; slightly abrupt transitions between camera modules

Leave a Reply