We put the Acer Swift 14 (2023) through our rigorous DXOMARK Laptop test suite to measure its performance both at sound, camera and display.
In this review, we will break down how it fared in a variety of tests and several common use cases.
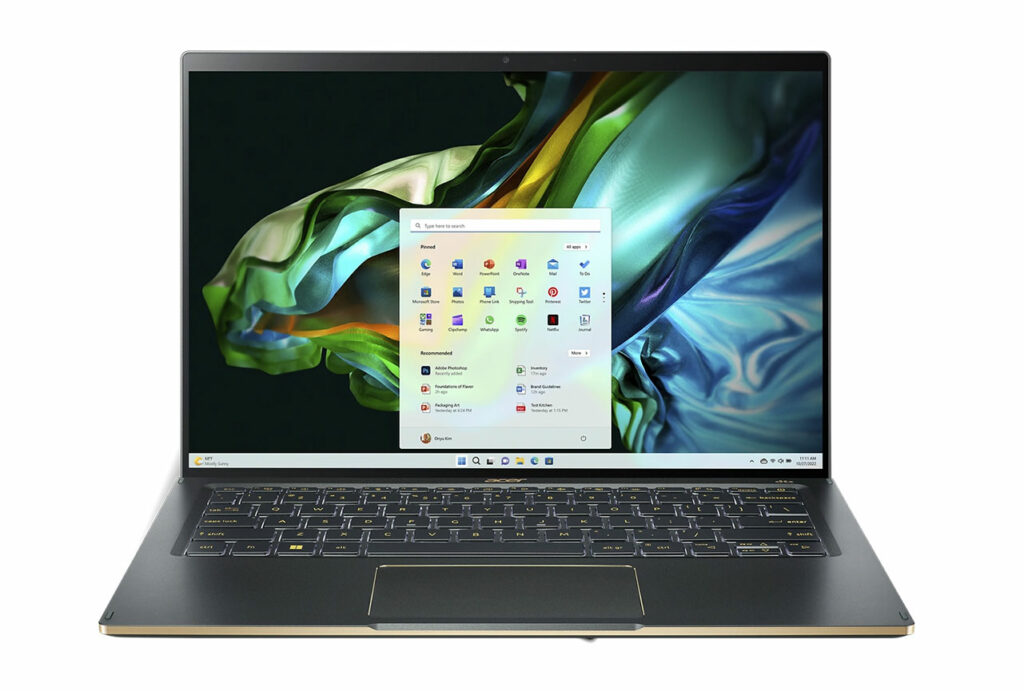
Overview
Key specifications include (as given by the manufacturer):
- Physical specs : 310.5 x 213.3 x /14.95 mm
- Display : 2560×1600 IPS, 425 nits, 100% sRGB, Touch
- Webcam : 1440p QHD
Scoring
Use-case and feature subscores included in the calculations of the global score

Acer Swift 14 (2023)
84
95
84

Pros
- In video call, good handling of colors (particularly skin tones and target exposure)
- In video call, excellent SNR performance with high level of noise reduction
- Great directivity, focused on voices in front of the laptop’s screen
- Great handling when voices overlap
Cons
- In video call, camera has difficulty adjusting exposure to a moving subject
- Voice intelligibility impaired in some languages in playback because of excessive treble, lack of bass and unrealistic distance rendition
- Subpar video experience in SDR due to limited color gamut and lack of contrast
- No HDR panel
- High reflectance, making the laptop difficult to view in backlit situations
- Strong and inconsistent compression, pumping and distortion while listening to music or watching videos
- Lack of bass and overall harsh timbre performance
The Acer Swift 14 (2023) put in a great performance for both camera and audio in our video call use cases, but its performance for both display and audio in our multimedia tests was very limited.
Test summary
About DXOMARK Laptop tests: For scoring and analysis in our laptop reviews, DXOMARK engineers perform a variety of objective tests and undertake more than 20 hours of perceptual evaluations under controlled lab conditions and real-life scenarios.
(For more details about the Laptop protocol, click here.)
The following section gathers key elements of our exhaustive tests and analyses performed in DXOMARK laboratories. Detailed performance evaluations under the form of reports are available upon request. Do not hesitate to contact us.
Video Call
Acer Swift 14 (2023)
144
DXOMARK's Video call use case is a score that evaluates how a device handles video calls and videoconferencing in multiple conditions. This score focuses on the camera performance and the capture and playback rendering of voices. Read more about how we test the use cases of Video call score here.
The camera on the Acer device handled colors well (especially skin tones) and had good target exposure. Exposure showed instabilities when there was movement on-screen, however, and noise was visible in low light. The Acer’s audio system performed very well, with good noise reduction, great directivity, and great handling of duplex scenarios. While vocal timbre was good on capture, voice playback had too much treble and a slight lack of bass, plus unrealistic distance rendition that could impair intelligibility in some instances.
Camera
Acer Swift 14 (2023)
135
The following chart presents the camera subscores for the video call use case:
The following graphs show the objective measurements performed in our camera labs:
Audio
Acer Swift 14 (2023)
144
The following chart presents the capture subscores for the video call use case:
The following graphs show the frequency response, distortion and directivity in capture, recorded in our semi-anechoic room:
Music & Video
Acer Swift 14 (2023)
154
DXOMARK's Video and Music use case score evaluates the capability of a device to reproduce multimedia usages such as videos, movies and music playback in indoor conditions. This score focuses on the display performance and audio-playback rendering. Read more about how we test this use case here.
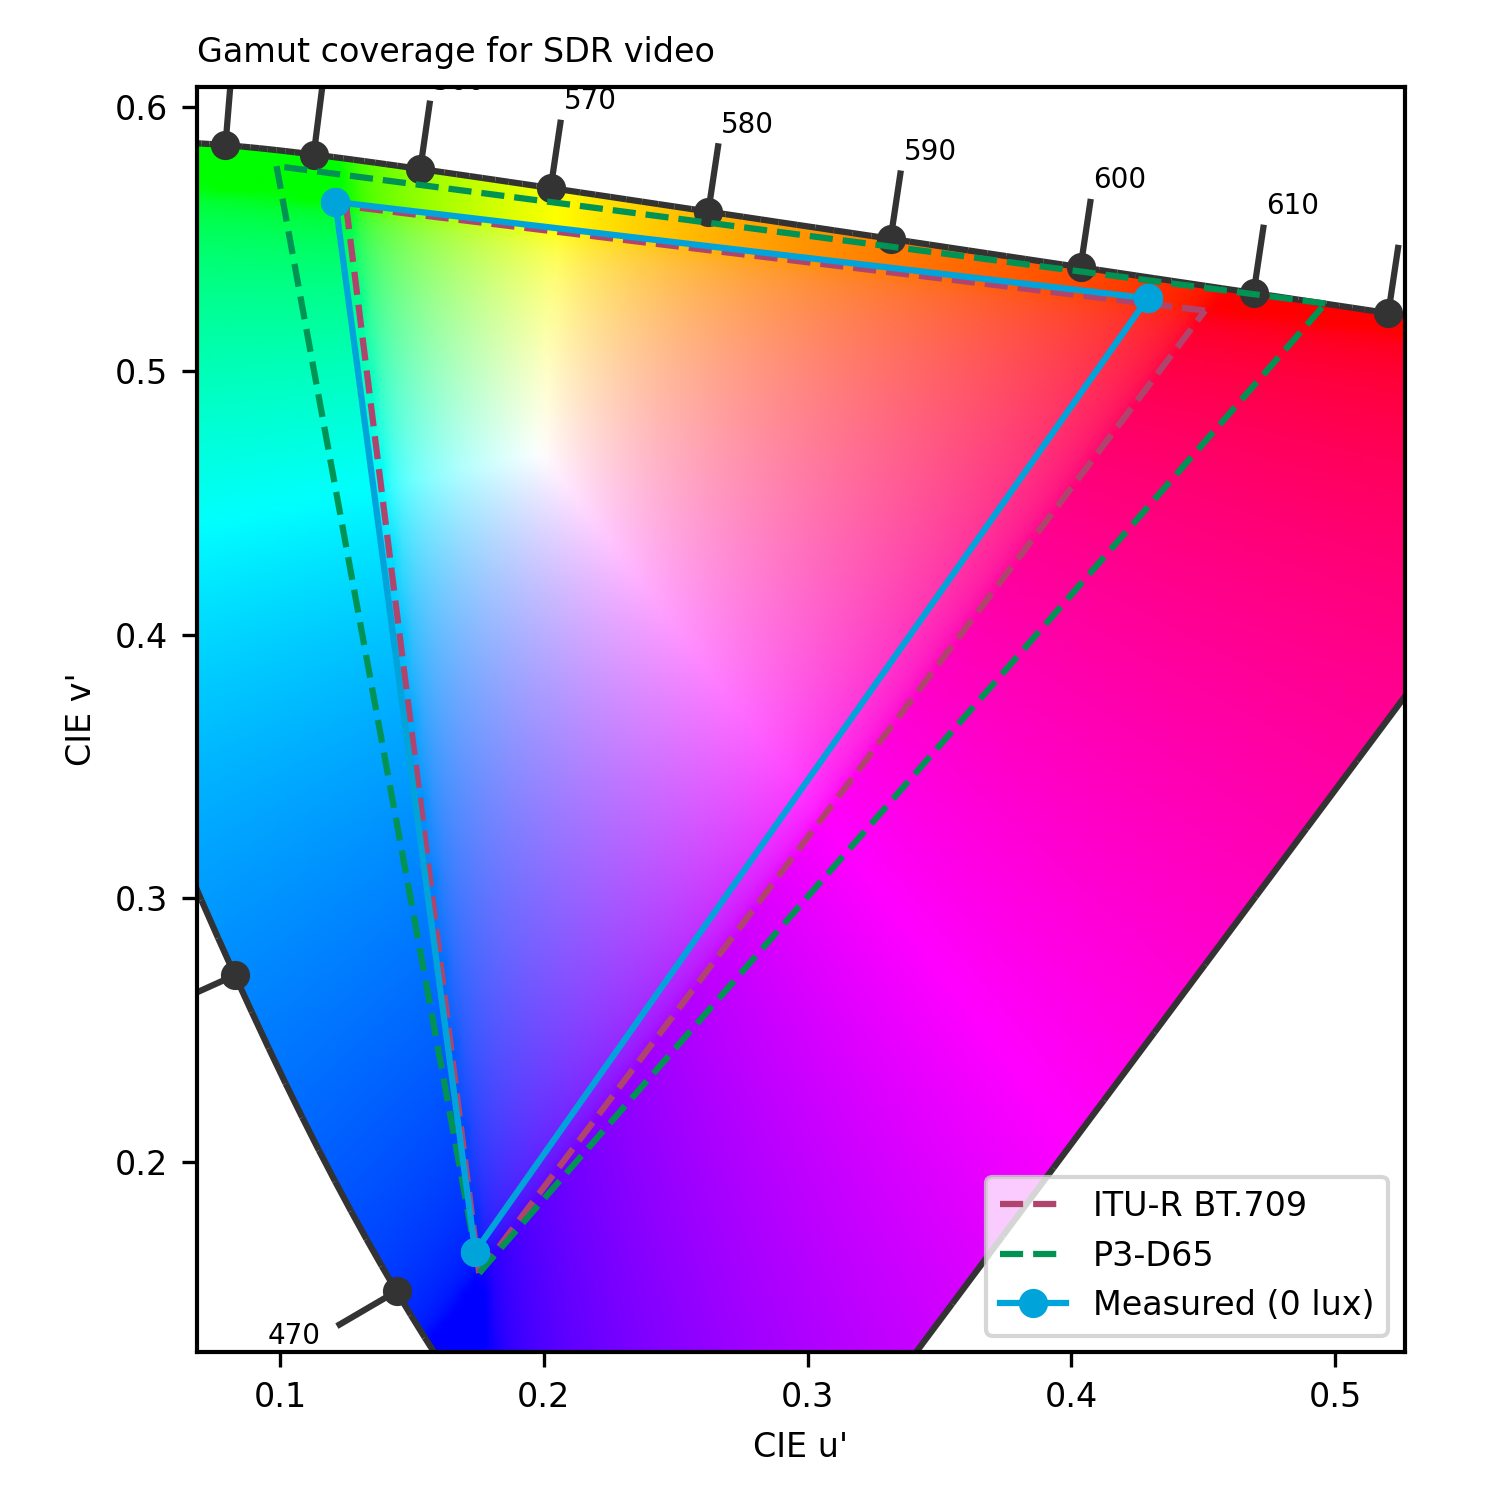
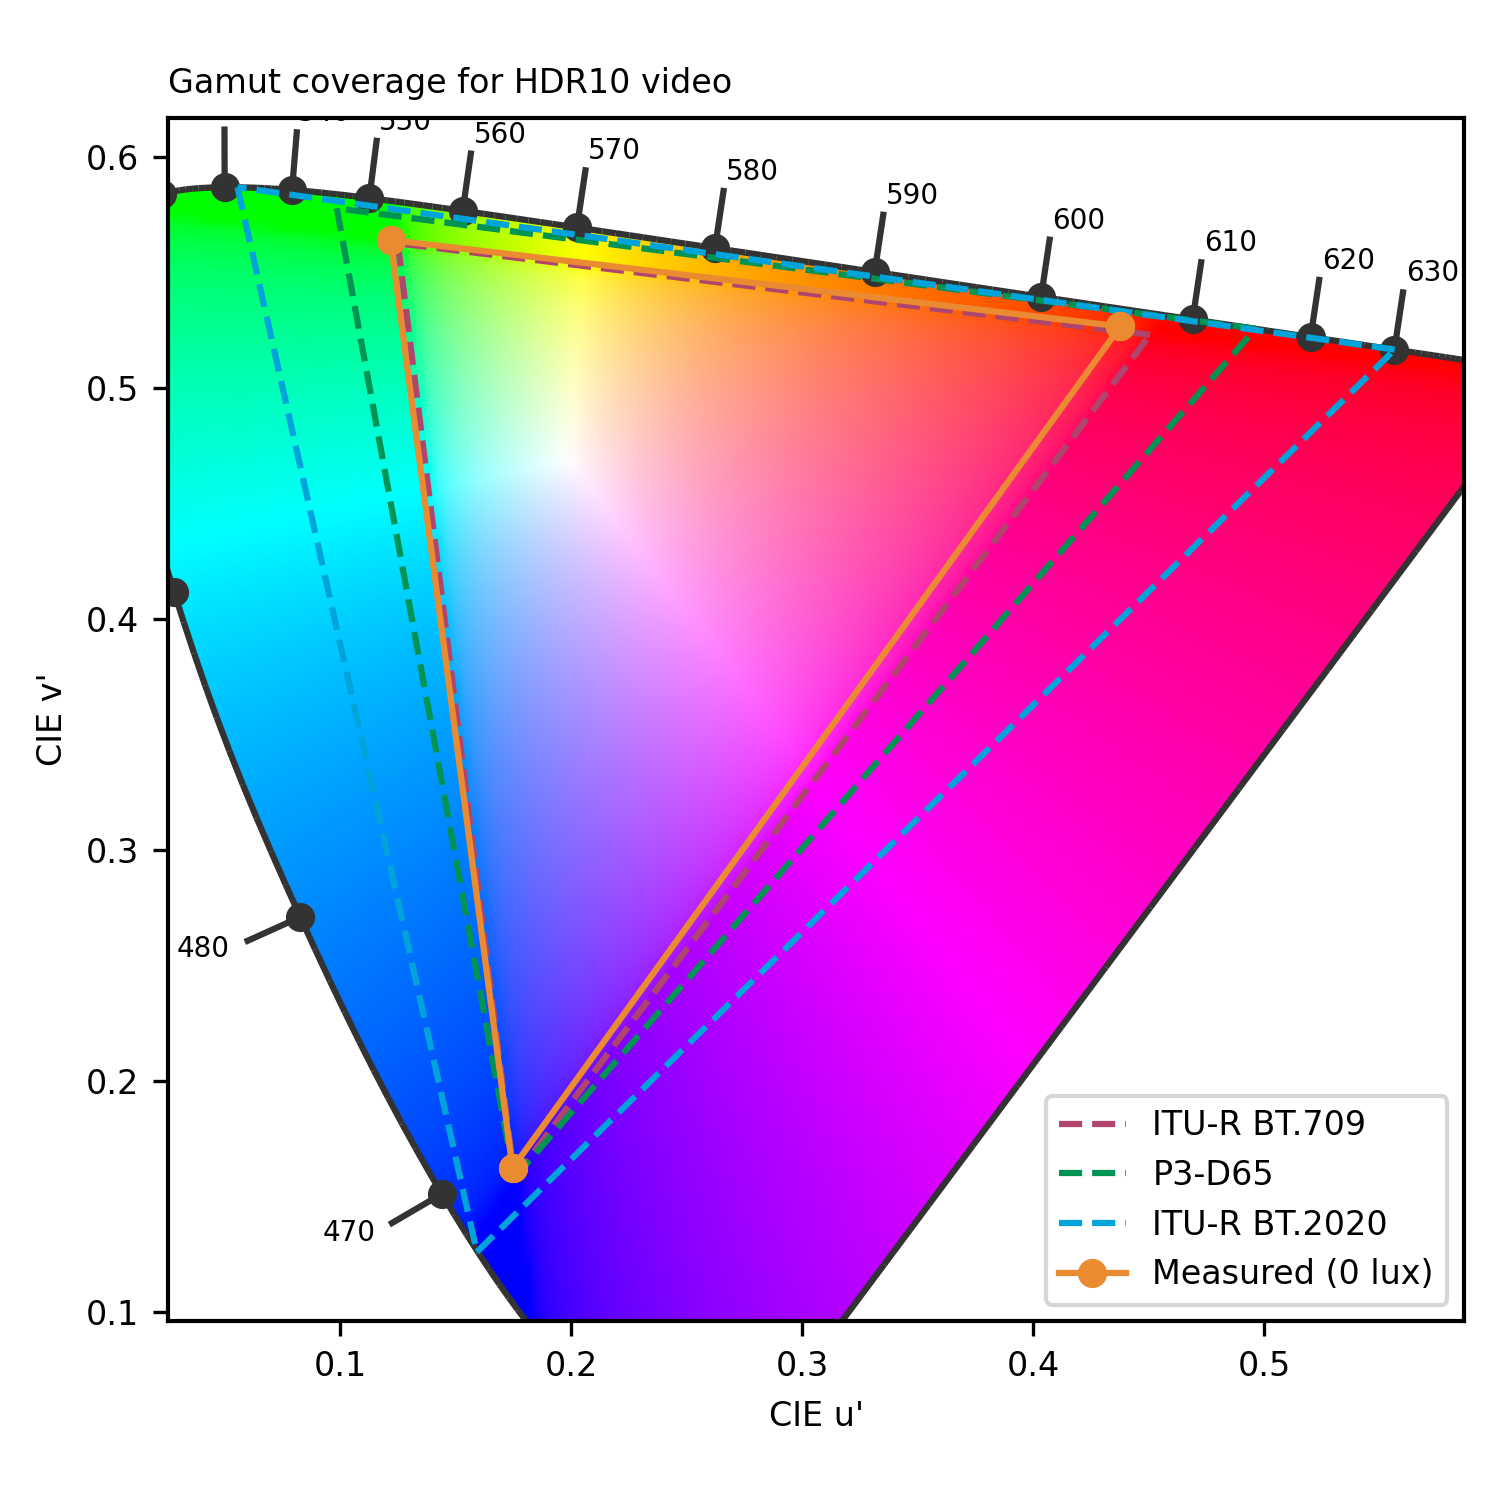
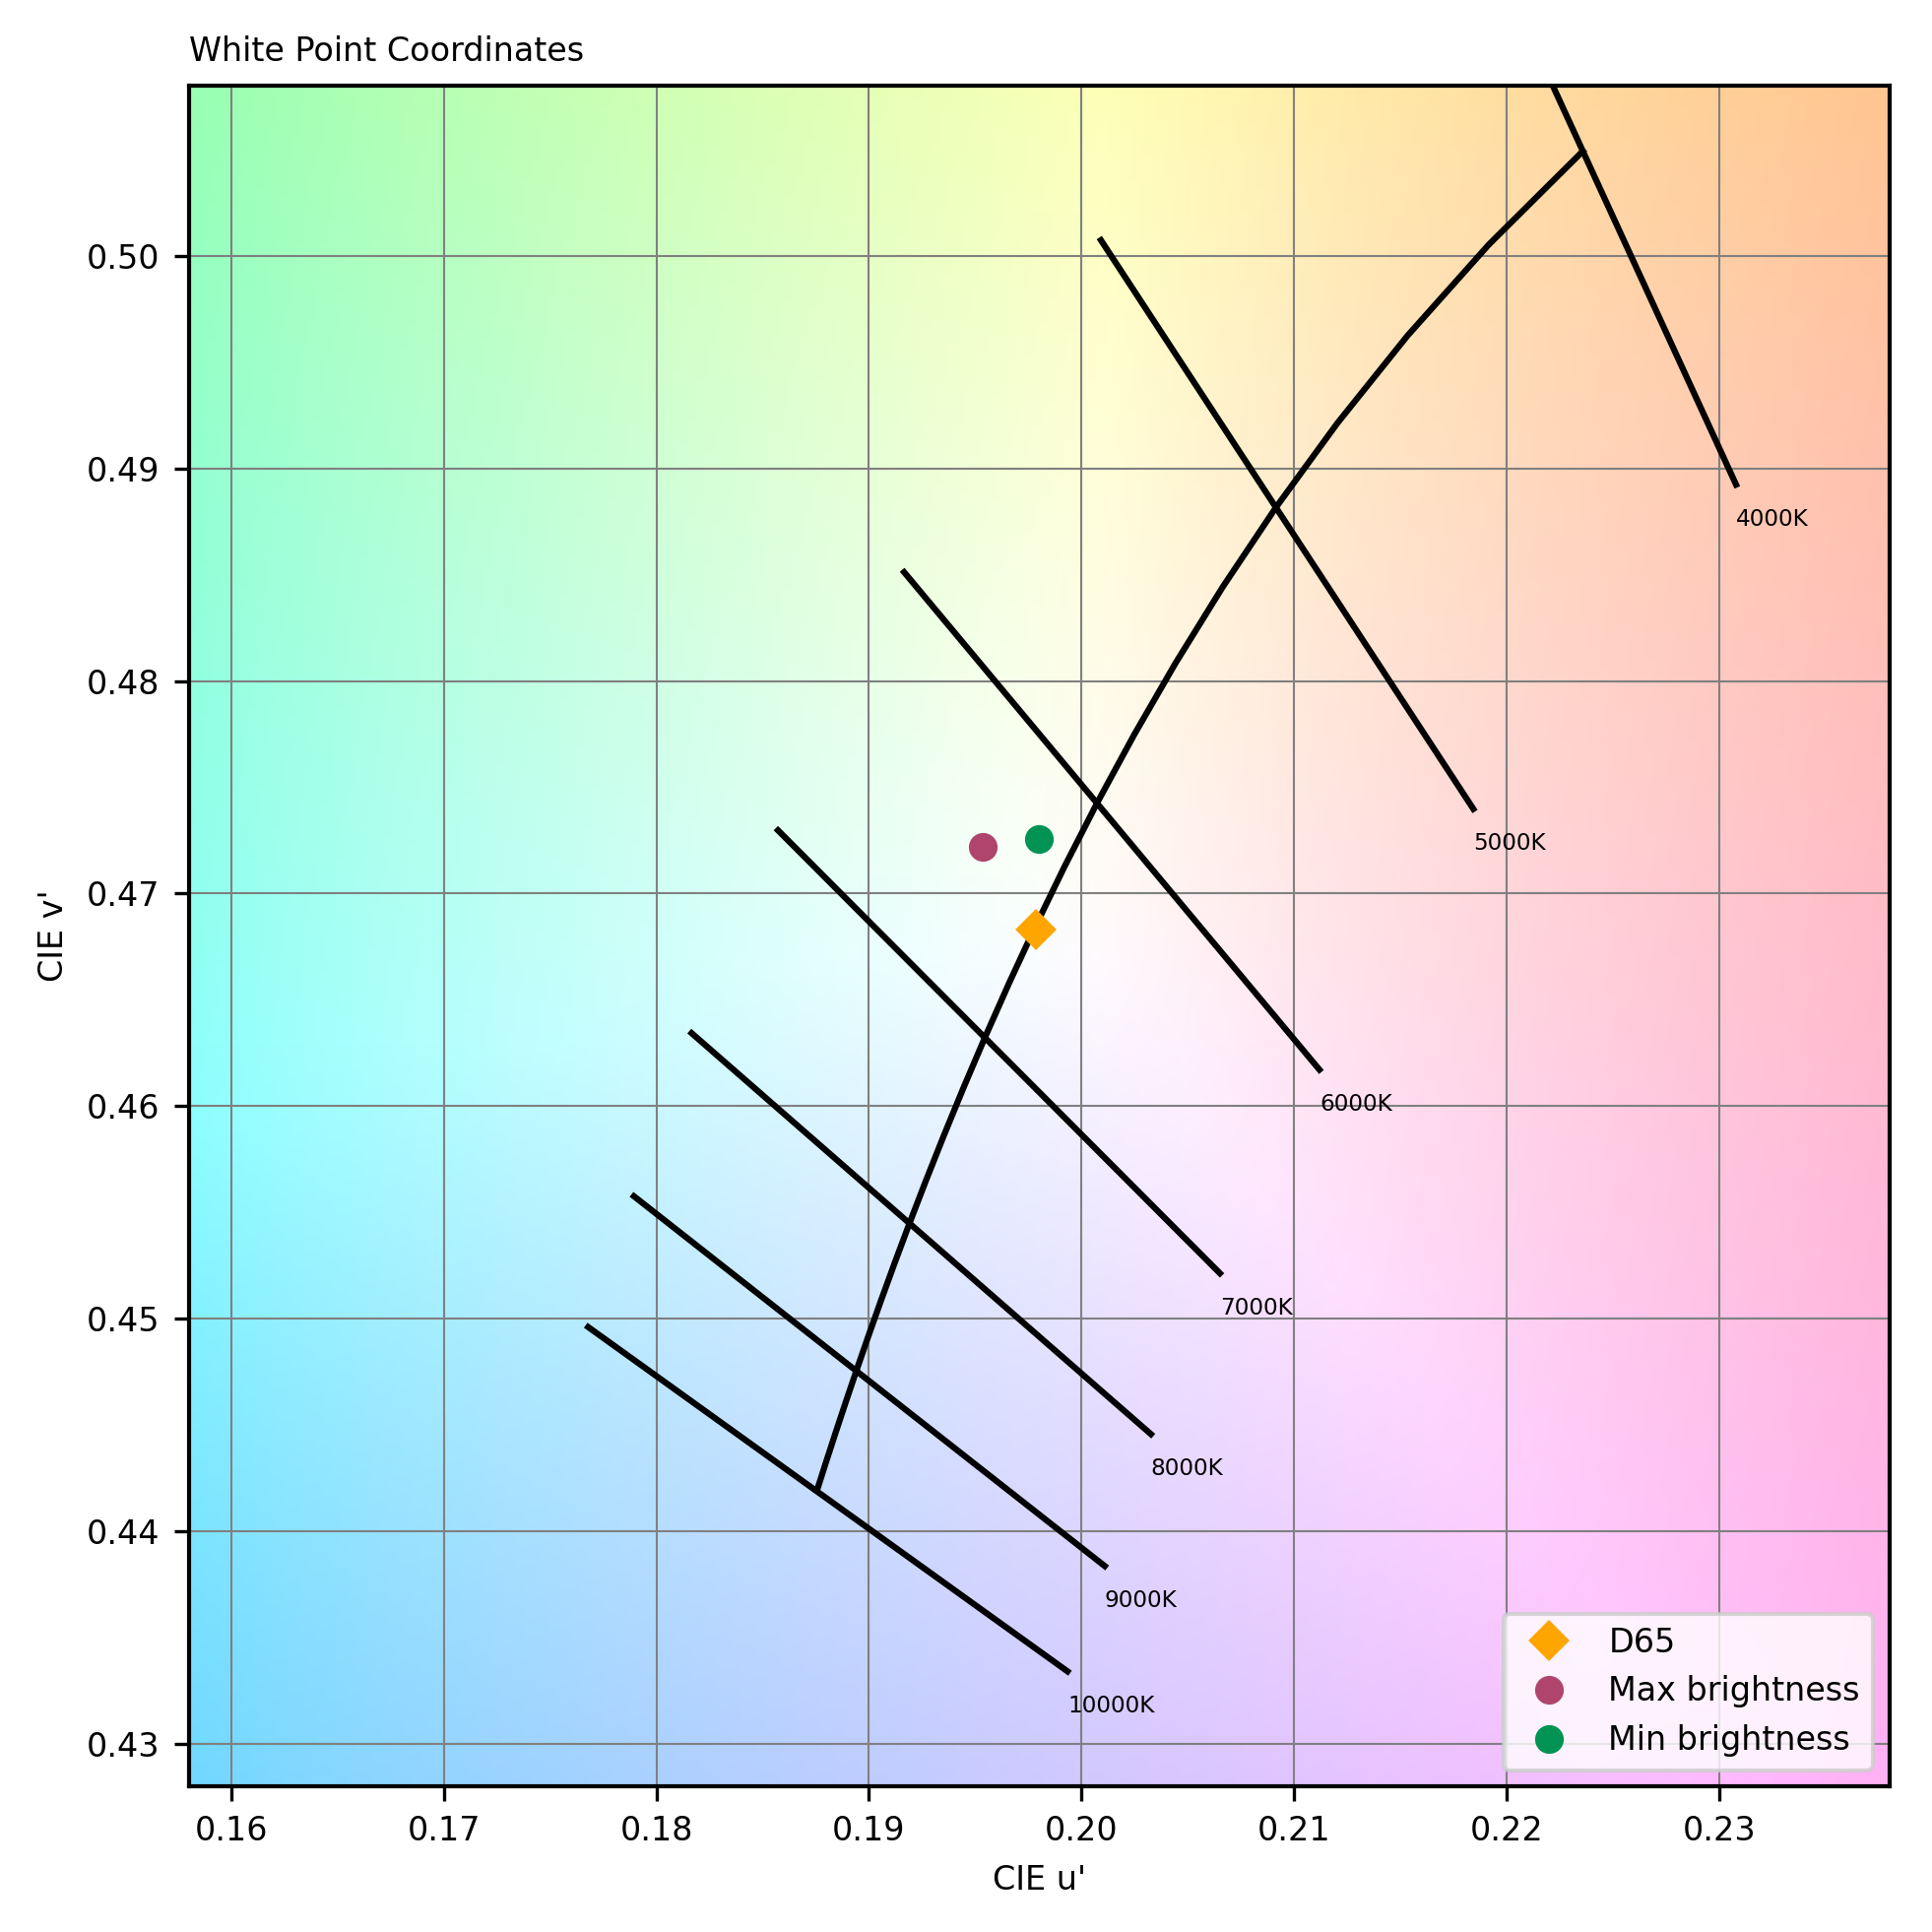
At 20 nits, minimum brightness was high enough to make viewing unpleasant in low-light conditions. Along with somewhat desaturated colors, the display’s video color gamut did not match BT-709 (SDR), and a lack of contrast especially affected dark tones. Colors were overall slightly desaturated, and high reflectance made the device hard to read in backlit situations.
Multimedia audio playback was heavily impacted by strong and inconsistent compression, pumping, and noticeable distortions even at medium volumes. A lack of bass and overall harsh timbre performance in playback made for an unsatisfactory audio experience.
Display
Acer Swift 14 (2023)
156
The following chart presents the display subscores for the multimedia use case:
The following graphs show the objective measurements performed in our display lab:
cd/m²
cd/m²
cd/m²
cd/m²
cd/m²
cd/m²
cd/m²
cd/m²
cd/m²
 Distribution of brightness (min)
cd/m²
cd/m²
cd/m²
cd/m²
cd/m²
cd/m²
cd/m²
cd/m²
cd/m²
Distribution of brightness (max)
Audio
Acer Swift 14 (2023)
152
The following chart presents the playback for the multimedia use case:
The following graphs show the frequency response, distortion and directivity in multimedia playback, recorded in our semi-anechoic room:
DXOMARK encourages its readers to share comments on the articles. To read or post comments, Disqus cookies are required. Change your Cookies Preferences and read more about our Comment Policy.