
When the Apple iPhone 11 Pro Max first appeared in fall 2019, DXOMARK lost no time putting it through its suite of rigorous tests for camera, selfie cam, and audio. In this review, we present a summary of our test results for the 11 Pro Max’s display.
Key display specifications:
- 6.5-inch OLED screen, 19.5:9 aspect ratio
- Centered notch on top
- Resolution: 1242 x 2688 px, screen pixel density: 458 ppi
- Refresh rate: 60 Hz
About DXOMARK Display tests: For scoring and analysis in our smartphone and other display reviews, DXOMARK engineers perform a variety of objective and perceptual tests under controlled lab and real-life conditions. This article highlights the most important results of our testing. Note that we evaluate display attributes using only the device’s built-in display hardware and default apps. (For in-depth information about how we evaluate smartphone and other displays, check out our articles, “How DXOMARK tests display quality” and “A closer look at DXOMARK Display testing.”)
Test summary
Scoring
Sub-scores and attributes included in the calculations of the global score.
 Apple iPhone 11 Pro Max
With an overall score of 84 resulting in a fourth place position in our rankings (out of nine devices tested so far), the Apple iPhone 11 Pro Max puts in a slightly disappointing performance in several of our new protocol’s attribute categories. While our experts found 11 Pro Max’s display to be a bit dim in nearly all cases, its weakest points are for color and touch: for the former, the iPhone had a persistent yellow cast in nearly all lighting conditions; for the latter, touch accuracy was problematic both for gallery app content (such as viewing still images and web browsing) and for gaming content. Finally, at its default settings, contrast was so low in nighttime conditions that text on the screen was essentially unreadable, especially with the blue light filter turned on.
Let’s dive right in and take a closer look at how the Apple performed in all our display attribute tests.
Analyses and comparisons
The DXOMARK Display overall score of 84 for the Apple iPhone 11 Pro Max is derived from its scores across six categories: readability, color, video, motion, touch, and artifacts. In this section, we’ll take a closer look at these display quality sub-scores and explain what they mean for the user, and we will compare the 11 Pro Max’s performance in several areas against two of its principal competitors, the Oppo Find X2 Pro and the Samsung Galaxy S20 Ultra 5G.

Readability
Apple iPhone 11 Pro Max
71
76
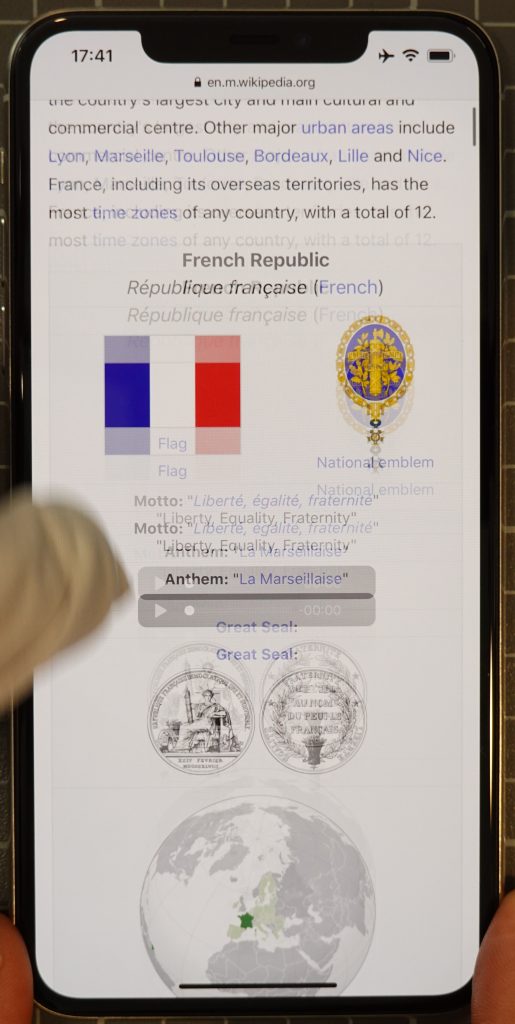
DXOMARK uses the device’s gallery app to show static (still image) content when measuring the device’s display for brightness, contrast, gamma, and blue light impact, etc.
The most important aspect of a display is how readable it is in various ambient lighting situations. Ideally, a user whose phone by default automatically adjusts display brightness and contrast should rarely if ever have to manually change the levels — whether because the screen is too dim to see well in bright light conditions or because its brightness at night makes the user wince at first glance (for example).
Providing proper brightness and contrast was a challenge for the Apple iPhone 11 Pro Max. Our testers found that the 11 Pro Max’s brightness for gallery app uses was simply not high enough to adequately respond to ambient light conditions (which impacts contrast), often making the display a bit hard to read overall.
Below you can see the relationship between brightness and contrast under different lighting conditions:
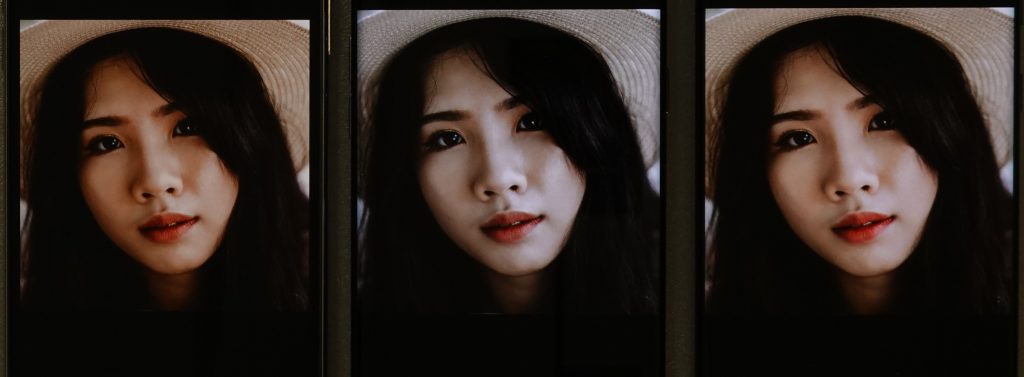
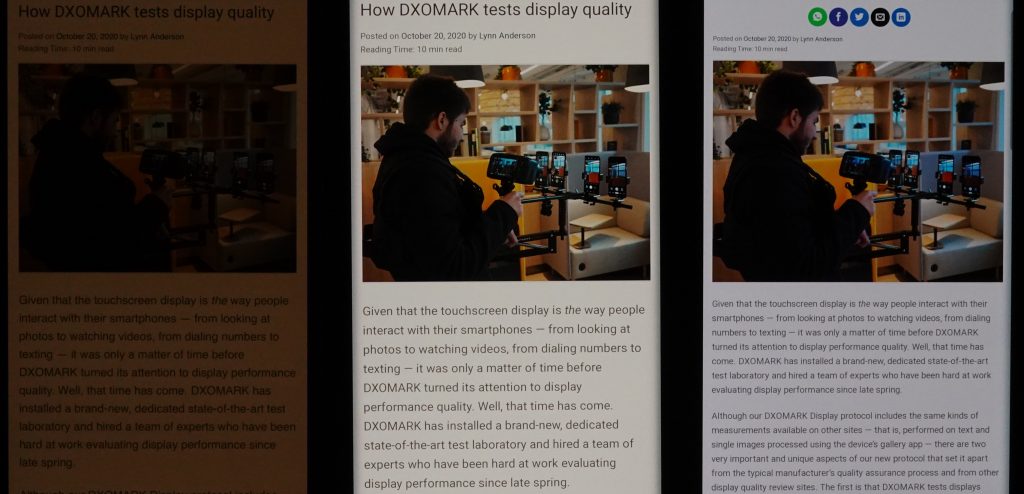
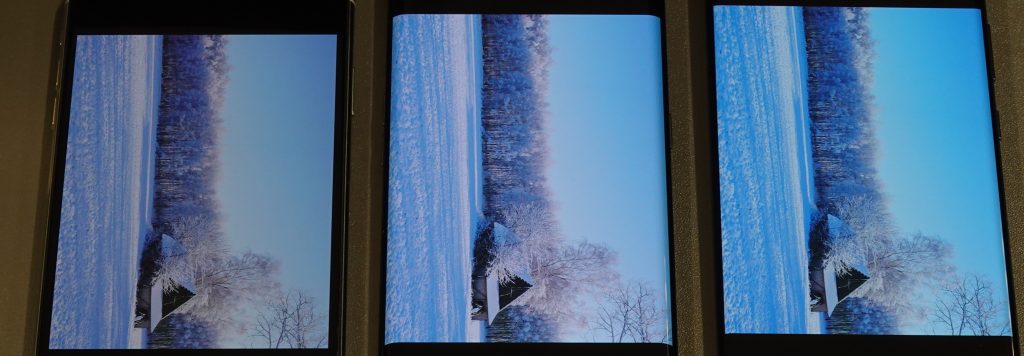
In the comparison shots below, you can see that the iPhone display (first on the left) is noticeably darker than the other two:
Although no phone display does truly well in bright outdoor conditions, the Apple does better than either the Oppo or Samsung at keeping details visible:
The Apple device is quick to react to rising light levels; while a little bit slower when reacting to decreasing light levels, its reaction time is nonetheless very well managed, and it is the top scorer for this sub-attribute. Transitions are very smooth, which translates into a very pleasant user experience.
Gamma is the relationship between the numerical value of a pixel in an image file and the brightness of that pixel when viewed on a screen. When the gamma is properly managed, the picture will look the same as on the reference screen in the dark. For this attribute, the iPhone does not do particularly well objectively, as its brightness level is too high in the lower gray levels, but then dips a bit in brightness around 90%. Perceptually, however, it did quite well, as it did not lose as much detail in dark or shaded parts of displayed images as some other devices. (Note that you can click on any of the device names in the graph below to select or deselect them so you can see their individual results and/or compare one or more at a time as you wish.)
On the plus side, the device’s brightness is uniform across the entire screen.
As is the case for all smartphone displays, the iPhone 11 Pro Max display loses brightness when viewed at an angle. As shown in the graph below, the Oppo device is better because it loses brightness slower than the others, which tend to lose brightness the same way (that is, they show the same curves between -30° and +30°). (Click on any of the device names in the graph below to select or deselect them so that you see their individual results and/or compare one or more at a time as you wish.)
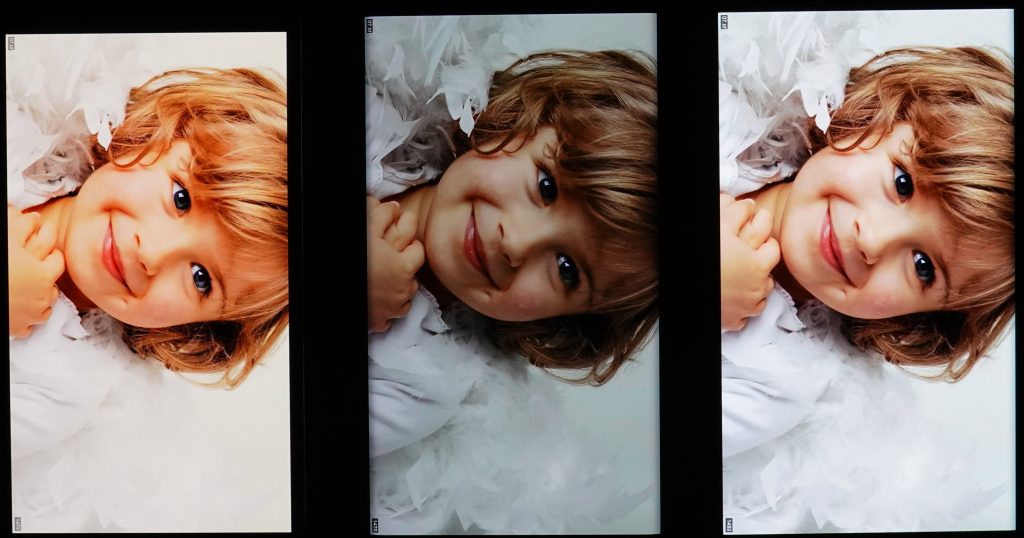
Our perceptual analyses underscored the objective findings. The Apple display is hobbled right from the get-go by having a darker screen than its competitors, as you can see in the on-axis images below:

Viewed at an angle of 45°, all three device displays lose some brightness, but only the Apple shows significant loss, compounding the problem of a display that was already a bit too dark. That said, the iPhone maintains decent contrast in our comparison example below:

As for its blue light filter, we must first note that the iPhone 11 Pro Max struggled to provide enough brightness and contrast to be readable at its lowest settings, especially at night, regardless of whether the blue light filter (BLF) was turned off or on, as the comparisons below show.
Without BLF:
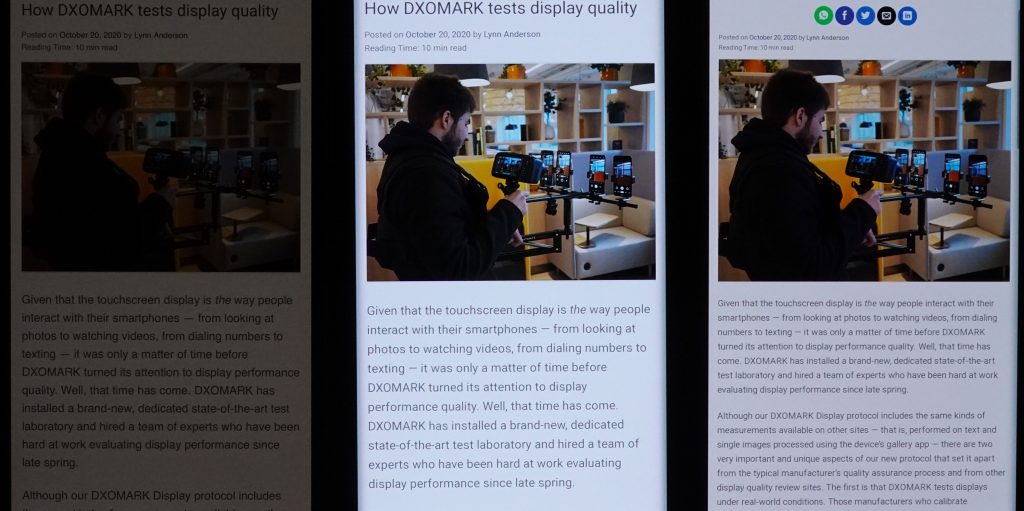
The Apple is hard to read above, but with the BLF on, matters only get worse (and very visibly so), as the BLF not only drastically reduces brightness, but also produces a very strong orange cast, making the iPhone truly unreadable.

Color
Apple iPhone 11 Pro Max
71
92
DXOMARK uses the device’s gallery app to show static (still image) content when measuring the device’s display for white point, gamut, uniformity, color fidelity, and blue light filter impact, etc.
Color was a source of some disappointment on the Apple iPhone 11 Pro Max. Although its sub-score for its performance in our white point vs. ambient lighting tests beat out the comparison devices, its performance in other categories, and particularly its noticeable yellow cast in all conditions and in BLF performance dragged it below the other two smartphone displays.
Two positive points are that the Apple smoothly corrects its white point when the illuminant changes, and that color is uniform across the entire display. However, in addition to the very prevalent yellow cast in indoor and outdoor conditions mentioned above, the iPhone’s colors also appear slightly faded outdoors.
On-angle viewing
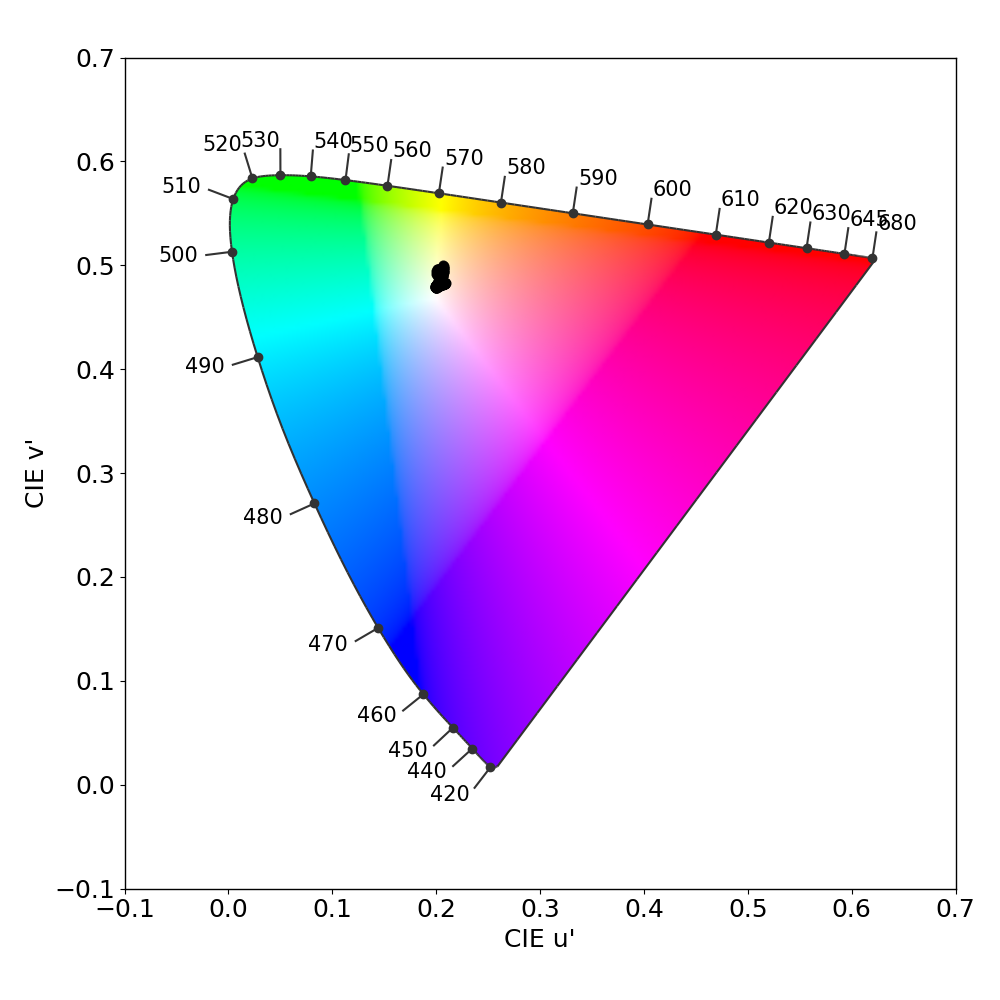
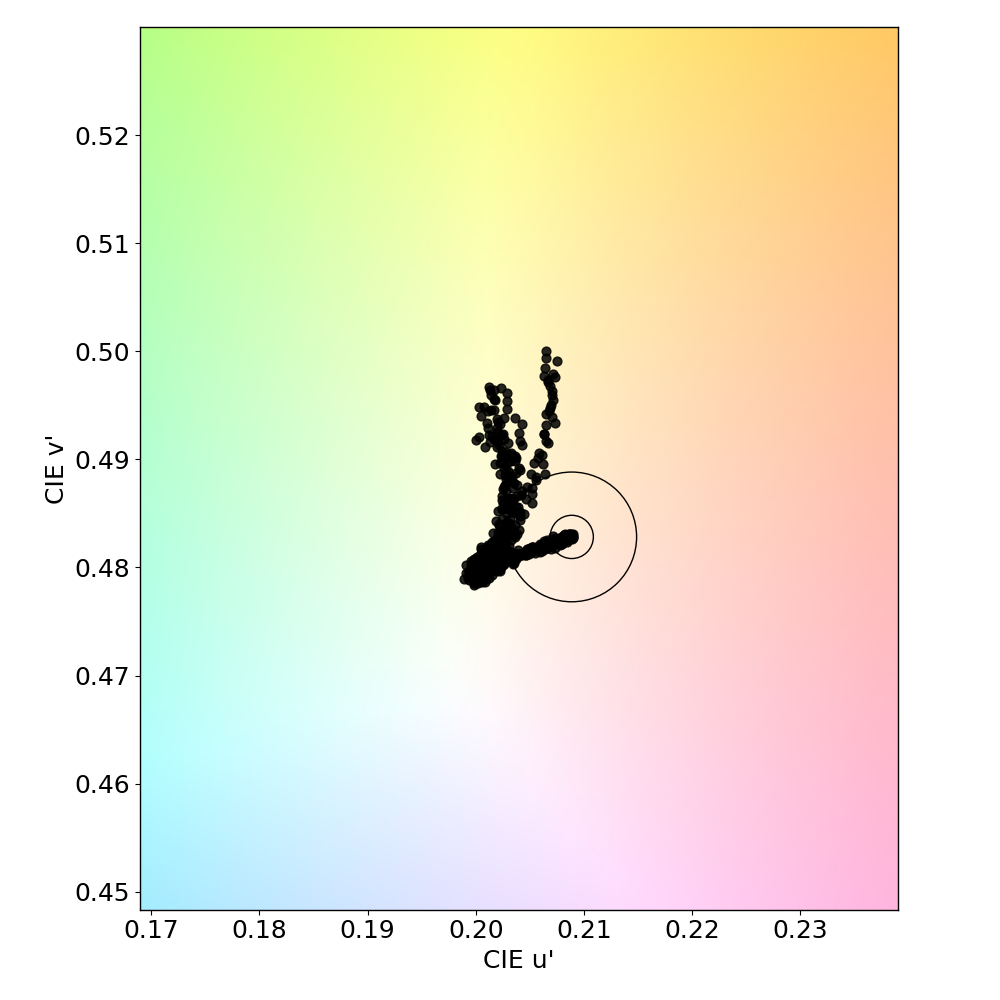
Users don’t consistently look at their smartphones full-on, sometimes holding them at an angle, which affects how well they can see certain aspects of the display. In our tests for white point on angle, the iPhone 11 Pro Max’s objective results in the left-hand chart below show that the whitest area in which there are black dots is already very slightly yellow, and that most of the rest of the cluster is in clearly visible yellow country. The right-hand chart below is essentially a closeup of the left chart’s results. Each dot represents a measurement taken at a discrete angle and distance from the device; dots inside the inner circle exhibit no color shift; those between the inner and outer circle have shifts that are just barely noticeable except by experts; but those falling outside the outer circle are noticeable. And as you can see, the Apple heads off into yellow-green territory.
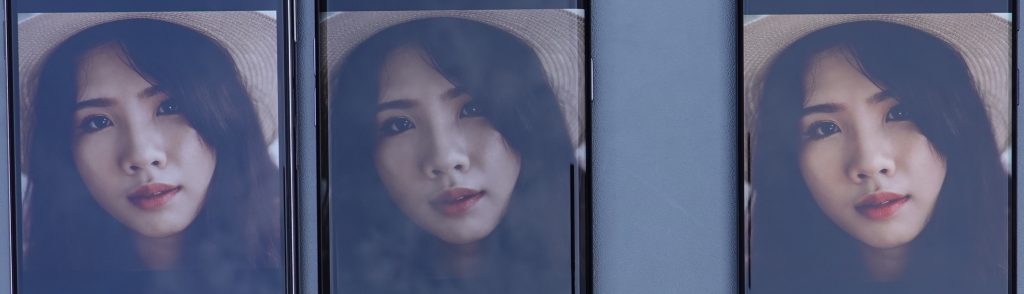
Our perceptual evaluation matches that of our objective tests. As you can see in the comparison photos below, the Apple device (first on the left) shows something of a yellowish cast when viewed on-axis…
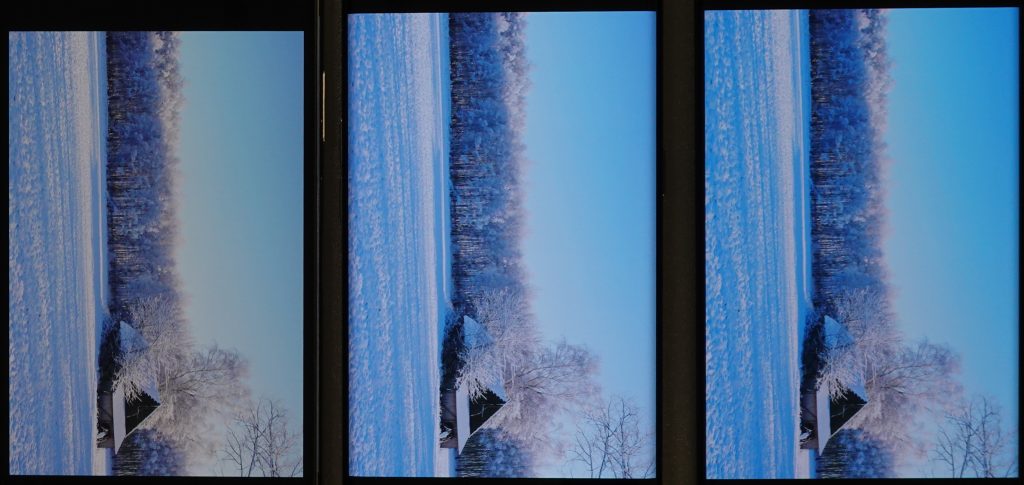
… but at an angle of 45°, the color shift is much more pronounced, and takes on a greenish cast.
Strictly in terms of color, although the greenish cast on-angle noted above is somewhat distracting, a much more noticeable problem (if not the most noticeable problem) for color on the iPhone 11 Pro Max, as previously discussed in the section about BLF brightness, is its shift to a very strong orange cast when the blue light filter is on.

Video
Apple iPhone 11 Pro Max
72
91
DXOMARK uses the device’s video (or browser) app to show dynamic content when measuring the device’s display for brightness, contrast, gamma, and color.
The Apple iPhone 11 Pro Max’s video performance was a bit of a mixed bag. Although as we mentioned from the very first that its overall display tended to be dim (particularly when handling gallery app content), it was actually a bit too bright when dealing with HDR10 video content. (Its rendering of SDR video content was too dark, however.)
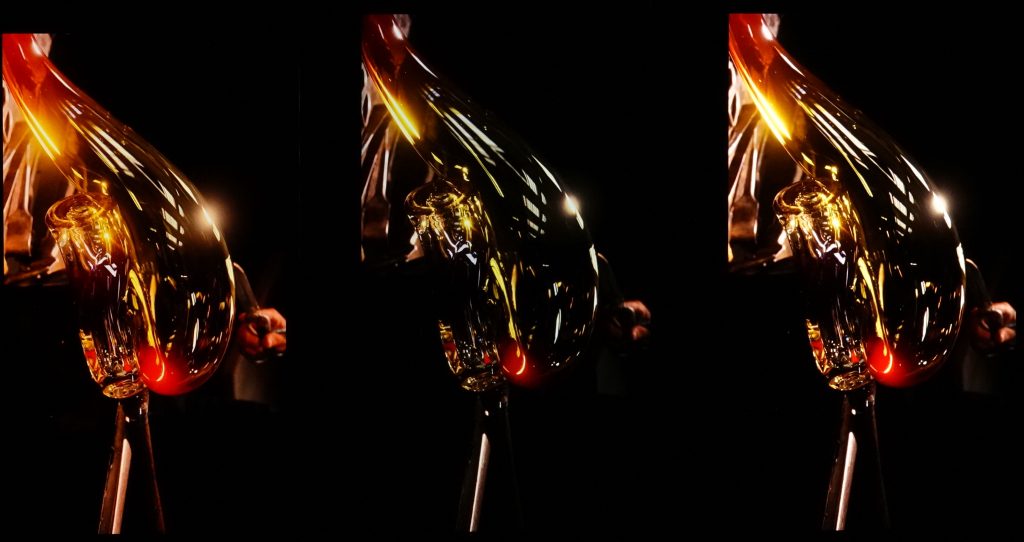
Contrast was a video sub-attribute for which the Apple device not only received a good score, but actually bested the competition (its output is the first on the left):
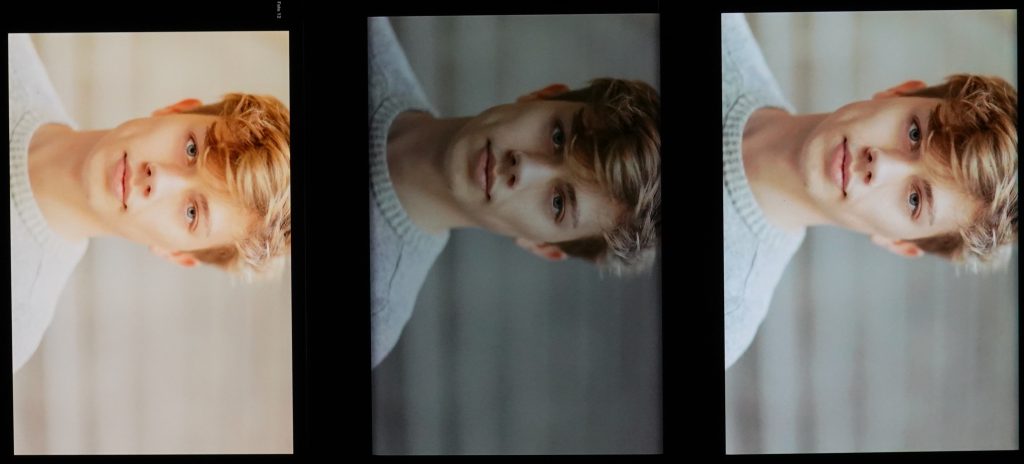
However, the iPhone 11 Pro Max struggled to render midtones well. And as for video color, just as with gallery app content, the Apple device showed a strong yellow cast in its video rendering, with skin tones particularly affected, as seen below:
This all said, it should be noted that the 11 Pro Max’s video makes use of Apple’s “TrueTone” technology by default; with the feature turned off, the rendering of skin tones in particular was much more natural-looking.

Motion
Apple iPhone 11 Pro Max
81
87
Although it showed a bit of stutter at 30 and 60 fps, the iPhone 11 Pro Max nevertheless did pretty well in for frame drops overall. Our testers saw a few only rarely when playing video games. For motion blur, the Apple device matches the performance of the Oppo, with both displays appearing sharp and neither device showing frame duplication.
The Oppo soundly beat both the Apple and the Samsung for playback reactivity, with the Apple’s performance dipping a little, as it tended to play videos after a noticeable fraction of second and displayed some artifacts (notably blocking and pixelation) during the delay.

Touch
Apple iPhone 11 Pro Max
57
85
The Apple iPhone 11 Pro Max is accurate when zooming in the gallery app; however, its accuracy when gaming was not acceptable, because while touch accuracy was good towards the center of the screen, it diminished out toward the edges, resulting in erroneous selections.
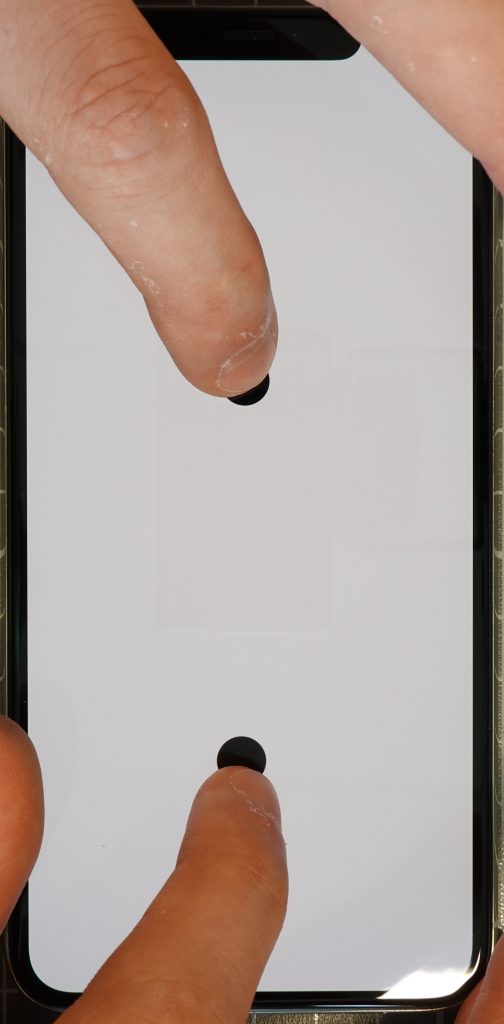
That all said, Apple iPhone 11 Pro Max’s touch response in all conditions is pleasingly quick and smooth when both scrolling and zooming, whether handling content in the gallery app, browsing the web, or gaming.

Artifacts
Apple iPhone 11 Pro Max
81
86
The iPhone 11 Pro Max’s notch is quite visible, which can affect the viewing experience a bit when gaming.
Because they have glossy rather than matte finishes, all smartphone screens have some degree of reflectance. The Apple device is not too bad in this regard, however, especially when compared to the S20 Ultra, which is barely readable in bright light outdoors.
All devices flicker to some degree; the iPhone’s flicker is higher than that of its rivals at most frequencies, although the Samsung surpasses it at the lowest end of the continuum and shows a spike at around 240 Hz. This said, flicker is not likely to affect most users’ viewing experience. (Click on any of the device names in the graph below to select or deselect them so you can see their individual results and/or compare one or more at a time as you wish.)
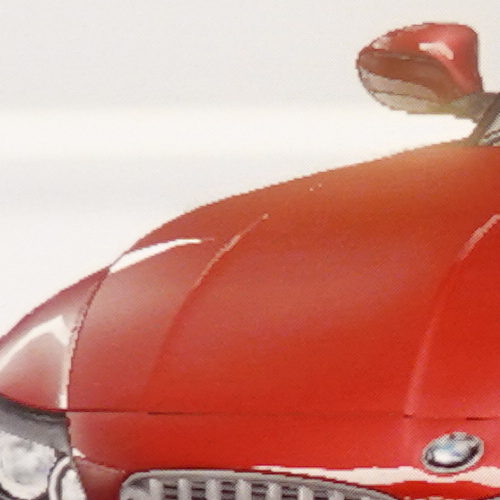
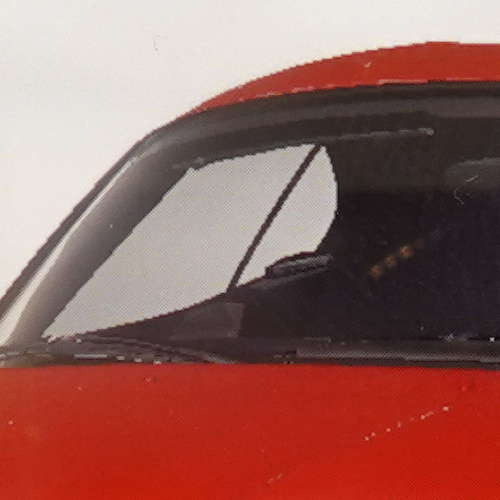
A strong point for the iPhone 11 Pro Max was how well it handled aliasing, which was far better than its competitors. You can see in the closeups of the Apple rendering below that the curved contours have very well-defined lines, with very fine (as opposed to noticeably coarse) “stair-stepping”:

The 11 Pro Max does not suffer from ghost touches or similar kinds of disturbances. Further, it manages judder very well, properly performing 3:2 pulldown for 24 fps content and showing no visible judder when handling content at 30 or 60 fps.
Conclusion
Although it scored fairly well for readability, thanks to its handling of gamma and its smooth light transitions, the somewhat dark display overall took a bit of a toll on the iPhone 11 Pro Max’s overall score, particularly with respect to impact of its blue light filter. This said, more serious issues are its problems with color rendering and touch accuracy. On the plus side, the Apple device shows very few frame drops and has good control of motion blur; other high points were its control of aliasing and judder. But if you’re an insomniac who uses your phone to read or browse websites or watch videos in bed until you fall asleep, plan on manually controlling the display brightness.
Pros
- Excellent control of aliasing, with well-defined lines when gaming
- Good readability in indoor conditions
- Very smooth light transitions
- Motion blur is well controlled.
Cons
- Readability is too low in outdoor conditions.
- Blue light filter has a significant impact on brightness and color.
- Touch is not accurate, especially along the edges.
- Brightness is too high when watching HDR10 content in the dark.
DXOMARK encourages its readers to share comments on the articles. To read or post comments, Disqus cookies are required. Change your Cookies Preferences and read more about our Comment Policy.