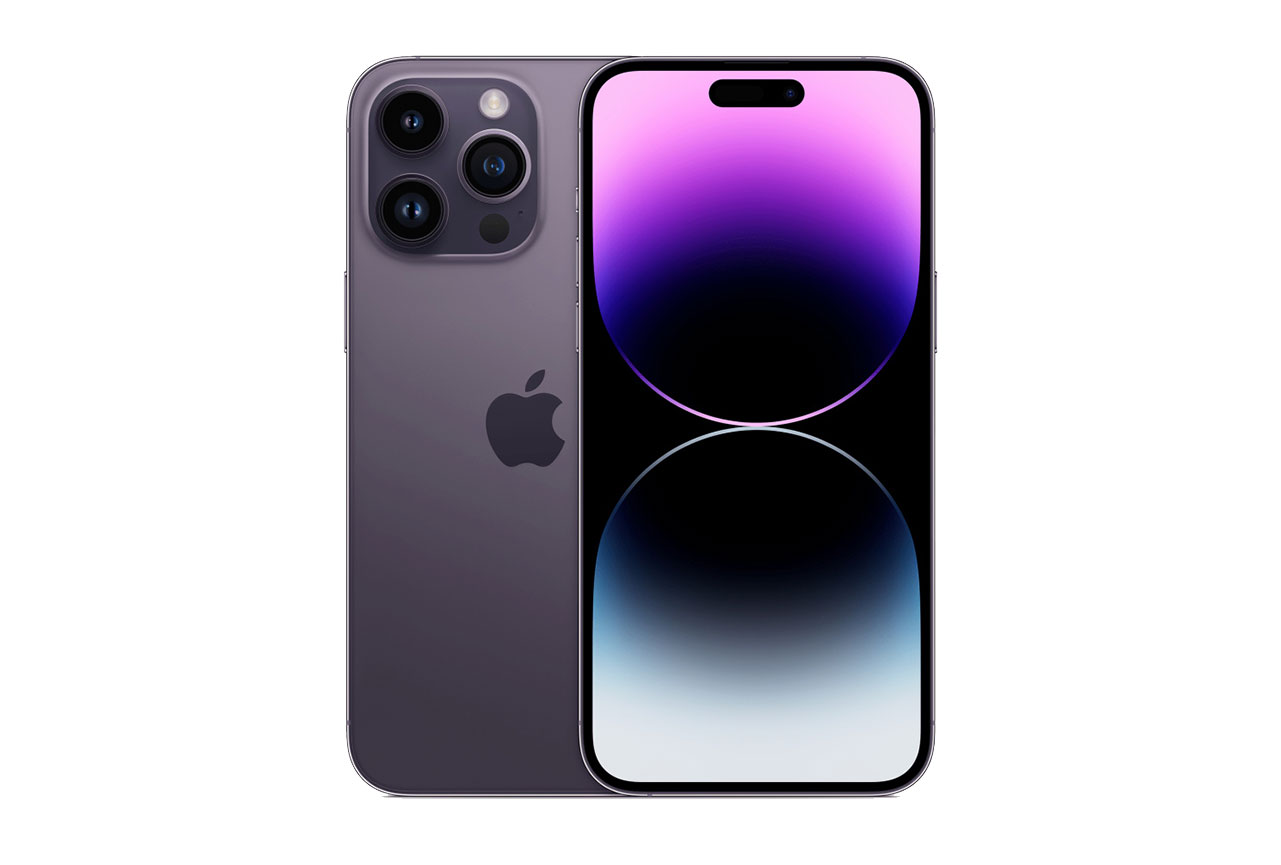
The Apple iPhone 14 Pro Max and iPhone 14 Pro share the same rear camera specs, as well the same A16 Bionic processor, so as expected, the results of the Apple iPhone 14 Pro Max camera are exactly the same as those of the iPhone14 Pro.
We’ve included a few examples from our testing to show the similarities between these two models. But for a more in-depth look at the iPhone 14 Pro Max’s rear camera photo and video performance, we direct you to the full test results of the iPhone 14 Pro.
Overview
Key camera specifications:
- Primary: 48MP sensor, 24 mm equivalent f/1.78 -aperture lens, second generation sensor-shift OIS, Dual Pixel AF
- Ultra-wide: 12MP sensor, 13mm equivalent f/2.2-aperture lens, Dual Pixel AF
- Tele: 12MP sensor, 77 mm equivalent f/2.8-aperture lens, OIS
- HDR video recording with Dolby Vision
- A16 Bionic chipset
Scoring
Sub-scores and attributes included in the calculations of the global score.
 Apple iPhone 14 Pro Max

146
camera
111
Huawei Pura 70 Ultra
Best: Huawei Pura 70 Ultra (130)
119
Apple iPhone 16 Pro
Best: Apple iPhone 16 Pro (130)
112
Huawei Pura 70 Ultra
Best: Huawei Pura 70 Ultra (125)
111
Xiaomi 15 Ultra
Best: Xiaomi 15 Ultra (125)
87
Huawei Pura 70 Ultra
Best: Huawei Pura 70 Ultra (117)
72
Xiaomi Redmi 12 5G
Best: Xiaomi Redmi 12 5G (82)
80
Huawei Pura 70 Ultra
Best: Huawei Pura 70 Ultra (85)
91
Apple iPhone 16 Pro
Best: Apple iPhone 16 Pro (93)
103
Xiaomi 15 Ultra
Best: Xiaomi 15 Ultra (128)
100
Huawei Pura 70 Ultra
Best: Huawei Pura 70 Ultra (122)
115
Oppo Find X8 Pro
Best: Oppo Find X8 Pro (116)
117
Oppo Find X8 Pro
Best: Oppo Find X8 Pro (120)
117
Huawei Pura 70 Ultra
Best: Huawei Pura 70 Ultra (120)
113
Oppo Find X6 Pro
Best: Oppo Find X6 Pro (118)
117
Apple iPhone 16 Pro
Best: Apple iPhone 16 Pro (120)
74
Xiaomi 12S Ultra
Best: Xiaomi 12S Ultra (86)
117
Apple iPhone 16 Pro
Best: Apple iPhone 16 Pro (119)
Use cases & Conditions
Use case scores indicate the product performance in specific situations. They are not included in the overall score calculations.
Outdoor
Photos & videos shot in bright light conditions (≥1000 lux)
Indoor
Photos & videos shot in good lighting conditions (≥100lux)
Lowlight
Photos & videos shot in low lighting conditions (<100 lux)
Friends & Family
Portrait and group photo & videos
Pros
- Pleasant and vivid color in photo and video, accurate skin tones
- Wide dynamic range in photo and video, excellent contrast
- High level of detail in photo and video
- Excellent autofocus for photo and video
- Pleasant simulated bokeh effect with very good details on faces
- High-quality continuous photo and video zoom at close and medium range
- Excellent video stabilization
Photo
143
Huawei Pura 70 Ultra
Huawei Pura 70 Ultra
Autofocus irregularity and speed: 20Lux Δ0EV Tungsten Handheld
This graph illustrates focus accuracy and speed and also zero shutter lag capability by showing the edge acutance versus the shooting time measured on the AFHDR setup on a series of pictures. All pictures were taken at 20Lux with Tungsten illuminant, 500ms after the defocus. The edge acutance is measured on the four edges of the Dead Leaves chart, and the shooting time is measured on the LED Universal Timer.
DXOMARK CHART (DMC) detail preservation score vs lux levels for tripod and handheld conditions
This graph shows the evolution of the DMC detail preservation score with the level of lux, for two holding conditions. DMC detail preservation score is derived from an AI-based metric trained to evaluate texture and details rendering on a selection of crops of our DXOMARK chart.
Zoom
139
Xiaomi 15 Ultra
Xiaomi 15 Ultra
DXOMARK CHART (DMC) detail preservation score per focal length
This graph shows the evolution of the DMC detail preservation score with respect to the full-frame equivalent focal length for different light conditions. The x-axis represents the equivalent focal length measured for each corresponding shooting distance and the y-axis represents the maximum details preservation metric score: higher value means better quality. Large dots correspond to zoom ratio available in the user interface of the camera application.
Video
149
Apple iPhone 16 Pro
Apple iPhone 16 Pro
DXOMARK CHART (DMC) detail preservation video score vs lux levels
This graph shows the evolution of the DMC detail preservation video score with the level of lux in video. DMC detail preservation score is derived from an AI-based metric trained to evaluate texture and details rendering on a selection of crops of our DXOMARK chart.


DXOMARK encourages its readers to share comments on the articles. To read or post comments, Disqus cookies are required. Change your Cookies Preferences and read more about our Comment Policy.