We put the Apple iPhone 15 Pro Max through our rigorous DXOMARK Display test suite to measure its performance across six criteria. In this summary of test results, we will break down how it fared in a variety of tests and several common use cases.
Overview
Key display specifications:
- 6.7 inches AMOLED Retina XDR, (~89.5% screen-to-body ratio)
- Dimensions: 159.9 x 76.7 x 8.25 mm (6.30 x 3.02 x 0.32 inches)
- Resolution: 1290 x 2796 pixels, (~460 ppi density)
- Aspect ratio: none
- Refresh rate: 120 Hz
Scoring
Sub-scores and attributes included in the calculations of the global score.
 Apple iPhone 15 Pro Max

149
display
160
Samsung Galaxy S24+ (Exynos)
Best: Samsung Galaxy S24+ (Exynos) (163)
139
Google Pixel 8 Pro
Best: Google Pixel 8 Pro (164)
147
Samsung Galaxy S23
Best: Samsung Galaxy S23 (162)
151
Honor Magic6 Pro
Best: Honor Magic6 Pro (159)
142
Samsung Galaxy S24+ (Exynos)
Best: Samsung Galaxy S24+ (Exynos) (170)
140
OnePlus Open
Best: OnePlus Open (163)
Position in Global Ranking

11
th
2. Samsung Galaxy S24 Ultra
155
3. Samsung Galaxy S24+ (Exynos)
154
3. Samsung Galaxy S24 (Exynos)
154
7. Samsung Galaxy Z Fold5
152
11. Apple iPhone 15 Pro Max
149
11. Apple iPhone 14 Pro Max
149
11. Samsung Galaxy Z Flip5
149
16. Samsung Galaxy S23 Ultra
148
23. Apple iPhone 13 Pro Max
145
28. Samsung Galaxy A55 5G
141
30. Honor Magic4 Ultimate
140
43. Samsung Galaxy S22 Ultra (Snapdragon)
136
46. Samsung Galaxy S22+ (Exynos)
135
51. Samsung Galaxy Z Flip4
134
51. Samsung Galaxy S22 Ultra (Exynos)
134
51. Samsung Galaxy A35 5G
134
51. Vivo X80 Pro (MediaTek)
134
58. Samsung Galaxy Z Fold4
133
58. Samsung Galaxy S22 (Snapdragon)
133
58. Samsung Galaxy S22 (Exynos)
133
58. Vivo X80 Pro (Snapdragon)
133
65. Samsung Galaxy S21 Ultra 5G (Snapdragon)
131
65. Samsung Galaxy S21 Ultra 5G (Exynos)
131
69. Samsung Galaxy S21 FE 5G (Snapdragon)
130
76. Samsung Galaxy Z Fold3 5G
129
76. Samsung Galaxy Note20 Ultra 5G (Snapdragon)
129
85. Samsung Galaxy Z Flip3 5G
128
85. Samsung Galaxy S23 FE
128
85. Samsung Galaxy Note20 Ultra 5G (Exynos)
128
90. Apple iPhone 12 Pro Max
127
97. Vivo X70 Pro (MediaTek)
125
97. Vivo X60 Pro 5G (Snapdragon)
125
113. Oppo Reno6 Pro 5G (Snapdragon)
123
113. Samsung Galaxy S20 Ultra 5G (Exynos)
123
113. Xiaomi Redmi Note 13 Pro Plus 5G
123
118. Apple iPhone SE (2022)
122
118. Motorola Edge 30 Pro
122
124. Samsung Galaxy A54 5G
120
128. Motorola Edge 40 Pro
118
131. Motorola Razr 40 Ultra
117
135. Apple iPhone 11 Pro Max
116
140. Motorola Edge 20 Pro
111
140. Samsung Galaxy A52 5G
111
144. Samsung Galaxy A52s 5G
110
150. Xiaomi Redmi K50 Gaming
107
152. Nubia RedMagic 6 Pro
105
153. Samsung Galaxy A53 5G
104
161. Microsoft Surface Duo
99
163. Nubia RedMagic 7 Pro
97
164. Xiaomi Mi 10T Pro 5G
95
172. Samsung Galaxy A22 5G
74
173. Xiaomi Black Shark 3 Pro
69
175. Lenovo Legion Phone 2 Pro
60
Position in Ultra-Premium Ranking
9
th
2. Samsung Galaxy S24 Ultra
155
3. Samsung Galaxy S24+ (Exynos)
154
5. Samsung Galaxy Z Fold5
152
9. Apple iPhone 15 Pro Max
149
9. Apple iPhone 14 Pro Max
149
9. Samsung Galaxy Z Flip5
149
14. Samsung Galaxy S23 Ultra
148
20. Apple iPhone 13 Pro Max
145
25. Honor Magic4 Ultimate
140
34. Samsung Galaxy S22 Ultra (Snapdragon)
136
36. Samsung Galaxy S22+ (Exynos)
135
39. Samsung Galaxy Z Flip4
134
39. Samsung Galaxy S22 Ultra (Exynos)
134
39. Vivo X80 Pro (MediaTek)
134
44. Samsung Galaxy Z Fold4
133
44. Vivo X80 Pro (Snapdragon)
133
48. Samsung Galaxy S21 Ultra 5G (Snapdragon)
131
48. Samsung Galaxy S21 Ultra 5G (Exynos)
131
55. Samsung Galaxy Z Fold3 5G
129
55. Samsung Galaxy Note20 Ultra 5G (Snapdragon)
129
59. Samsung Galaxy Z Flip3 5G
128
59. Samsung Galaxy Note20 Ultra 5G (Exynos)
128
63. Apple iPhone 12 Pro Max
127
74. Samsung Galaxy S20 Ultra 5G (Exynos)
123
80. Motorola Razr 40 Ultra
117
81. Apple iPhone 11 Pro Max
116
85. Microsoft Surface Duo
99
88. Xiaomi Black Shark 3 Pro
69
Pros
- Readable in most tested conditions, including outdoors
- More vivid colors in photos
- Strong frame drop performance
Cons
- A strong orange cast impacts color rendering and skin tones in photos and videos
- HDR10 videos lack contrast in midtones compared to its predecessor
- Low flicker frequency
The Apple iPhone 15 Pro Max is very similar to its predecessor overall, sharing fourth place with the 14 Pro Max in our Display database, coming in behind the Honor Magic5 Pro and the latest folding phones from Google and Samsung. The 15 Pro Max’s performance in our readability category leads all others among smartphones tested to date. In other categories, the 15 Pro Max shows a strong performance in motion and in artifacts management; and although color and video performances are good, those attributes still have room for improvement.
Test summary
About DXOMARK Display tests: For scoring and analysis in our smartphone and other display reviews, DXOMARK engineers perform a variety of objective and perceptual tests under controlled lab and real-life conditions. Note that we evaluate display attributes using only the device’s built-in display hardware and its still image (gallery) and video apps at their default settings. (For in-depth information about how we evaluate smartphone and other displays, check out our articles, “How DXOMARK tests display quality” and “A closer look at DXOMARK Display testing.”
The following section gathers key elements of our exhaustive tests and analyses performed in DXOMARK laboratories. Detailed performance evaluations under the form of reports are available upon request. Do not hesitate to contact us.
Readability
160
Samsung Galaxy S24+ (Exynos)
Samsung Galaxy S24+ (Exynos)
How Display Readability score is composed
Readability evaluates how easily and comfortably users can read still content (photos & web) on the display under different real-life conditions. DXOMARK uses its Display Bench to recreate ambient light conditions ranging from total darkness to bright sunlight. In addition to laboratory tests, perceptual analysis is also made in real-life environments.
The Apple iPhone 15 Pro Max is readable in most conditions, including outdoors, with an impressive 2260 nits measured on a 20% average picture level (APL) white pattern. However, brightness drops drastically at higher APLs, reaching only 1100 nits at 80% APL (similar to web page APL), meaning that the device is more suited for viewing photos than web pages outdoors. Further, the 15 Pro Max is still tuned for only 2 nits in low-light conditions; although this is suitable for a middle-of-the-night kind of environment, users may need to manually adjust the brightness in other conditions. The 15 Pro Max has improved screen uniformity, with only a slight shadow around the notch.
Luminance under various lighting conditions
Readability in an indoor (1000 lux) environment
From left to right: Apple iPhone 15 Pro Max, Apple iPhone 14 Pro Max, Samsung Galaxy S23 Ultra, Honor Magic5 Pro
(Photos for illustrations only)
Readability in an outdoor (20 000 lux) environment
From left to right: Apple iPhone 15 Pro Max, Apple iPhone 14 Pro Max, Samsung Galaxy S23 Ultra, Honor Magic5 Pro
(Photos for illustrations only)
Readability in a sunlight (>90 000 lux) environment
From left to right: Apple iPhone 15 Pro Max, Apple iPhone 14 Pro Max, Samsung Galaxy S23 Ultra, Honor Magic5 Pro
(Photos for illustrations only)
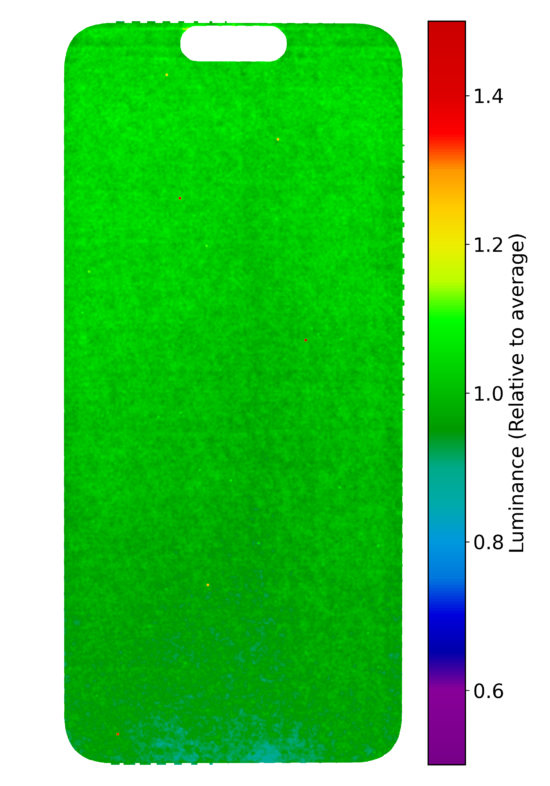
Significant improvement in brightness uniformity, as visible on the graph below. The slight shadow on the sides of the device’s Dynamic Island can be visible on dark backgrounds.
Luminance uniformity measurement
This graph shows the uniformity of the display with a 20% gray pattern. The more visible the green color, the more uniform the display.
Color
139
Google Pixel 8 Pro
Google Pixel 8 Pro
How Display Color score is composed
The color attribute evaluates the capacity of the device to accurately reproduce colors. The measurements taken are for fidelity, white point color, and gamut coverage. We perform color evaluations for different lighting conditions to see how well the device can manage color in the surrounding environment. Colors are measured using a spectrophotometer in a controlled lighting environment. Perceptual analysis of color rendering is against the reference pattern displayed on a calibrated professional monitor.
The iPhone 15 Pro Max was measured with a slightly more saturated default color mode on sRGB content. While photos generally look more appealing and vivid, the saturation under sunlight in high brightness mode can be a bit too strong on faces and skin tones. Of greater impact on photo color rendering is a strong cast that degrades the appearance of skin tones.
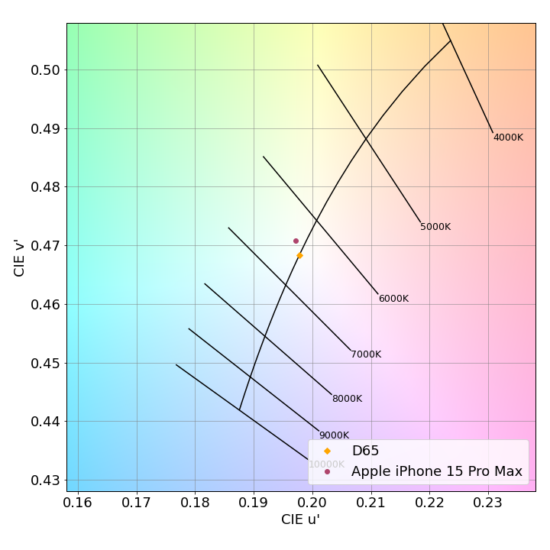
White point under D65 illuminant at 1000 lux
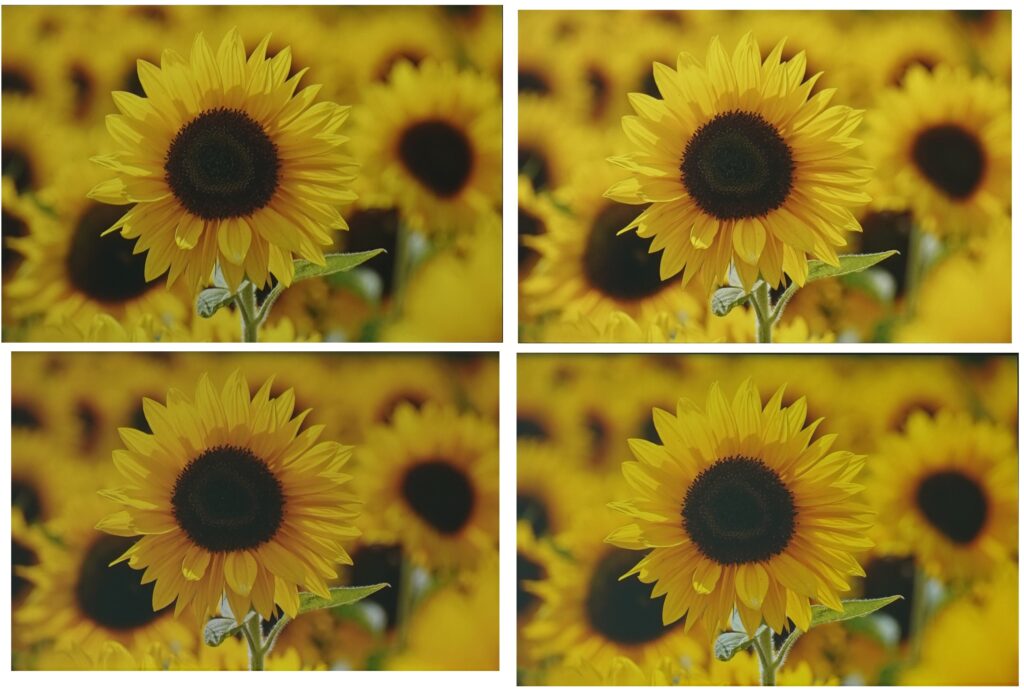
Color rendering indoors (1000 lux)
Clockwise from top left: Apple iPhone 15 Pro Max, Apple iPhone 14 Pro Max, Samsung Galaxy S23 Ultra, Honor Magic5 Pro
(Photos for illustrations only)
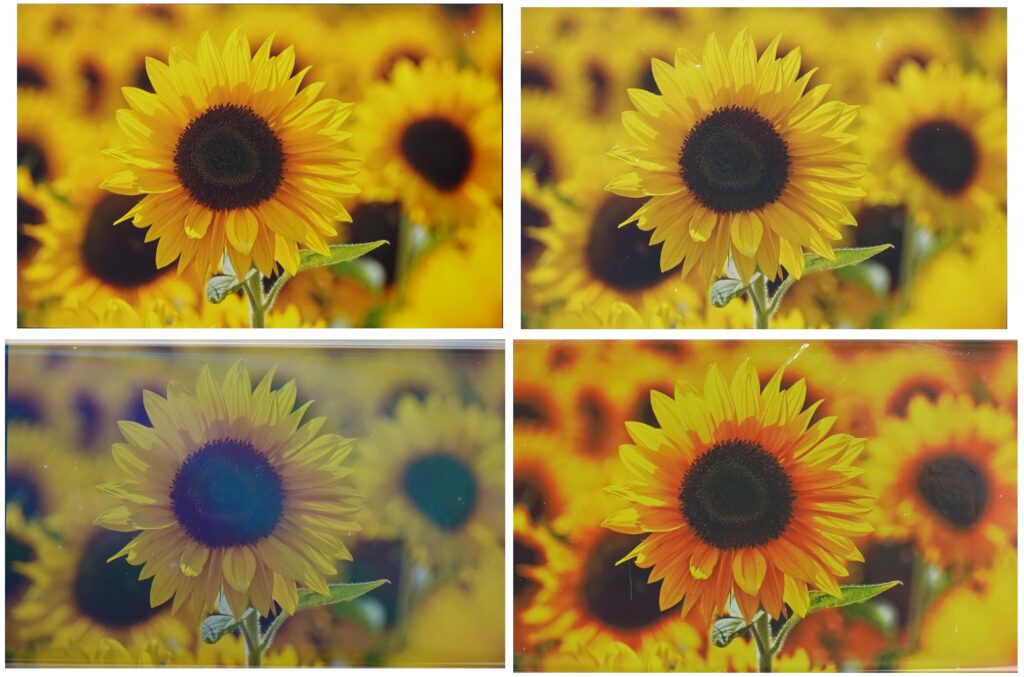
Color rendering in sunlight (>90 000 lux)
Clockwise from top left: Apple iPhone 15 Pro Max, Apple iPhone 14 Pro Max, Samsung Galaxy S23 Ultra, Honor Magic5 Pro
(Photos for illustrations only)
Colors remain faithful under 1000 lux, although Display-P3 content desaturates under intense ambient lighting. On the other hand, sRGB colors appear more saturated under low-light conditions and when High Brightness Mode is activated.
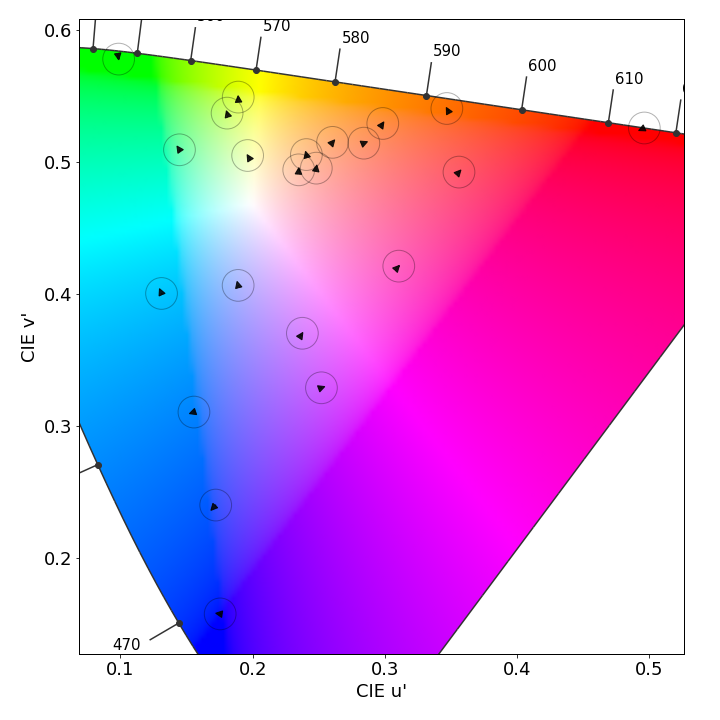
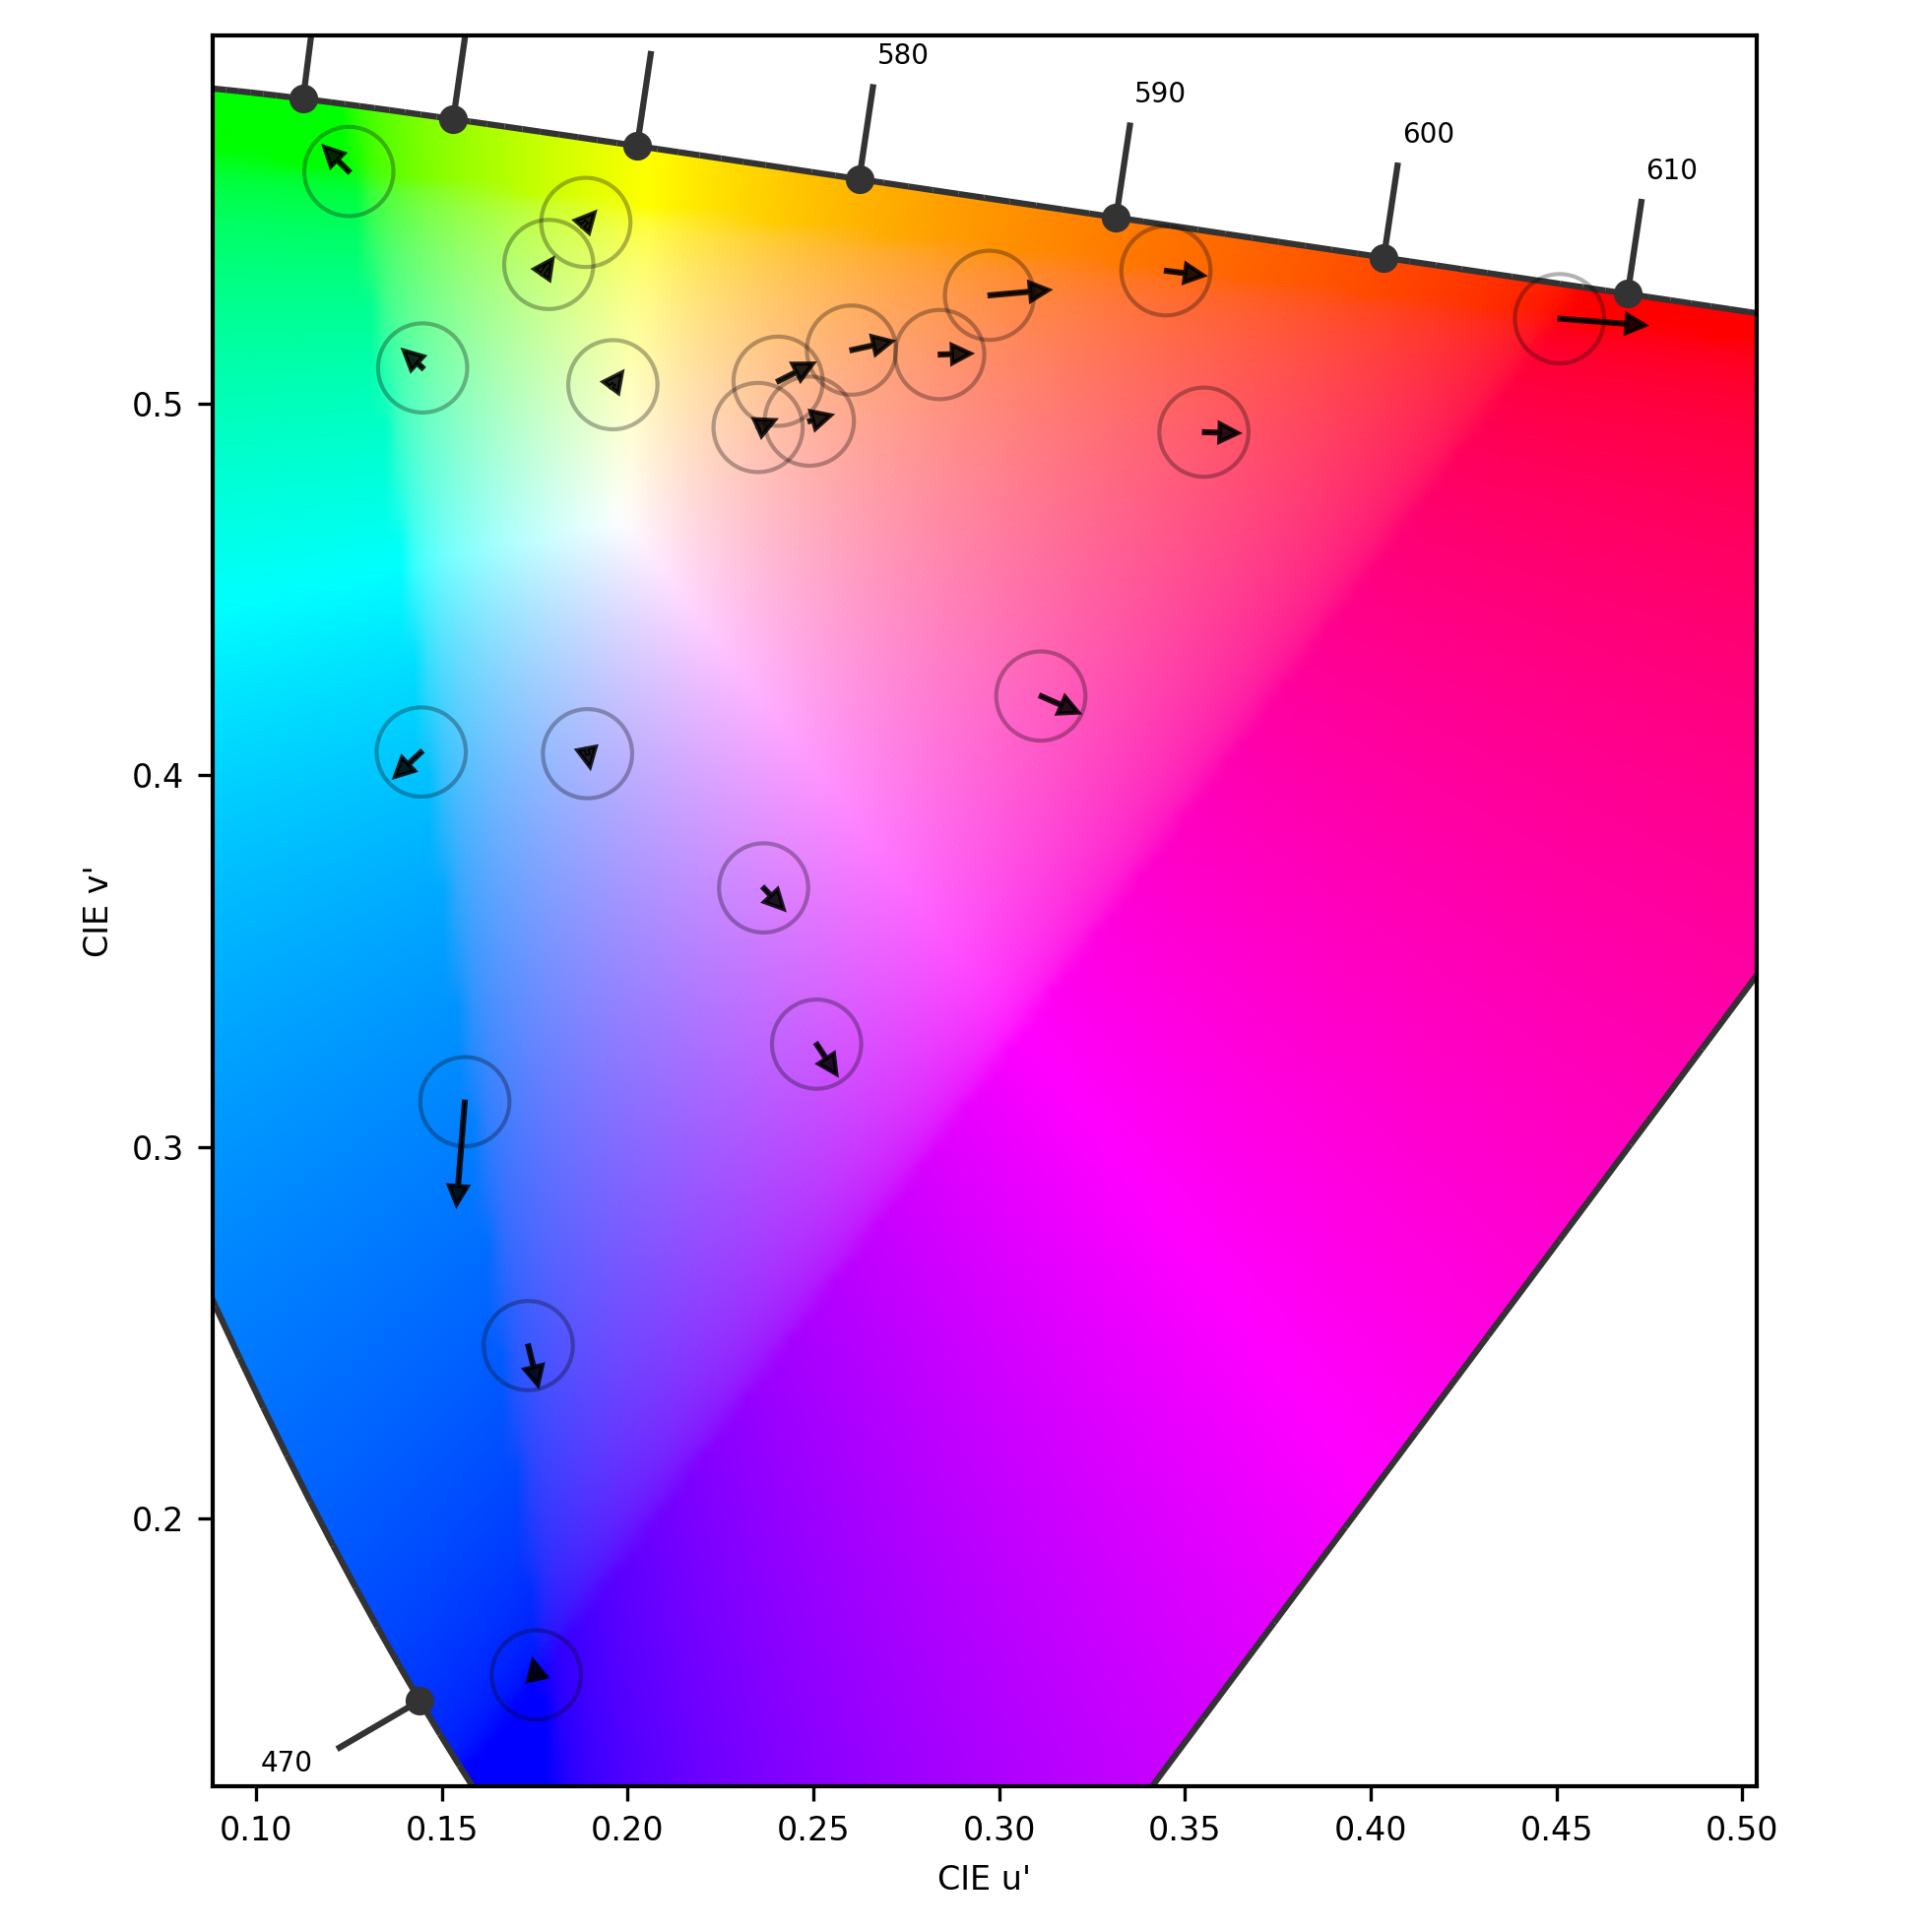
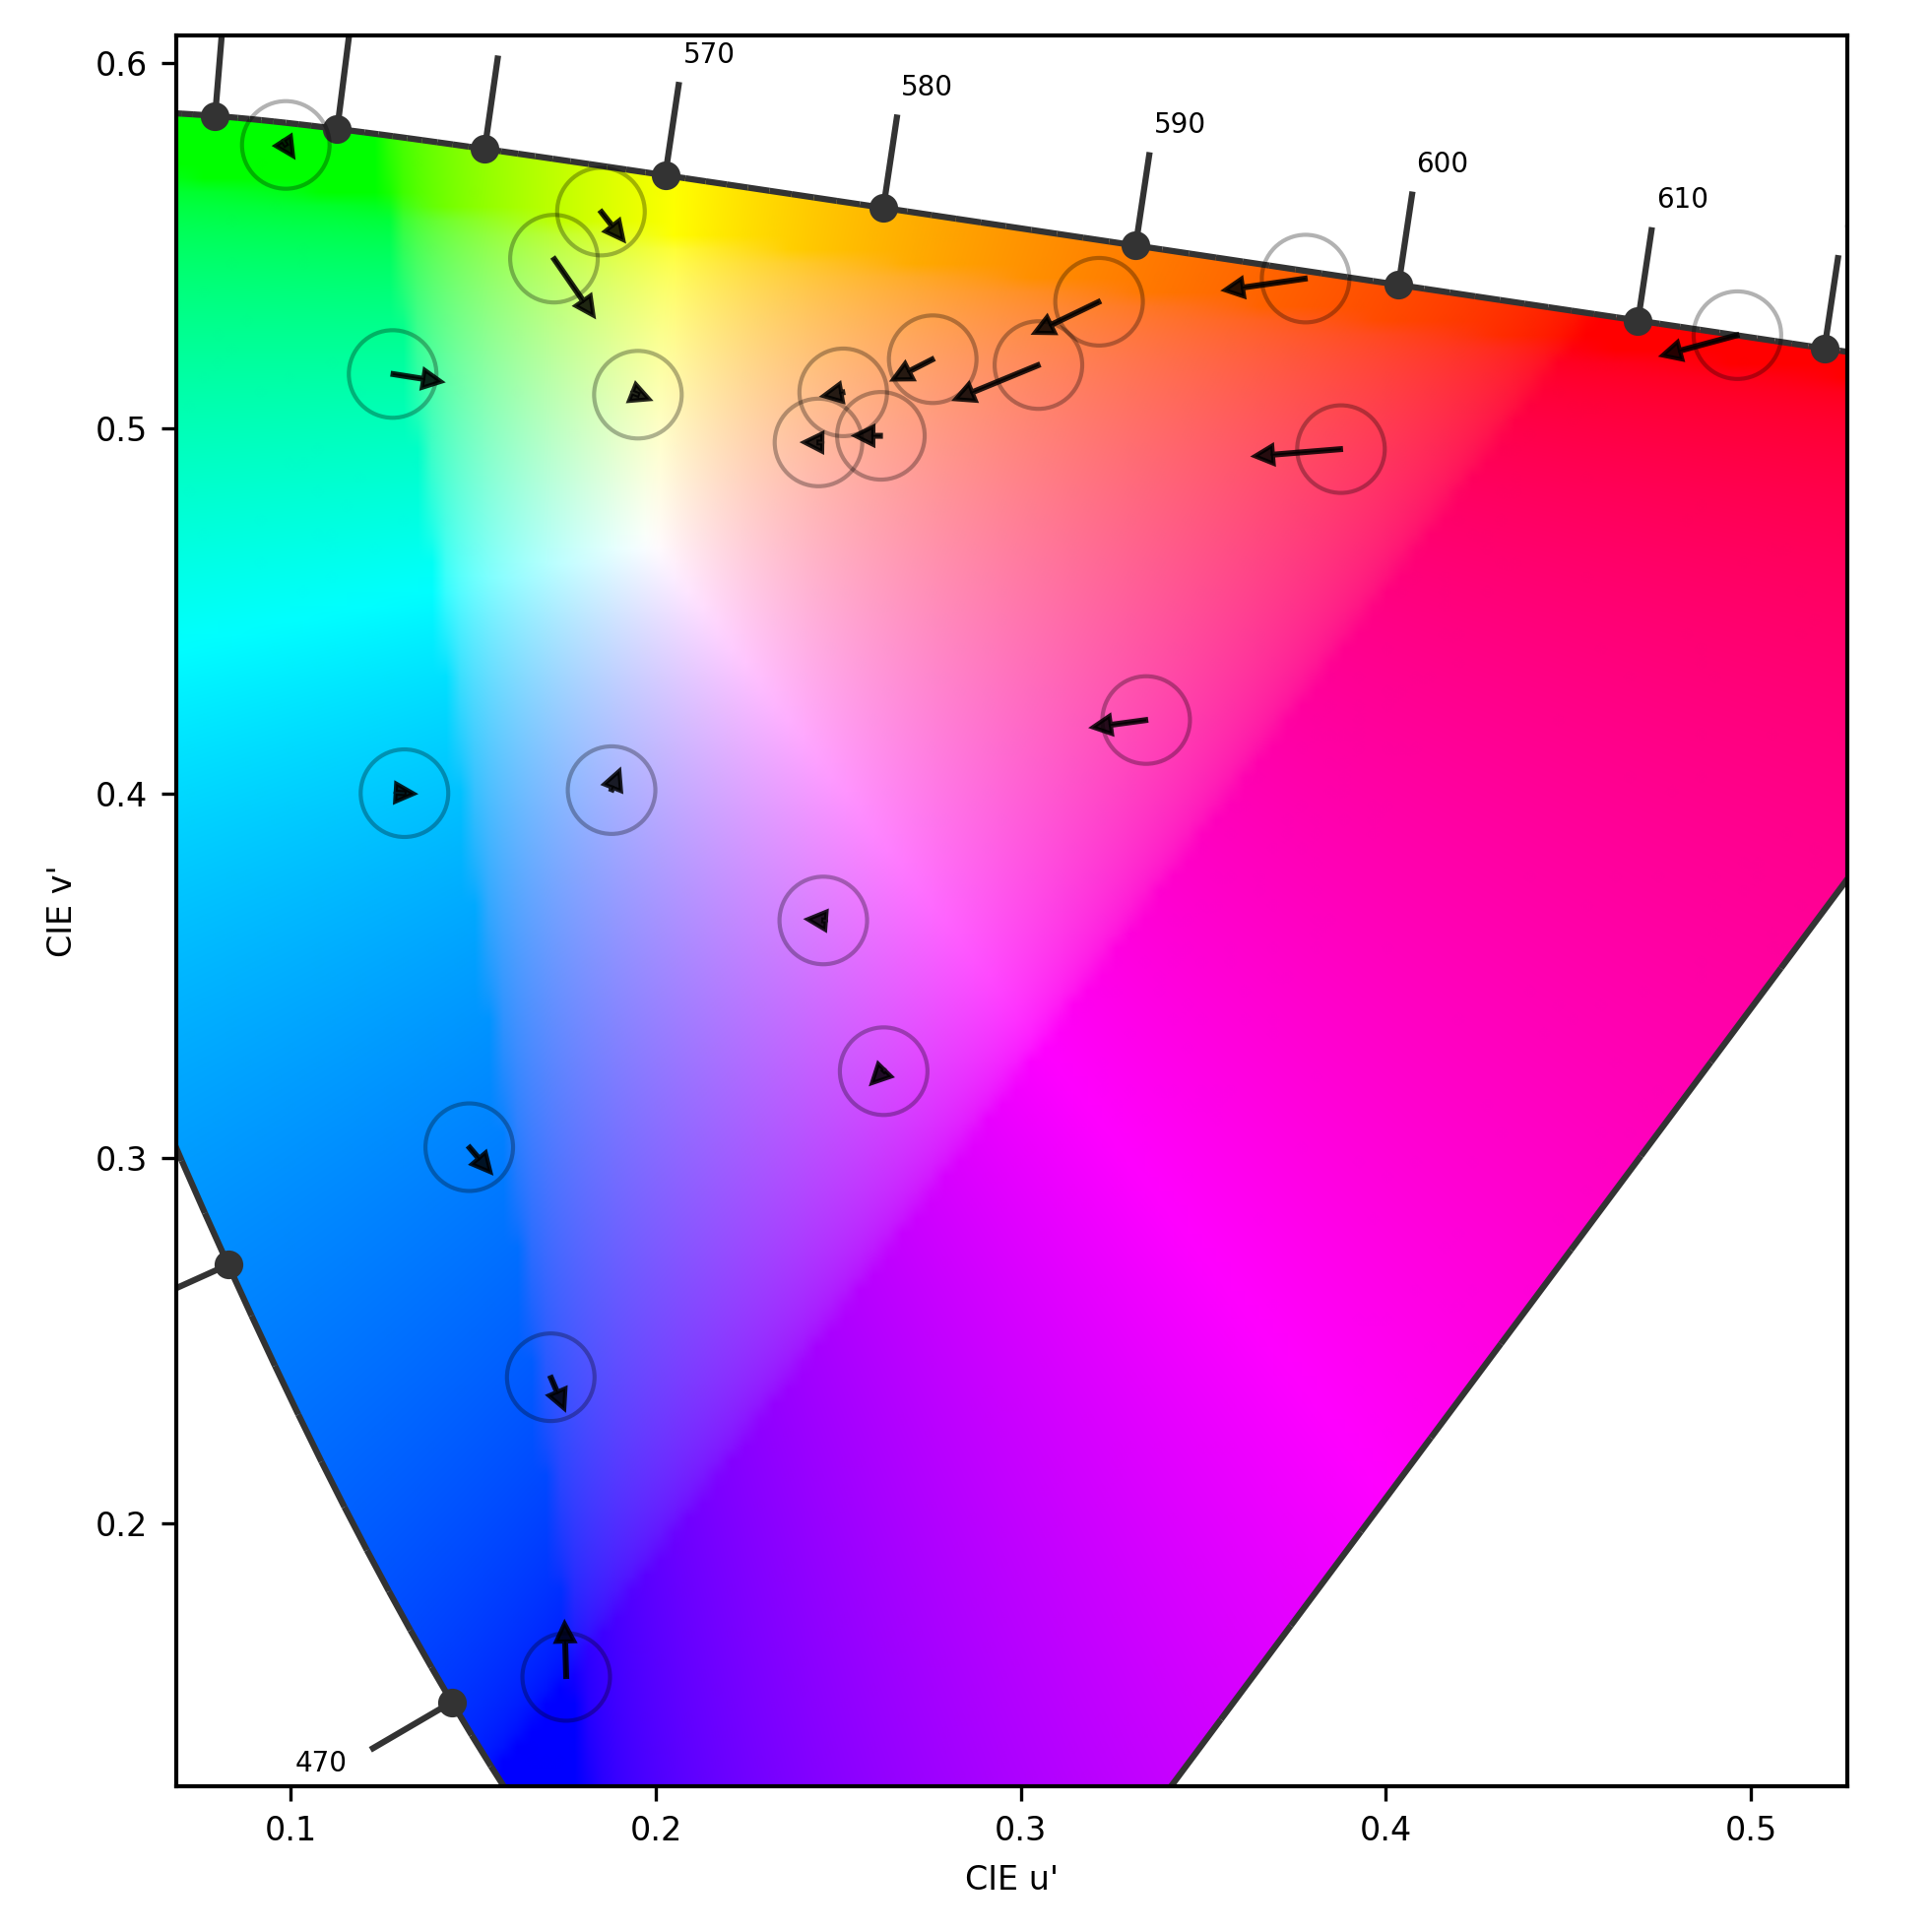
Color fidelity measurements
Apple iPhone 15 Pro Max, color fidelity at 1000 lux in the sRGB color space
Apple iPhone 15 Pro Max, color fidelity at 1000 lux in the Display-P3 color space
Apple iPhone 15 Pro Max, color fidelity at 20000 lux in the sRGB color space
Apple iPhone 15 Pro Max, color fidelity at 20000 lux in the Display-P3 color space
Each arrow represents the color difference between a target color pattern (base of the arrow) and its actual measurement (tip of the arrow). The longer the arrow, the more visible the color difference is. If the arrow stays within the circle, the color difference will be visible only to trained eyes.
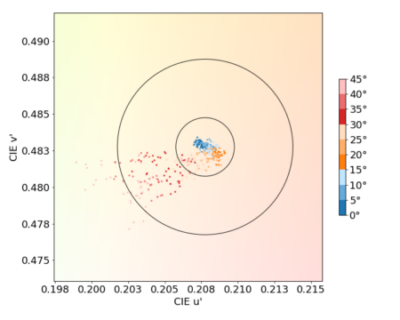
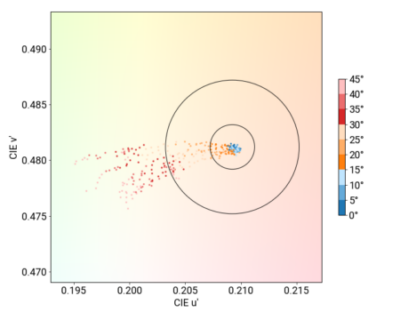
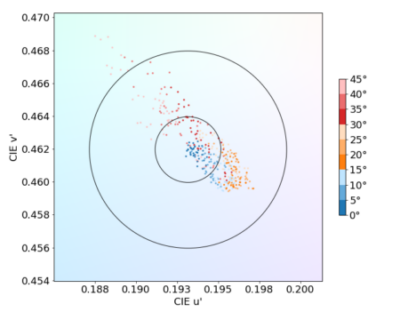
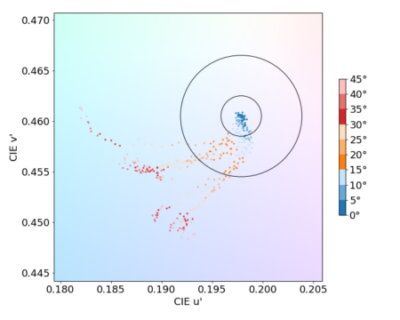
In the charts below showing the angular color shift, you can see that the 15 Pro Max has slightly better color stability at an angle than the 14 Pro Max.
Color behavior on angle
Clockwise from top left: Apple iPhone 15 Pro Max, Apple iPhone 14 Pro Max, Samsung Galaxy S23 Ultra, Honor Magic5 Pro
This graph shows the color shift when the screen is at an angle. Each dot represents a measurement at a particular angle. Dots inside the inner circle exhibit no color shift in angle; those between the inner and outer circle have shifts that only trained experts will see; but those falling outside the outer circle are noticeable.
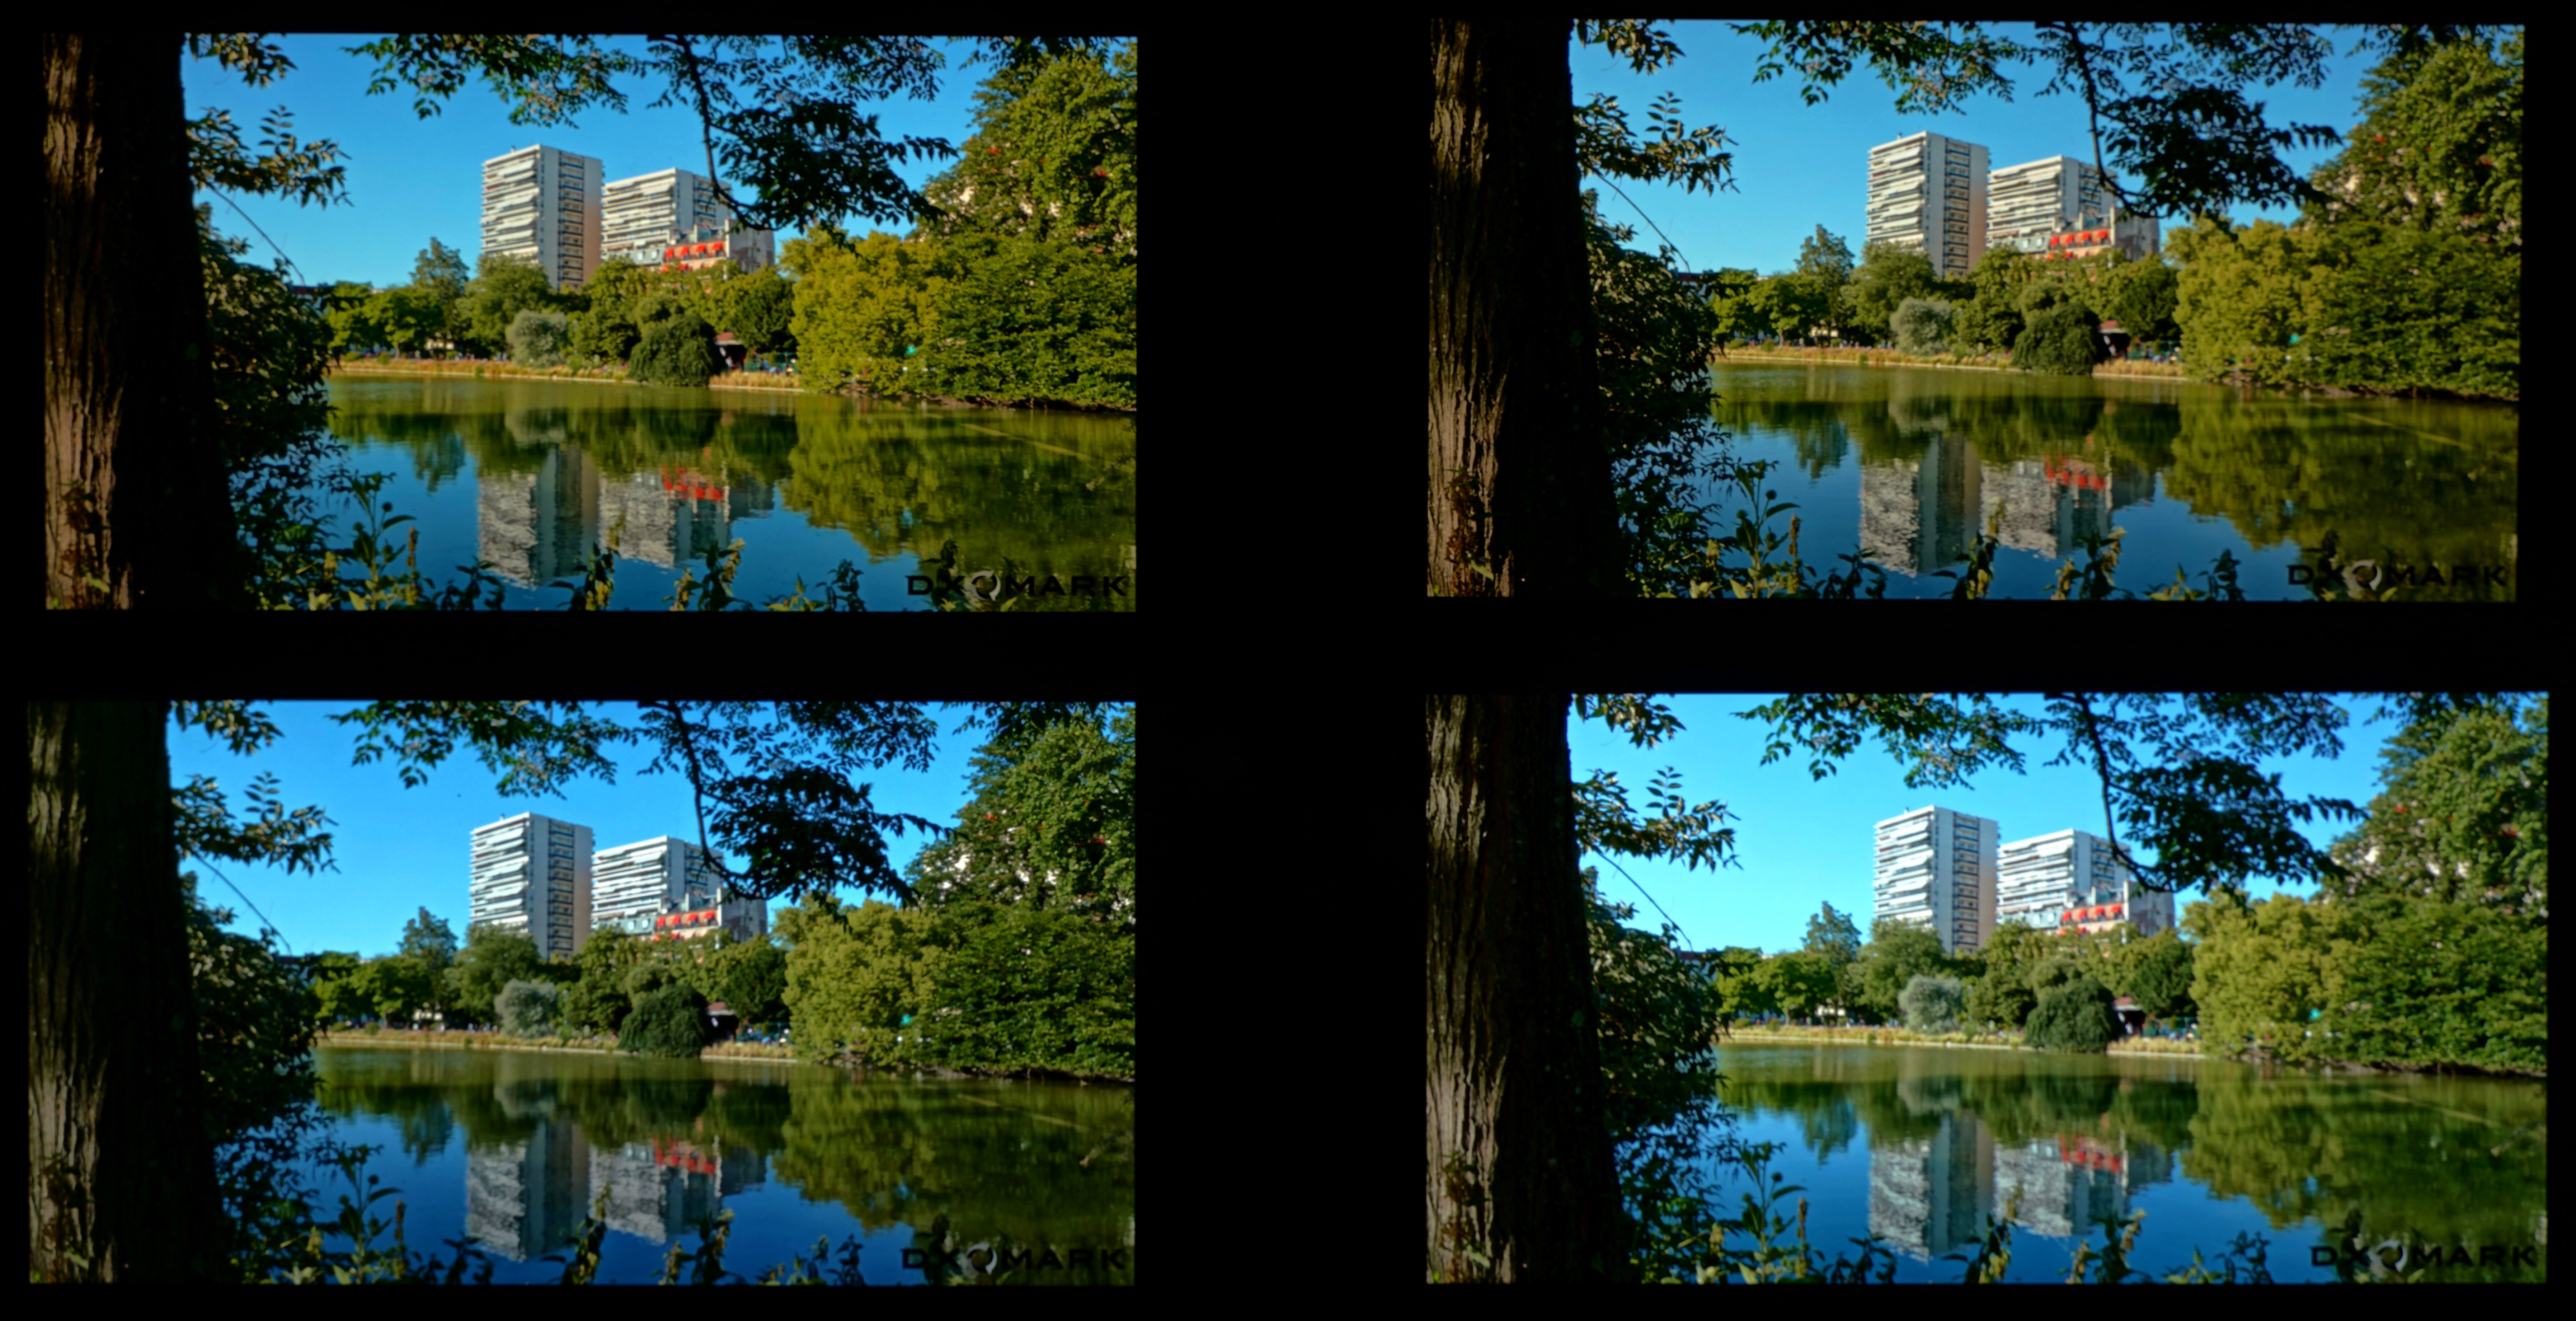
Color shift on angle
From left to right: Apple iPhone 15 Pro Max, Apple iPhone 14 Pro Max, Samsung Galaxy S23 Ultra, Honor Magic5 Pro
(Photos for illustrations only)
Video
147
Samsung Galaxy S23
Samsung Galaxy S23
How Display Video score is composed
Our video attribute evaluates the Standard Dynamic Range (SDR) and High Dynamic Range (HDR10) video handling of each device in indoor and low-light conditions. We measure tone mapping, color gamut, brightness and contrast of the display. We perform perceptual analysis against our professional reference monitor (Sony BVM-HX310) to ensure that the rendering respects the artistic intent.
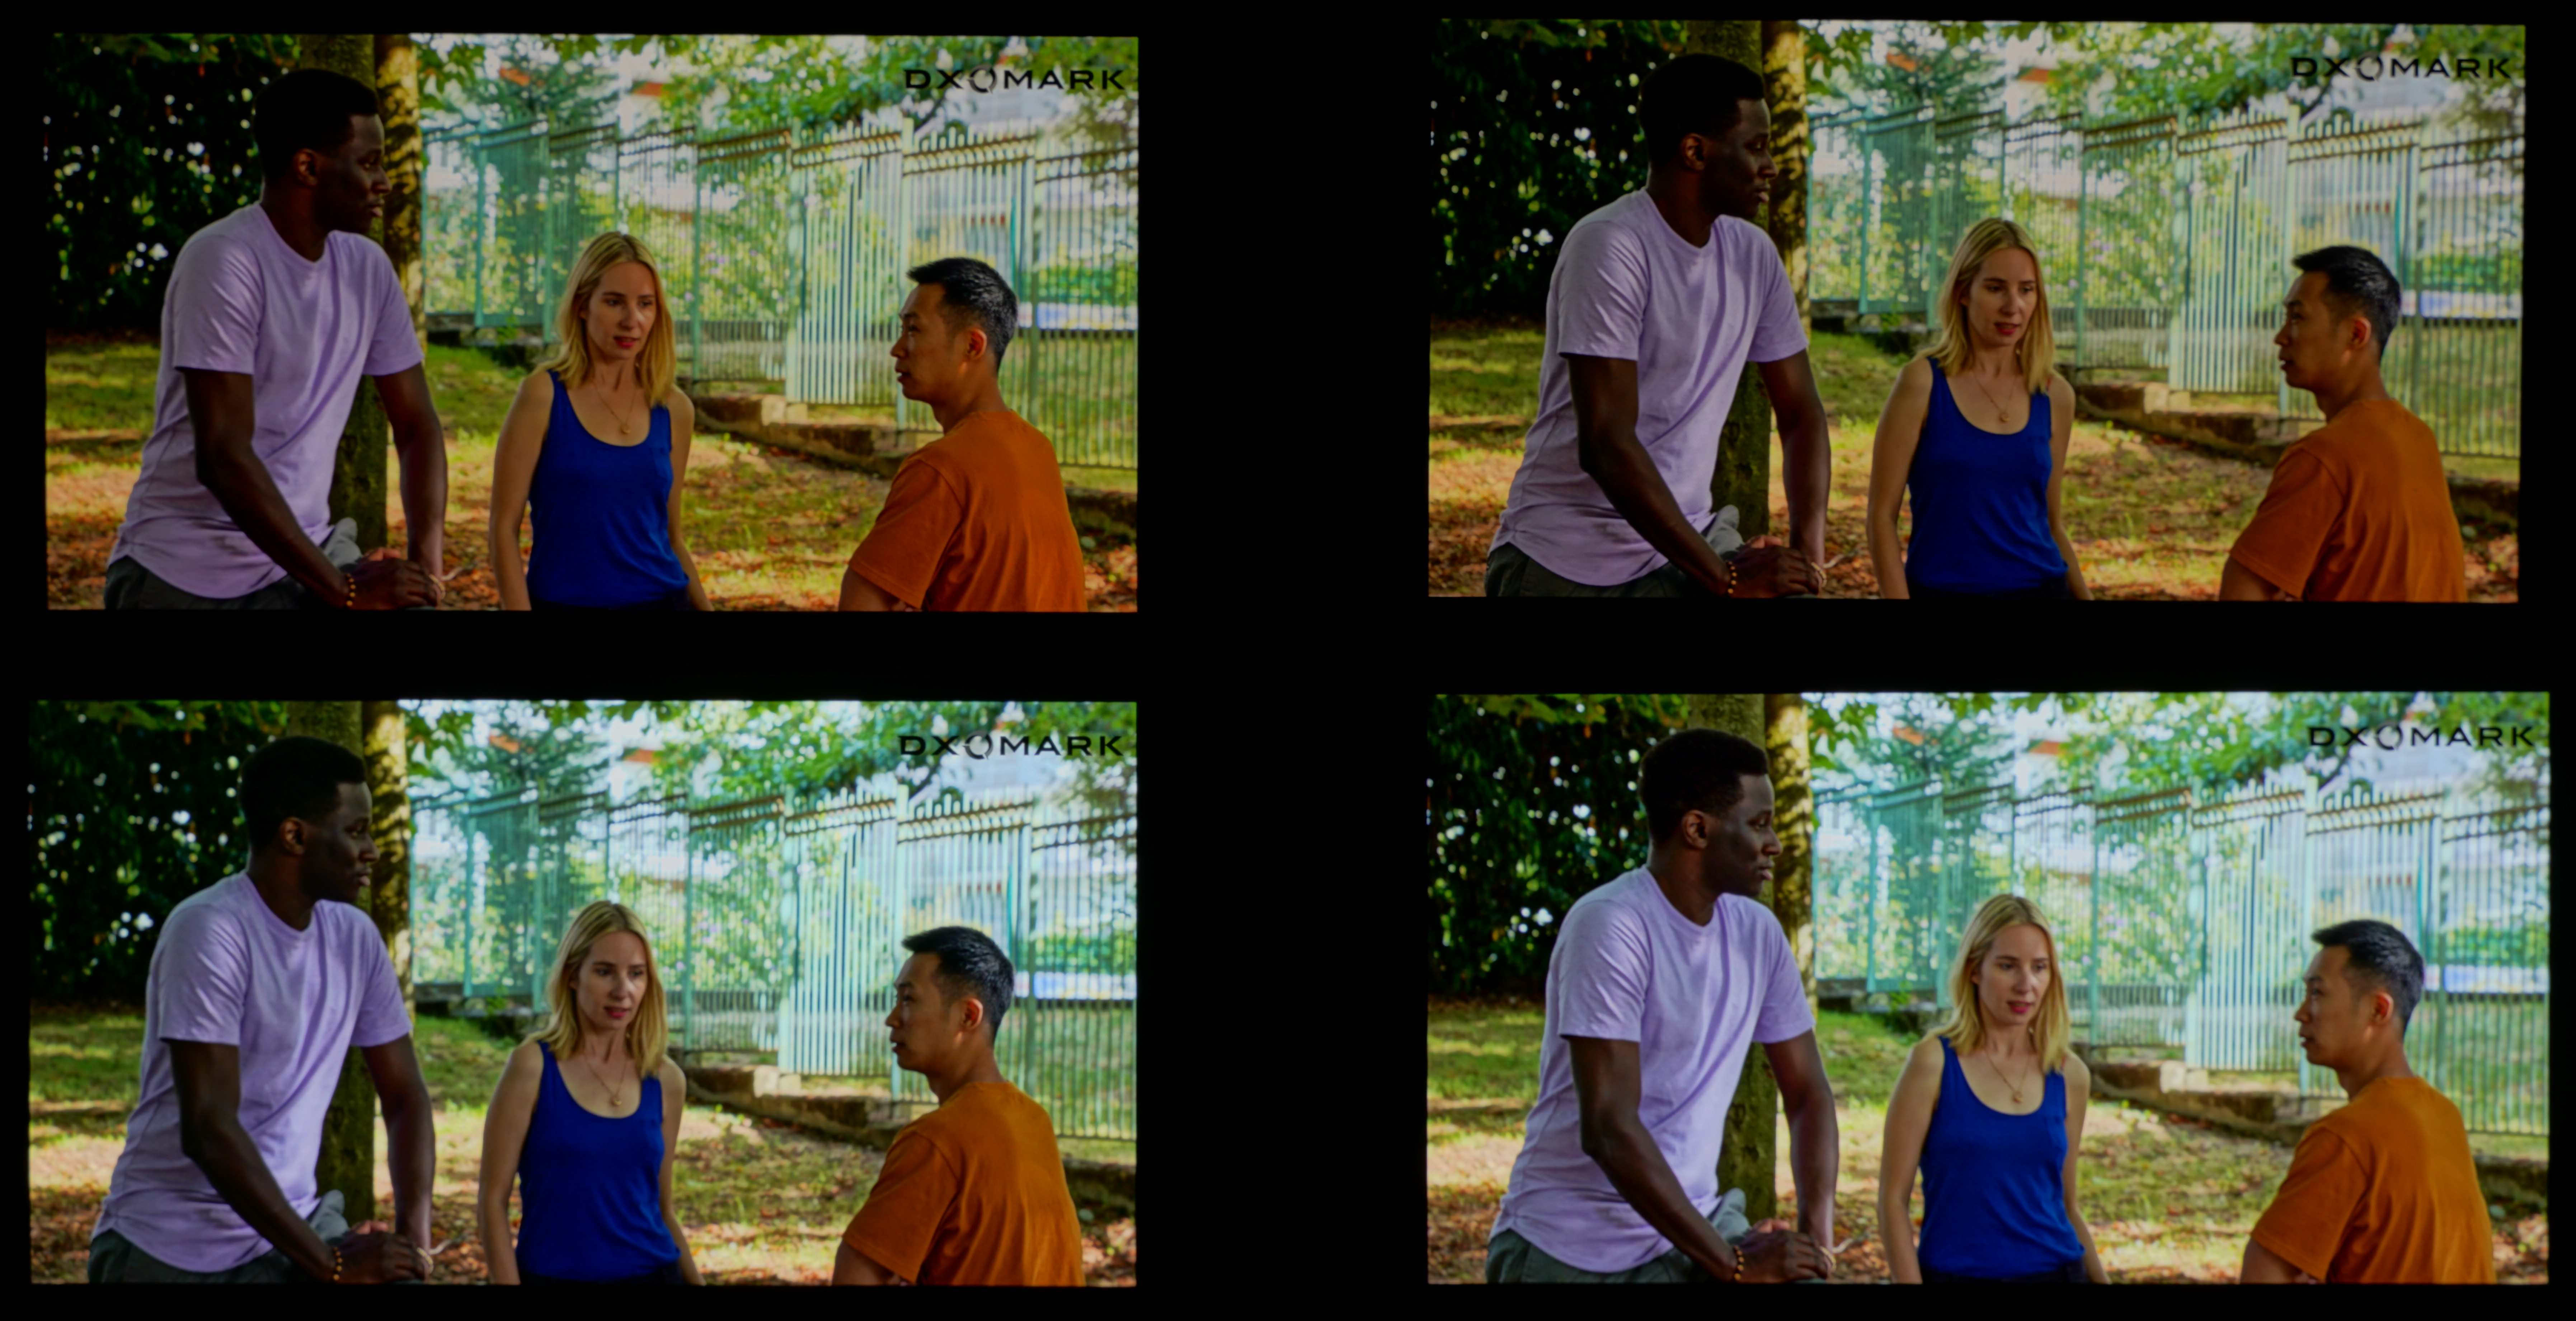
As with its still photo color rendering, the colors in SDR videos on the iPhone 15 Pro Max are more saturated than what is standard under dark lighting conditions, and HDR10 videos have an orange cast that adversely affects the rendering of skin tones. Finally, midtones on the 15 Pro Max have a flatter appearance than on the 14 Pro Max.
Video brightness at 10% APL in the dark ( < 5 lux)
Video rendering in a low-light (0 lux) environment
Clockwise from top left: Apple iPhone 15 Pro Max, Apple iPhone 14 Pro Max, Samsung Galaxy S23 Ultra, Honor Magic5 Pro
(Photos for illustrations only)
Clockwise from top left: Apple iPhone 15 Pro Max, Apple iPhone 14 Pro Max, Samsung Galaxy S23 Ultra, Honor Magic5 Pro
(Photos for illustrations only)
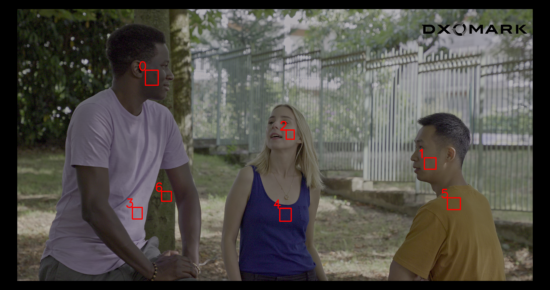
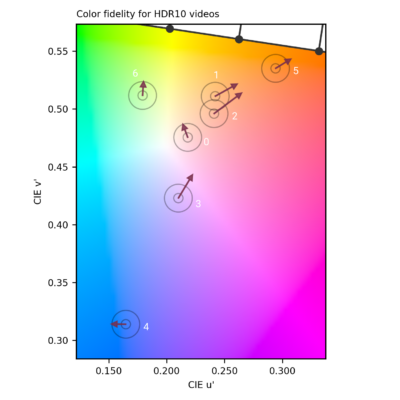
As illustrated in the following graphs, we compared the video color renderings of the iPhone 15 Pro Max and iPhone 14 Pro Max to our professional reference monitor. Note how the arrow in region 2 on the chart extends further toward orange on the newer device, confirming the cast our experts perceived.
Video color difference of iPhones in a low-light (0 lux) environment
Top: region of interest measured on the video
Bottom, from left to right: Apple iPhone 15 Pro Max and Apple iPhone 14 Pro Max results
Each arrow represents the color difference between the color measured on our reference monitor (base of the arrow) and its actual measurement on the devices (tip of the arrow). The longer the arrow, the more visible the color difference is. If the arrow stays within the circle, the color difference will be visible only to trained eyes.
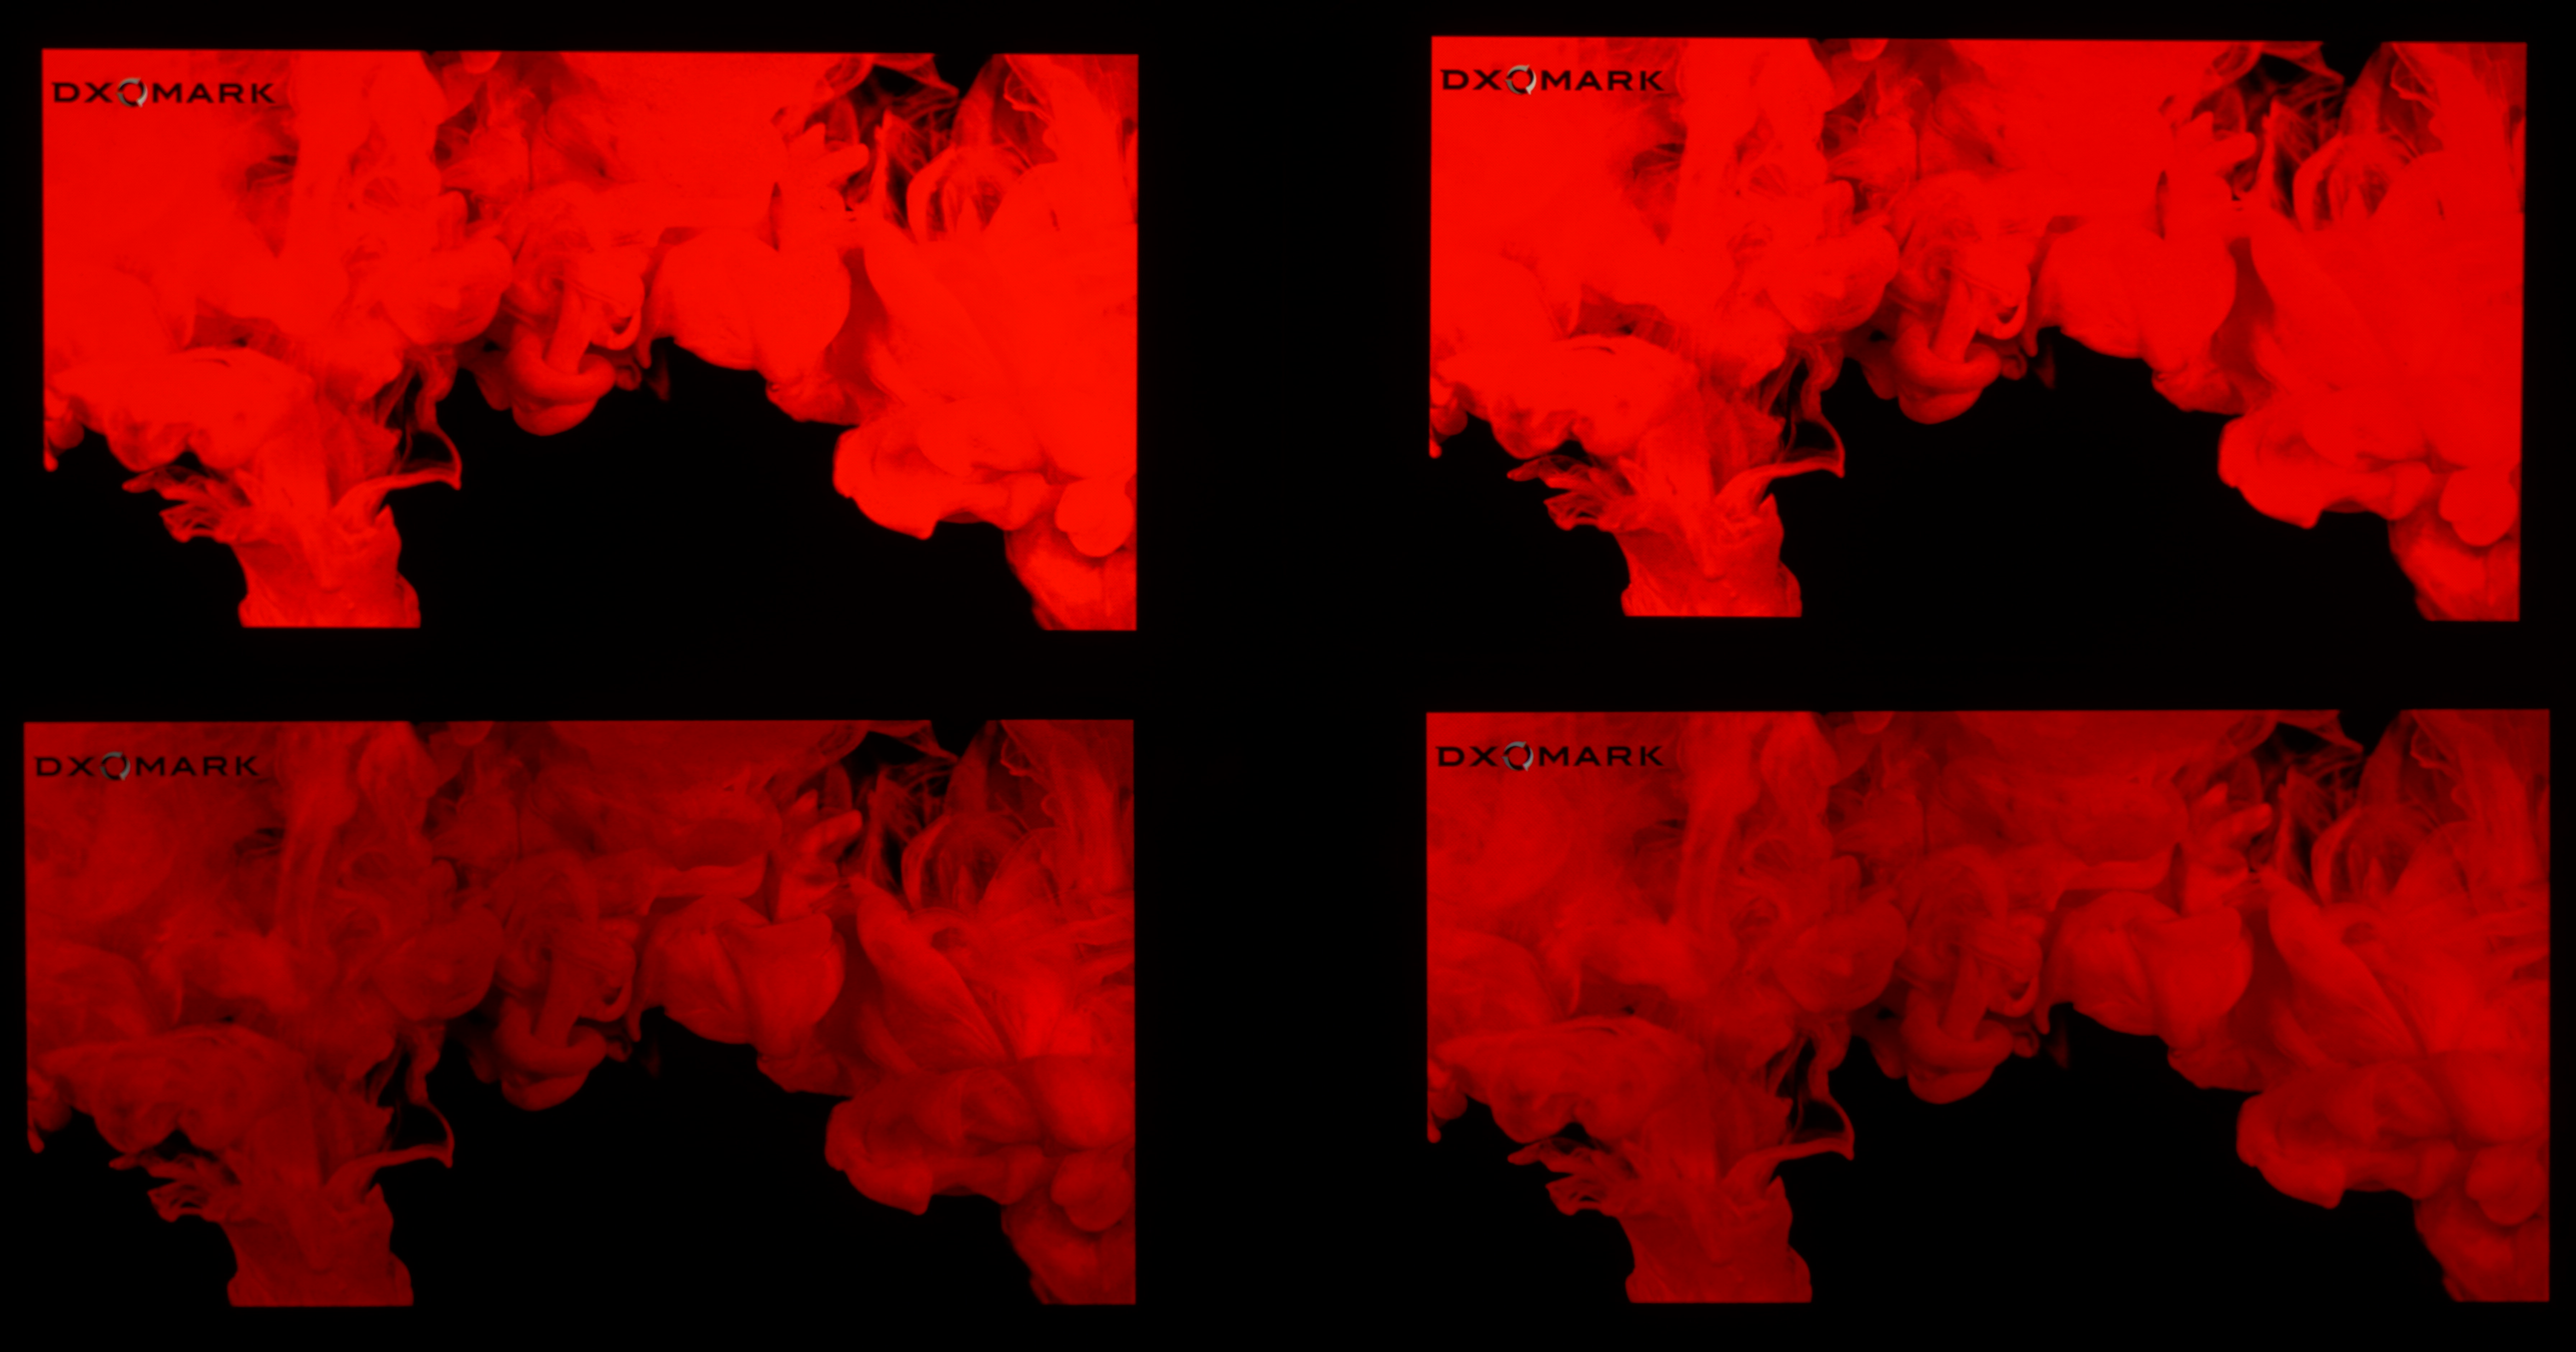
In the illustration below, you can see that the Apple devices struggle to render details in the red shades. This kind of effect can occur when playing certain HDR videos.
Clockwise from top left: Apple iPhone 15 Pro Max, Apple iPhone 14 Pro Max, Samsung Galaxy S23 Ultra, Honor Magic5 Pro
(Photos for illustrations only)
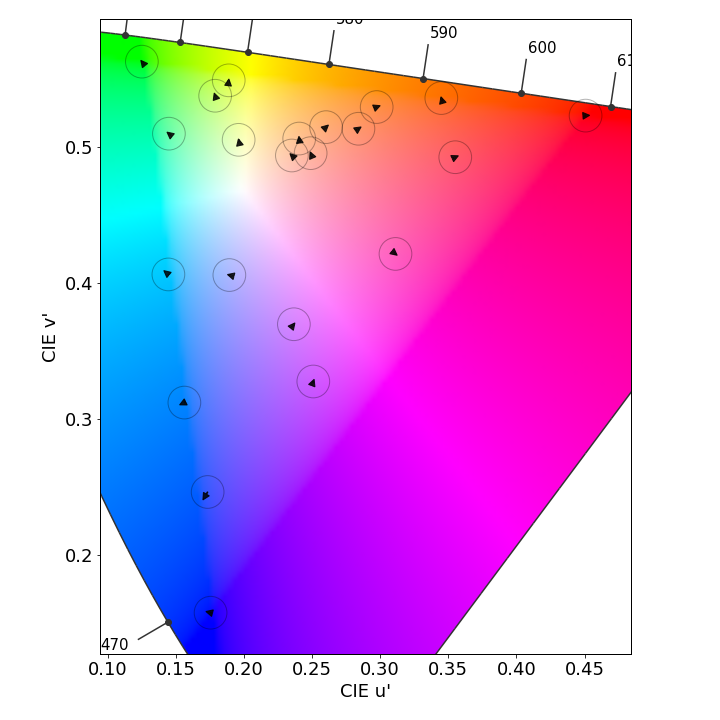
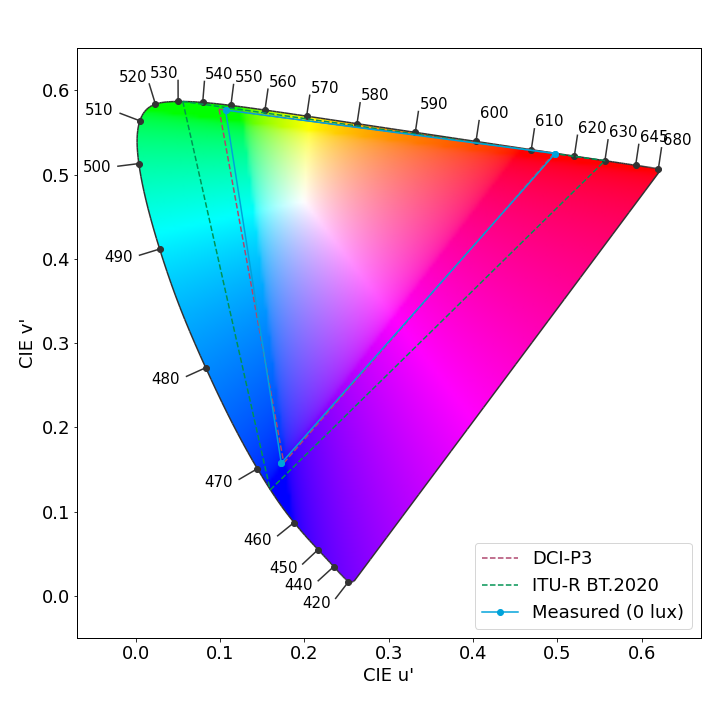
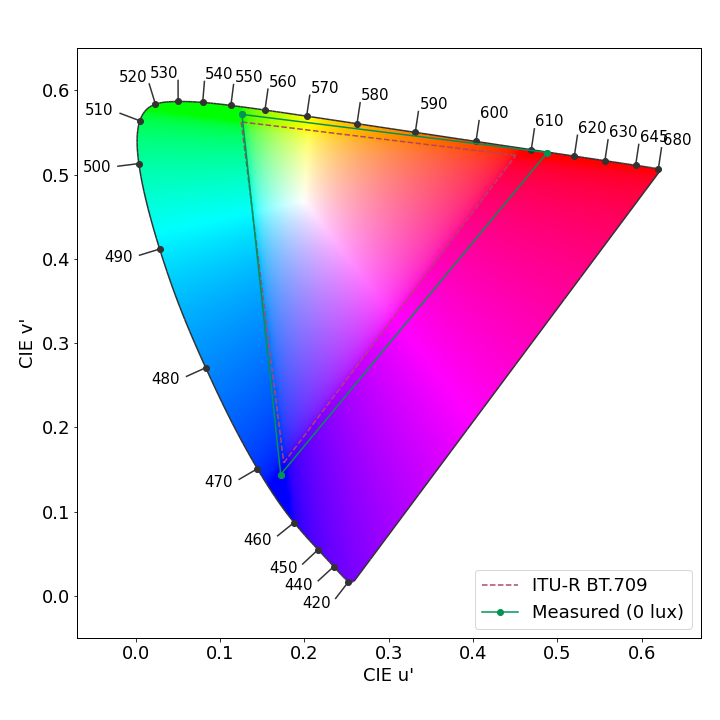
The 15 Pro Max’s color gamut for SDR video is larger than the standard BT.709, thus indicating more saturated reds and greens.
Gamut coverage for video content
The primary colors are measured both in HDR10 and SDR. The extracted color gamut shows the extent of the color area that the device can render. To respect the artistic intent, the measured gamut should match the master color space of each video.
Motion
151
Honor Magic6 Pro
Honor Magic6 Pro
How Display Motion score is composed
The motion attribute evaluates the handling of dynamic contents. Frame drops, motion blur, and playback artifacts are scrutinized using games and videos.
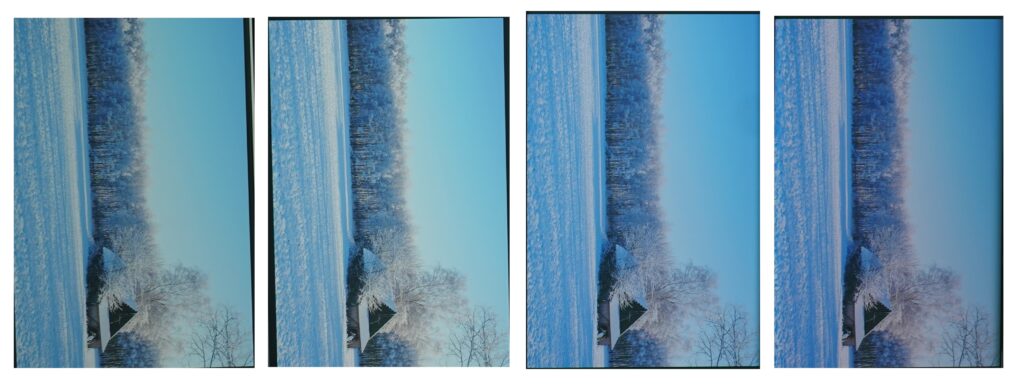
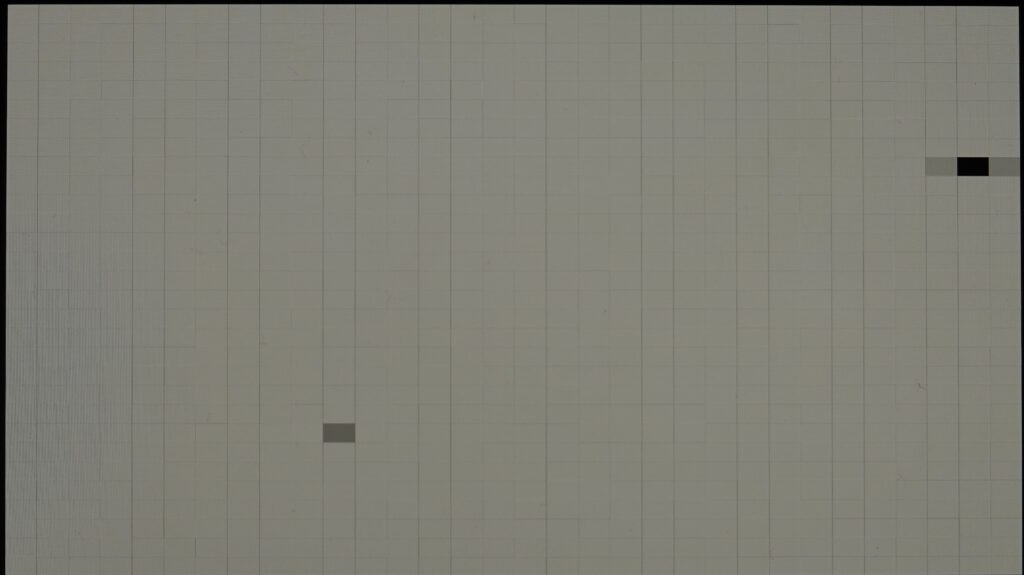
The iPhone 15 Pro Max achieved an almost perfect frame drop performance, with one or no frame drops in video playback. However, our experts spotted a few frame mismatches when playing video games.
Video frame drops
These long exposure photos present the number of frame irregularities in a 30-second video. A good performance shows a regular pattern (either a flat gray image or a pull-down pattern).
Touch
142
Samsung Galaxy S24+ (Exynos)
Samsung Galaxy S24+ (Exynos)
How Display Touch score is composed
To evaluate touch, DXOMARK uses a touch robot and a high-speed camera to play and record a set of scenarios for smoothness, accuracy and response-time evaluation.
The iPhone 15 Pro Max’s performance for touch was identical to that of the iPhone 14 Pro Max, with high reactivity and smooth interaction. The reactivity of most flagships measures around 60 ms to 70 ms, and in that regard, the iPhone 15 Pro Max is no exception. As for smoothness, we noticed that the tested games were still locked at 60 fps, but it is likely the case that game developers have not yet adapted those games to match the capabilities of the iOS platform.
Average Touch Response Time Apple iPhone 15 Pro Max
This response time test precisely evaluates the time elapsed between a single touch of the robot on the screen and the displayed action. This test is applied to activities that require high reactivity, such as gaming.
Artifacts
140
OnePlus Open
OnePlus Open
How Display Artifacts score is composed
Evaluating artifacts means checking for the performance, image rendering and motion flaws that can affect the end-user experience. DXOMARK measures precisely the device’s reflectance and the presence of flicker, and assesses the impact of residual aliasing when playing video games, among other characteristics.
With an improved screen-to-body-ratio, slightly better performance in reflectance ratio, and good control of aliasing in video games, the iPhone 15 Pro Max came in several points ahead of the iPhone 14 Pro Max in managing artifacts. However, both Apple devices still lag behind several other competitors in this category, notably some phones from Huawei and Xiaomi, particularly in terms of flicker frequency, which is still low.
Average Reflectance (SCI) Apple iPhone 15 Pro Max
SCI stands for Specular Component Included, which measures both the diffuse reflection and the specular reflection. Reflection from a simple glass sheet is around 4%, while it reaches about 6% for a plastic sheet. Although smartphones’ first surface is made of glass, their total reflection (without coating) is usually around 5% due to multiple reflections created by the complex optical stack.
Reflectance (SCI)
Measurements above show the reflection of the device within the visible spectrum range (400 nm to 700 nm). It includes both diffuse and specular reflection.
PWM Frequency Apple iPhone 15 Pro Max
240 Hz
Bad
Good
Bad
Great
Pulse width modulation is a modulation technique that generates variable-width pulses to represent the amplitude of an analog input signal. This measurement is important for comfort because flickering at low frequencies can be perceived by some individuals, and in the most extreme cases, can induce seizures. Some experiments show that discomfort can appear at a higher frequency. A high PWM frequency (>1500 Hz) tends to be less disturbing for users.
Temporal Light Modulation
This graph represents the frequencies of lighting variation; the highest peak gives the main flicker frequency. The combination of a low frequency and a high peak is susceptible to inducing eye fatigue. Displays flicker for 2 main reasons: refresh rate and Pulse Width Modulation. This measurement is important for comfort because flickering at low frequencies can be perceived by some individuals, and in the most extreme cases, can induce seizures. Some experiments show that discomfort can appear at a higher frequency. A high PWM frequency (>1500 Hz) tends to be safer for users.
Aliasing (closeup)
Apple iPhone 15 Pro Max
(Photos for illustrations only)
Apple iPhone 15 Pro Max – Crop 1
Apple iPhone 15 Pro Max – Crop 2
Apple iPhone 15 Pro Max – Crop 3


DXOMARK encourages its readers to share comments on the articles. To read or post comments, Disqus cookies are required. Change your Cookies Preferences and read more about our Comment Policy.