We put the Apple iPhone 15 Pro Max through our rigorous DXOMARK Display test suite to measure its performance across four criteria. In this test results, we will break down how it fared in a variety of tests and several common use cases.
Overview
Key display specifications:
- 6.7 inches AMOLED Retina XDR
- Dimensions: 159.9 x 76.7 x 8.25 mm (6.30 x 3.02 x 0.32 inches)
- Resolution: 1290 x 2796 pixels, (~460 ppi density)
- Aspect ratio: none
- Refresh rate: 120 Hz
Scoring
Sub-scores and attributes included in the calculations of the global score.
 Apple iPhone 15 Pro Max

151
display
144
Samsung Galaxy S24 Ultra
Best: Samsung Galaxy S24 Ultra (164)
156
Google Pixel 8
Best: Google Pixel 8 (165)
154
Samsung Galaxy S25 Ultra
Best: Samsung Galaxy S25 Ultra (167)
157
Google Pixel 7 Pro
Best: Google Pixel 7 Pro (164)
Position in Global Ranking

20
th
1. Samsung Galaxy S25 Ultra
160
2. Samsung Galaxy S25 Edge
158
9. Samsung Galaxy S24 Ultra
155
11. Samsung Galaxy Z Fold6
154
11. Samsung Galaxy S24+ (Exynos)
154
11. Samsung Galaxy S24 (Exynos)
154
18. Google Pixel 9 Pro Fold
152
20. Apple iPhone 15 Pro Max
151
25. Apple iPhone 16 Pro Max
150
25. Samsung Galaxy Z Flip6
150
33. Samsung Galaxy S23 Ultra
148
39. Samsung Galaxy A55 5G
147
42. Apple iPhone 14 Pro Max
146
44. Samsung Galaxy S24 FE
145
48. Samsung Galaxy Z Flip5
144
50. Asus Zenfone 11 Ultra
143
50. Samsung Galaxy A35 5G
143
55. Apple iPhone 13 Pro Max
142
55. Samsung Galaxy Z Fold5
142
61. Samsung Galaxy S23 FE
140
66. Xiaomi Redmi Note 14 Pro+ 5G
139
67. Honor Magic4 Ultimate
138
78. Samsung Galaxy S22 Ultra (Snapdragon)
135
78. Xiaomi Redmi Note 13 Pro Plus 5G
135
83. Samsung Galaxy S22+ (Exynos)
134
86. Samsung Galaxy Z Flip4
133
86. Samsung Galaxy S22 Ultra (Exynos)
133
86. Samsung Galaxy S22 (Snapdragon)
133
86. Vivo X80 Pro (MediaTek)
133
91. Samsung Galaxy S22 (Exynos)
132
96. Samsung Galaxy S21 Ultra 5G (Exynos)
131
96. Vivo X80 Pro (Snapdragon)
131
100. Apple iPhone 13 mini
130
100. Samsung Galaxy Z Fold4
130
100. Samsung Galaxy S21 Ultra 5G (Snapdragon)
130
100. Samsung Galaxy S21 FE 5G (Snapdragon)
130
111. Samsung Galaxy A54 5G
129
115. Apple iPhone 12 Pro Max
127
119. Vivo X60 Pro 5G (Snapdragon)
126
136. Motorola Edge 30 Pro
123
140. Apple iPhone 11 Pro Max
122
140. Motorola Edge 40 Pro
122
144. Apple iPhone SE (2022)
120
150. Samsung Galaxy A52 5G
114
152. Motorola Razr 40 Ultra
113
155. Crosscall Stellar-X5
109
156. Samsung Galaxy A53 5G
108
160. Crosscall Stellar-M6
101
163. Samsung Galaxy A22 5G
82
Position in Ultra-Premium Ranking
15
th
1. Samsung Galaxy S25 Ultra
160
2. Samsung Galaxy S25 Edge
158
7. Samsung Galaxy S24 Ultra
155
8. Samsung Galaxy Z Fold6
154
8. Samsung Galaxy S24+ (Exynos)
154
13. Google Pixel 9 Pro Fold
152
15. Apple iPhone 15 Pro Max
151
19. Apple iPhone 16 Pro Max
150
19. Samsung Galaxy Z Flip6
150
24. Samsung Galaxy S23 Ultra
148
31. Apple iPhone 14 Pro Max
146
35. Samsung Galaxy Z Flip5
144
37. Asus Zenfone 11 Ultra
143
40. Apple iPhone 13 Pro Max
142
40. Samsung Galaxy Z Fold5
142
46. Honor Magic4 Ultimate
138
53. Samsung Galaxy S22 Ultra (Snapdragon)
135
55. Samsung Galaxy S22+ (Exynos)
134
57. Samsung Galaxy Z Flip4
133
57. Samsung Galaxy S22 Ultra (Exynos)
133
57. Vivo X80 Pro (MediaTek)
133
64. Samsung Galaxy S21 Ultra 5G (Exynos)
131
64. Vivo X80 Pro (Snapdragon)
131
68. Samsung Galaxy Z Fold4
130
68. Samsung Galaxy S21 Ultra 5G (Snapdragon)
130
76. Apple iPhone 12 Pro Max
127
89. Apple iPhone 11 Pro Max
122
91. Motorola Razr 40 Ultra
113
Pros
- Readable in most tested conditions, including outdoors
- More vivid colors in photos
- Strong frame drop performance
Cons
- A strong orange cast impacts color rendering and skin tones in photos and videos when True Tone is activated
- HDR10 videos lack contrast in midtones compared to its predecessor
The Apple iPhone 15 Pro Max display performance stood out in the video, color, and touch categories. The device’s readability was above average, held back due to low brightness in low light and a strong drop in luminance when outdoors.
The Apple iPhone 15 Pro Max was readable in most conditions, including outdoors, with an impressive 2260 nits measured on a 20% average picture level (APL) white pattern. However, brightness dropped drastically at higher APLs, reaching only 1100 nits at 80% APL (similar to web page APL), meaning the device is more suited for viewing photos than web pages outdoors. Further, the 15 Pro Max is still tuned for only 2 nits in low-light conditions; although this is suitable for a middle-of-the-night kind of environment, users may need to manually adjust the brightness in other conditions. The 15 Pro Max has improved screen uniformity, with only a slight shadow on the sides of the device’s Dynamic Island that can be visible on dark backgrounds.
The device’s colors without True Tone were natural under 830 lux, although Display-P3 content desaturates under intense ambient lighting. On the other hand, sRGB colors appear more saturated under low-light conditions and when High Brightness Mode is activated.
When held at an angle, the 15 Pro Max’s colors remained quite stable.
In video, the device adapted its peak and overall brightness in low-light and indoor conditions very well to provide a satisfying HDR10 experience. Contrast, as seen with the tone curve, was generally well-managed in indoor viewing conditions, although dark details could be slightly too bright in low-light conditions. The screen had low brightness, however, when viewing in SDR indoors and in low light.
As with its still photo color rendering, the colors in SDR videos on the iPhone 15 Pro Max were more saturated than what is standard under dark lighting conditions, and HDR10 videos had an orange cast that adversely affected the rendering of skin tones only when True Tone was on. Finally, midtones on the 15 Pro Max had a flatter appearance than on the 14 Pro Max.
The iPhone 15 Pro Max achieved an almost perfect frame drop performance, with one or no frame drops in video playback.
The iPhone 15 Pro Max’s performance for touch was identical to that of the iPhone 14 Pro Max, with high reactivity and smooth interaction. The reactivity of most flagships measures around 60 ms to 70 ms, and in that regard, the iPhone 15 Pro Max is no exception.
Test summary
About DXOMARK Display tests: For scoring and analysis, a device undergoes a series of objective and perceptual tests in controlled lab and real-life conditions. The DXOMARK Display score takes into account the overall user experience the screen provides, considering the hardware capacity and the software tuning. In testing, only factory-installed video and photo apps are used. More in-depth details about how DXOMARK tests displays are available in the article “A closer look at DXOMARK Display testing.”
The following section focuses on the key elements of our exhaustive tests and analyses performed in DXOMARK laboratories. Full reports with detailed performance evaluations are available upon request. To order a copy, please contact us.
Readability
144
Samsung Galaxy S24 Ultra
Samsung Galaxy S24 Ultra
How Display Readability score is composed
Readability evaluates the user’s ease and comfort of viewing still content, such as photos or a web page, on the display under different lighting conditions. Our measurements run in the labs are completed by perceptual testing and analysis.
Luminance under various lighting conditions
This graph shows the screen luminance in environments that range from total darkness to outdoor conditions. In our labs, the indoor environment (250 lux to 830 lux) simulates the artificial and natural lighting conditions commonly seen in homes (with medium diffusion); the outdoor environment (from 20,000 lux) replicates a situation with highly diffused light.
Contrast under various lighting conditions
This graph shows the screen’s contrast levels in lighting environments that range from total darkness to outdoor conditions. In our labs, the indoor environment (250 lux to 830 lux) simulates the artificial and natural lighting conditions commonly seen in homes (with medium diffusion); the outdoor environment (from 20,000 lux) replicates a situation with highly diffused light.
Photo EOTF
The Electro-Optical Transfer Function (EOTF) defines how bits are converted into luminance out of the display. Gray levels (horizontal axis) represent the different shades from pure white (100% gray level) to pitch black (0% gray level). The standard for still images follows a 2.2 gamma. The flatter the curves, the harder it is to perceive differences between consecutive shades. This phenomenon is more frequent under intensive lighting conditions (20,000 lux) in the low gray level regions.
Luminance vs Viewing Angle
This graph presents how the luminance drops as viewing angles increase.
Readability in an indoor (1000 lux) environment
From left to right: Apple iPhone 15 Pro Max, Apple iPhone 14 Pro Max, Samsung Galaxy S23 Ultra, Honor Magic5 Pro
(Photos for illustration only)
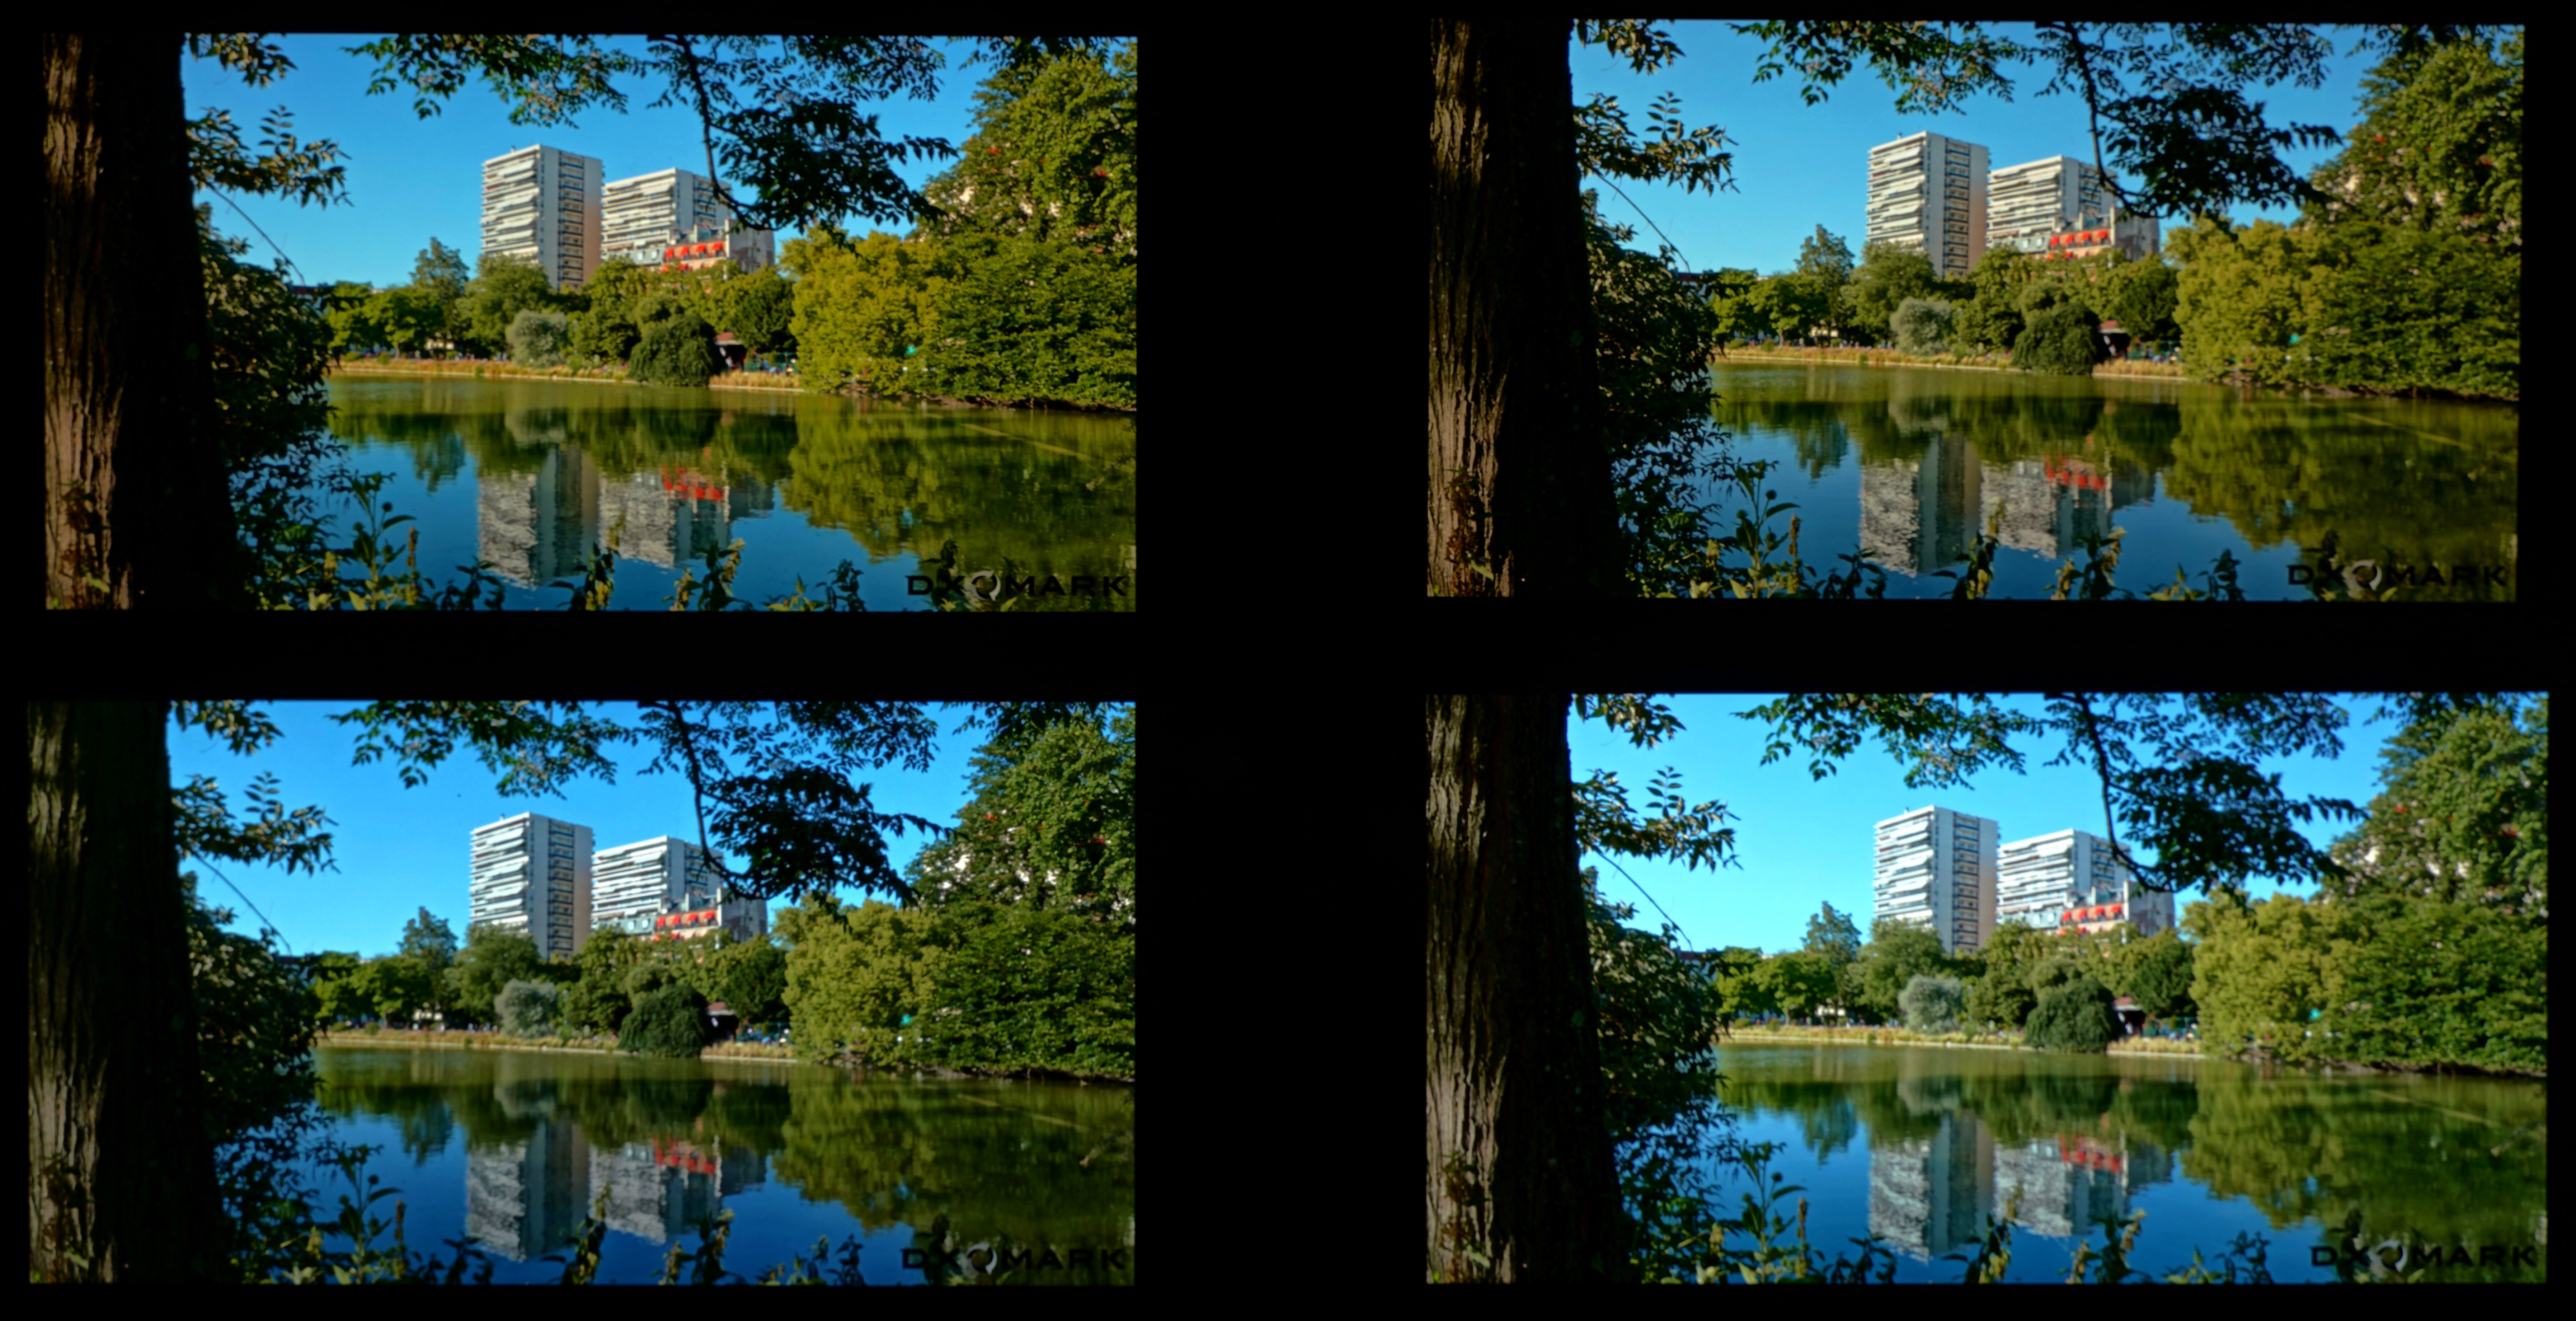
Readability in an outdoor (20 000 lux) environment
From left to right: Apple iPhone 15 Pro Max, Apple iPhone 14 Pro Max, Samsung Galaxy S23 Ultra, Honor Magic5 Pro
(Photos for illustration only)
Readability in a sunlight (>90 000 lux) environment
From left to right: Apple iPhone 15 Pro Max, Apple iPhone 14 Pro Max, Samsung Galaxy S23 Ultra, Honor Magic5 Pro
(Photos for illustration only)
Average Reflectance (SCI) Apple iPhone 15 Pro Max
Apple iPhone 15 Pro Max
Samsung Galaxy S24 Ultra
Honor Magic6 Pro
SCI stands for Specular Component Included, which measures both the diffuse reflection and the specular reflection. Reflection from a simple glass sheet is around 4%, while it reaches about 6% for a plastic sheet. Although smartphones’ first surface is made of glass, their total reflection (without coating) is usually around 5% due to multiple reflections created by the complex optical stack.
Average reflectance is computed based on the spectral reflectance in the visible spectrum range (see graph below) and human spectral sensitivity.
Reflectance (SCI)
Wavelength (horizontal axis) defines light color, but also our capacity to see it; for example, UV is a very low wavelength that the human eye cannot see; Infrared is a high wavelength that the human eye also cannot see). White light is composed of all wavelengths between 400 nm and 700 nm, i.e. the range the human eye can see. Measurements above show the reflection of the devices within the visible spectrum range (400 nm to 700 nm).
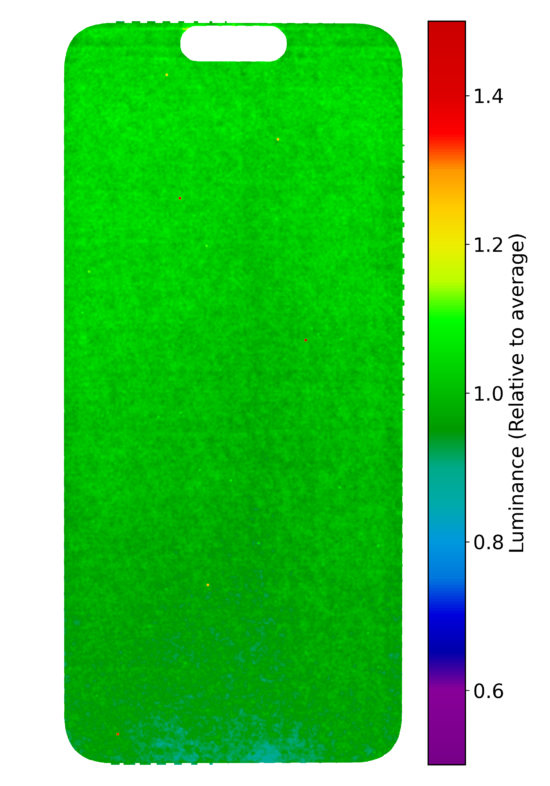
Uniformity
This graph shows the distribution of luminance throughout the entire display panel. Uniformity is measured with a 20% gray pattern, with bright green indicating ideal luminance. An evenly spread-out bright green color on the screen indicates that the display’s brightness is uniform. Other colors indicate a loss of uniformity.
PWM Frequency Apple iPhone 15 Pro Max
240 Hz
Bad
Good
Bad
Great
Apple iPhone 15 Pro Max
Samsung Galaxy S24 Ultra
Honor Magic6 Pro
Pulse width modulation is a modulation technique that generates variable-width pulses to represent the amplitude of an analog input signal. This measurement is important for comfort because flickering at low frequencies can be perceived by some individuals, and in the most extreme cases, can induce seizures. Some experiments show that discomfort can appear at a higher frequency. A high PWM frequency (>1500 Hz) tends to be less disturbing for users.
Temporal Light Modulation
This graph represents the frequencies of lighting variation; the highest peak gives the most important modulation. The combination of a low frequency and a high peak is susceptible to inducing eye fatigue.
Color
156
Google Pixel 8
Google Pixel 8
How Display Color score is composed
Color evaluations are performed in different lighting conditions to see how well the device manages color with the surrounding environment. Devices are tested with sRGB and Display-P3 image patterns. Both faithful mode and default mode are used for our evaluation. Our measurements run in the labs are completed by perceptual testing & analysis.
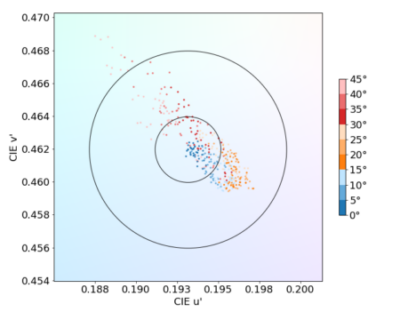
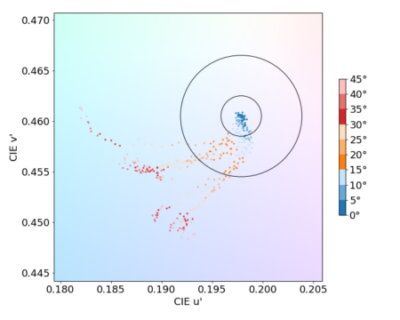
White point color under D65 illuminant at 830 lux
This graph shows the white point coordinates for the image pattern using the default or the faithful mode. D65 illuminant (6500 Kelvin) is a standard that defines the color of white at midday; it is used for display calibration as a white reference, therefore devices are expected to be at or close to the D65 white point.
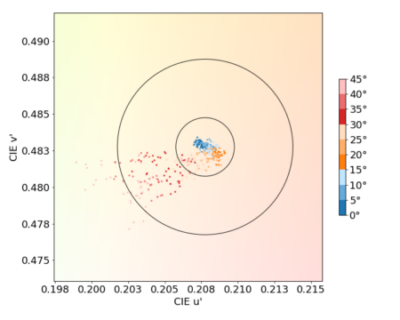
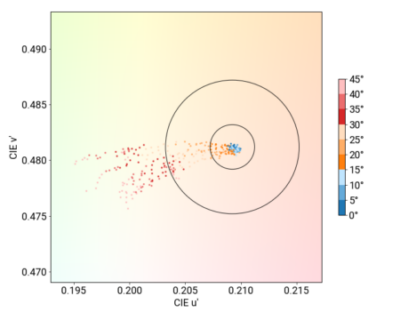
Color fidelity
Each arrow represents the color difference between a target color pattern (base of the arrow) and its actual measurement (tip of the arrow). The longer the arrow, the more visible the color difference is. If the arrow stays within the circle, the color difference will be visible only to trained eyes. The tested color mode is the most faithful proposed by each device, and a color correction is applied to account for the different white points of each device.
Color behavior on angle
Clockwise from top left: Apple iPhone 15 Pro Max, Apple iPhone 14 Pro Max, Samsung Galaxy S23 Ultra, Honor Magic5 Pro
Circadian Action Factor Apple iPhone 15 Pro Max
Apple iPhone 15 Pro Max
Samsung Galaxy S24 Ultra
Honor Magic6 Pro
The circadian action factor is a metric that defines how light impacts the human sleep cycle. It is the ratio of the light energy contributing to sleep disturbances (centered around 450 nm, representing blue light) over the light energy contributing to our perception (covering 400 nm to 700 nm and centered on 550 nm, which is green light). A high circadian action factor means that the ambient light contains strong blue-light energy and is likely to affect the body’s sleep cycle, while a low circadian action factor implies the light has weak blue-light energy and is less likely to affect sleeping patterns.
Spectrum of white emission with Night mode ON
Spectrum measurements of a white web page with BLF mode on and off. This graph shows the impact of blue light filtering on the whole spectrum. All other settings used are default, in particular, the luminance level follows the auto-brightness adaptation from the manufacturer.
The wavelength (horizontal axis) defines light color but also the capacity to see it. For example, UV, which has a very low wavelength, and infra-red, which has a high wavelength, are both not visible to the human eye. White light is composed of all wavelengths between 400 nm and 700 nm, which is the range visible to the human eye.
Spectrum of white emission with Night mode OFF
Spectrum measurements of a white web page with BLF mode on and off. This graph shows the impact of blue light filtering on the whole spectrum. All other settings used are default, in particular, the luminance level follows the auto-brightness adaptation from the manufacturer.
The wavelength (horizontal axis) defines light color but also the capacity to see it. For example, UV, which has a very low wavelength, and infra-red, which has a high wavelength, are both not visible to the human eye. White light is composed of all wavelengths between 400 nm and 700 nm, which is the range visible to the human eye.
Video
154
Samsung Galaxy S25 Ultra
Samsung Galaxy S25 Ultra
How Display Video score is composed
The video attribute evaluates the Standard Dynamic Range (SDR) and High Dynamic Range (HDR10) video handling in indoor and low-light conditions . Our measurements run in the labs are completed by perceptual testing and analysis.
Video peak luminance vs Lighting conditions
This bar chart presents the peak luminance measured for SDR and HDR10 content on a 10% window white pattern.
Video peak luminance vs Lighting conditions
This bar chart presents the peak luminance measured for SDR and HDR10 content on a 10% window white pattern.
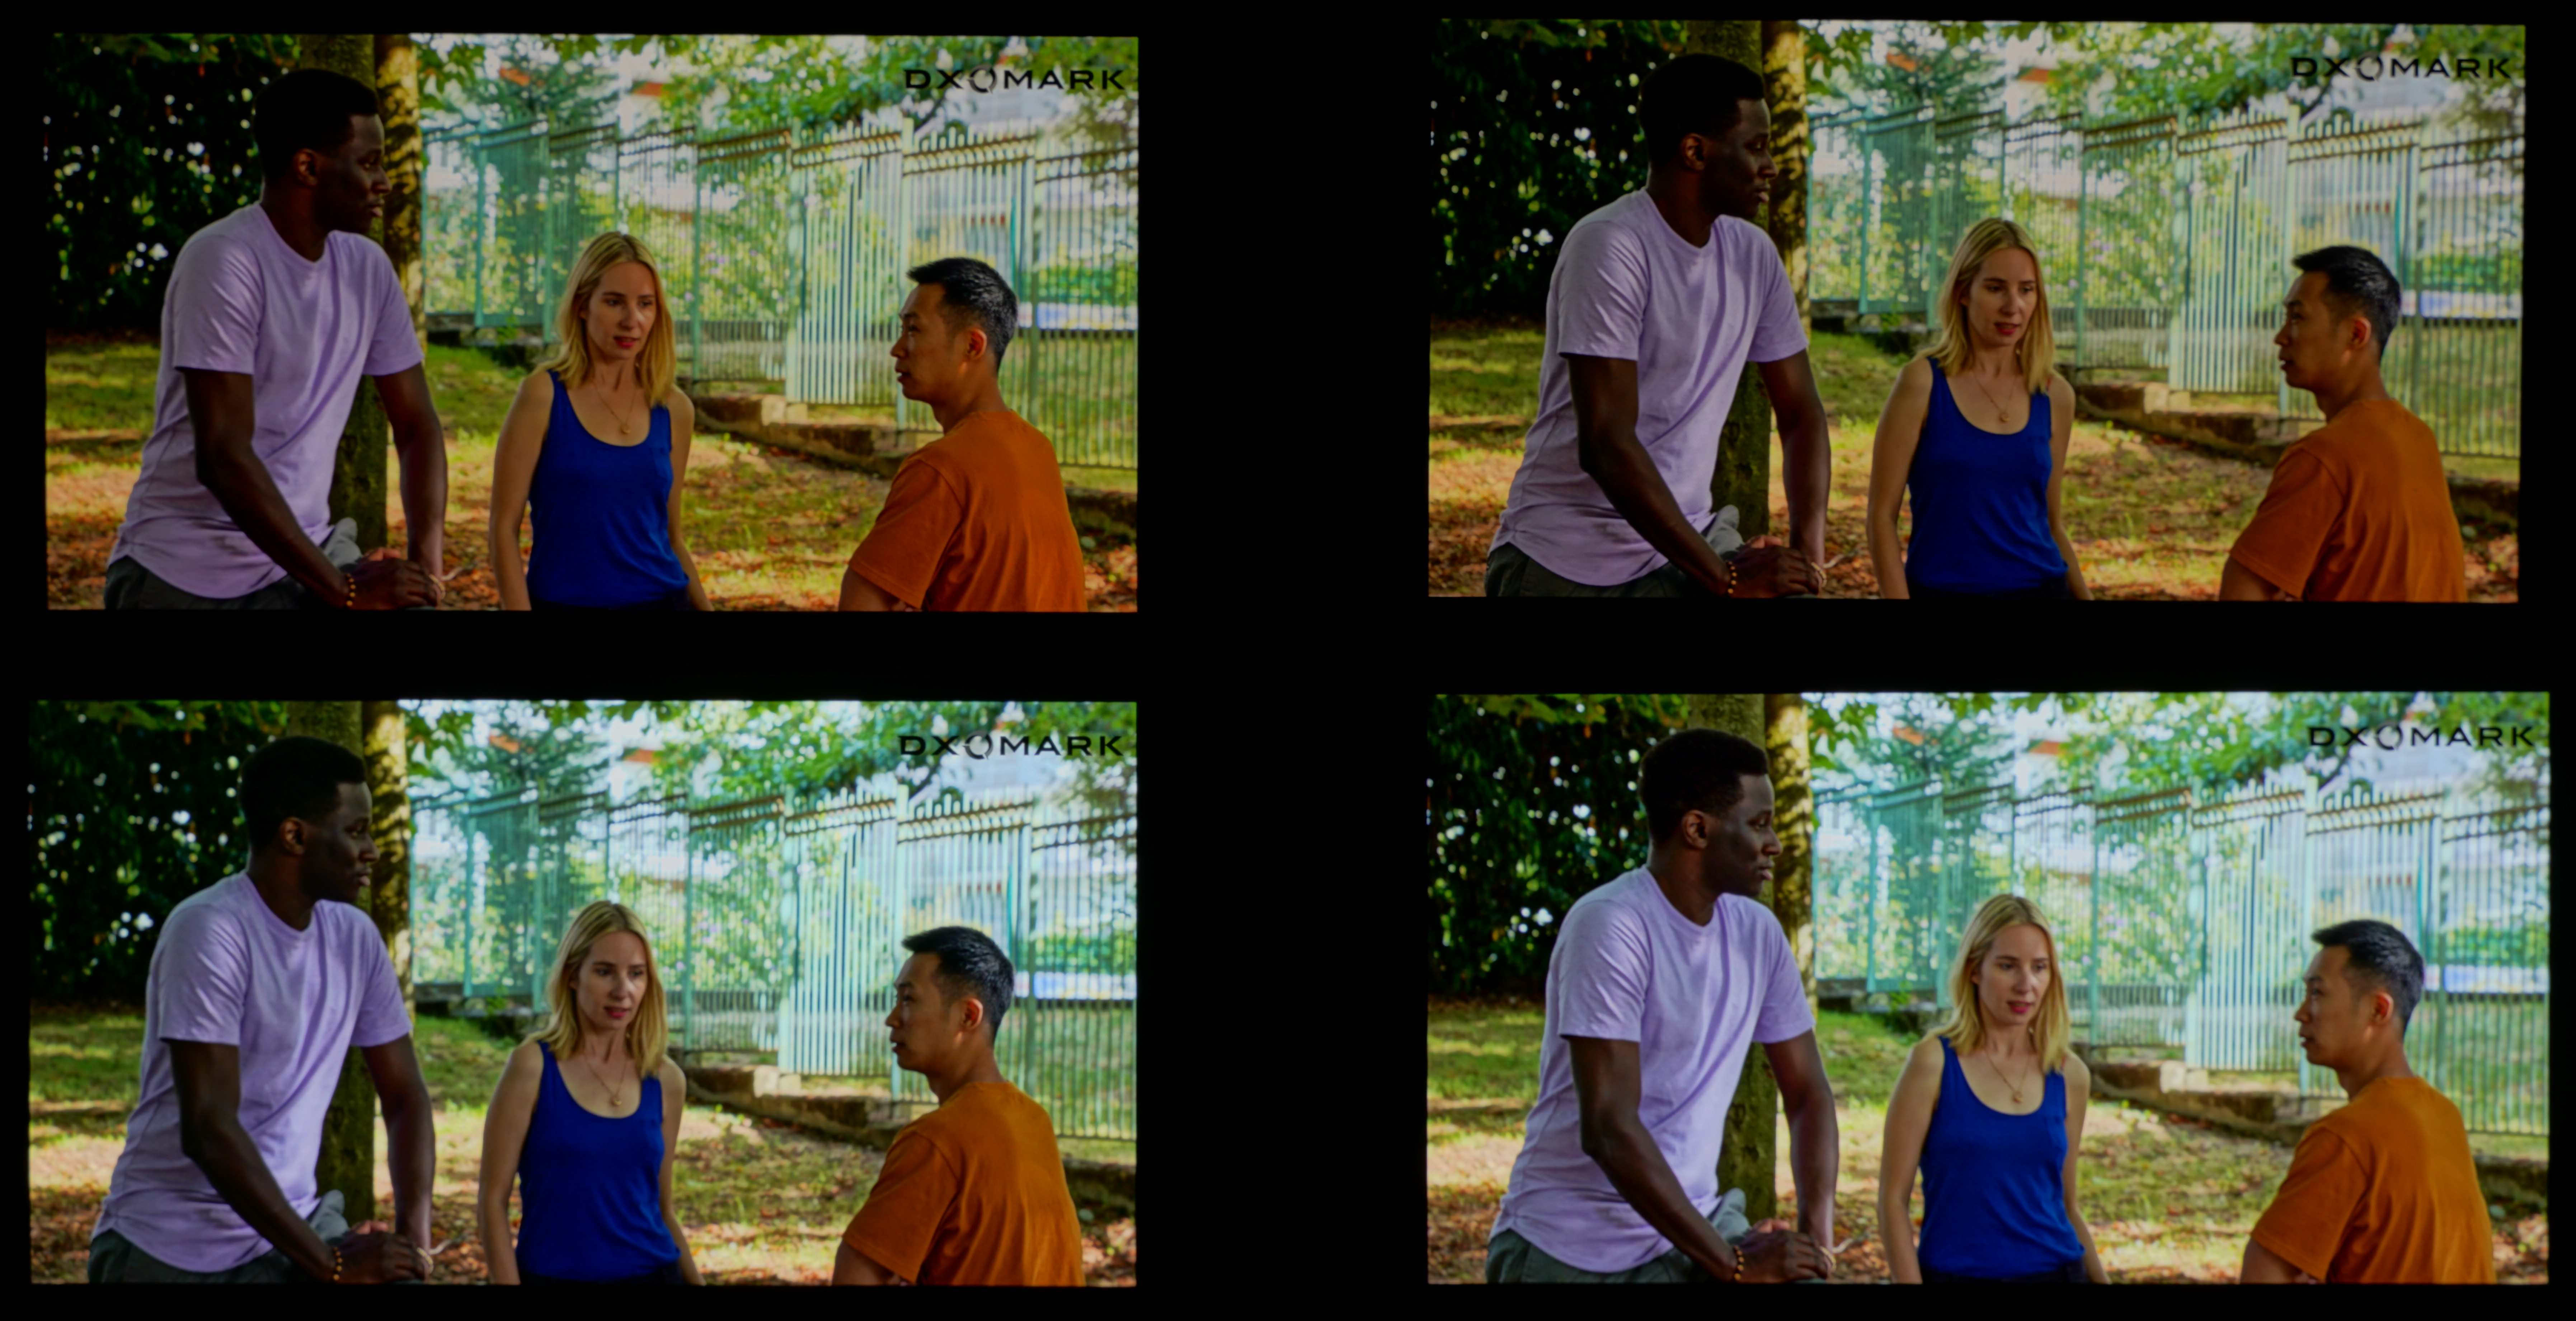
Video rendering in a low-light (0 lux) environment
Clockwise from top left: Apple iPhone 15 Pro Max, Apple iPhone 14 Pro Max, Samsung Galaxy S23 Ultra, Honor Magic5 Pro
(Photos for illustration only)
Clockwise from top left: Apple iPhone 15 Pro Max, Apple iPhone 14 Pro Max, Samsung Galaxy S23 Ultra, Honor Magic5 Pro
(Photos for illustration only)
SDR video EOTF curve
These curves represent the SDR video tone distribution for white color.
The Electro-Optical Transfer Function (EOTF) defines how bits are converted into luminance out of the display. Gray levels (horizontal axis) represent the different shades from pure white (100% gray level) to pitch black (0% gray level). The standard for SDR videos follows a 2.2 gamma. The flatter the curves, the harder it is to perceive differences between consecutive shades. This phenomenon is more frequent under bright lighting conditions (830 lux) in the low gray levels region (< 30%).
HDR10 video EOTF curve
These curves represent the HDR10 video tone distribution for white color.
The Electro-Optical Transfer Function (EOTF) defines how bits are converted into luminance out of the display. Gray levels (horizontal axis) represent the different shades from pure white (100% gray level) to pitch black (0% gray level). While the PQ (Perceptual Quantizer) standard is reminded here for reference, it cannot be a target for smartphones as it is an absolute standard whereas smartphones adapt their brightness to lighting conditions. The flatter the curves, the harder it is to perceive differences between consecutive shades. This phenomenon is more frequent under bright lighting conditions (830 lux) in the low gray levels region (< 30%).
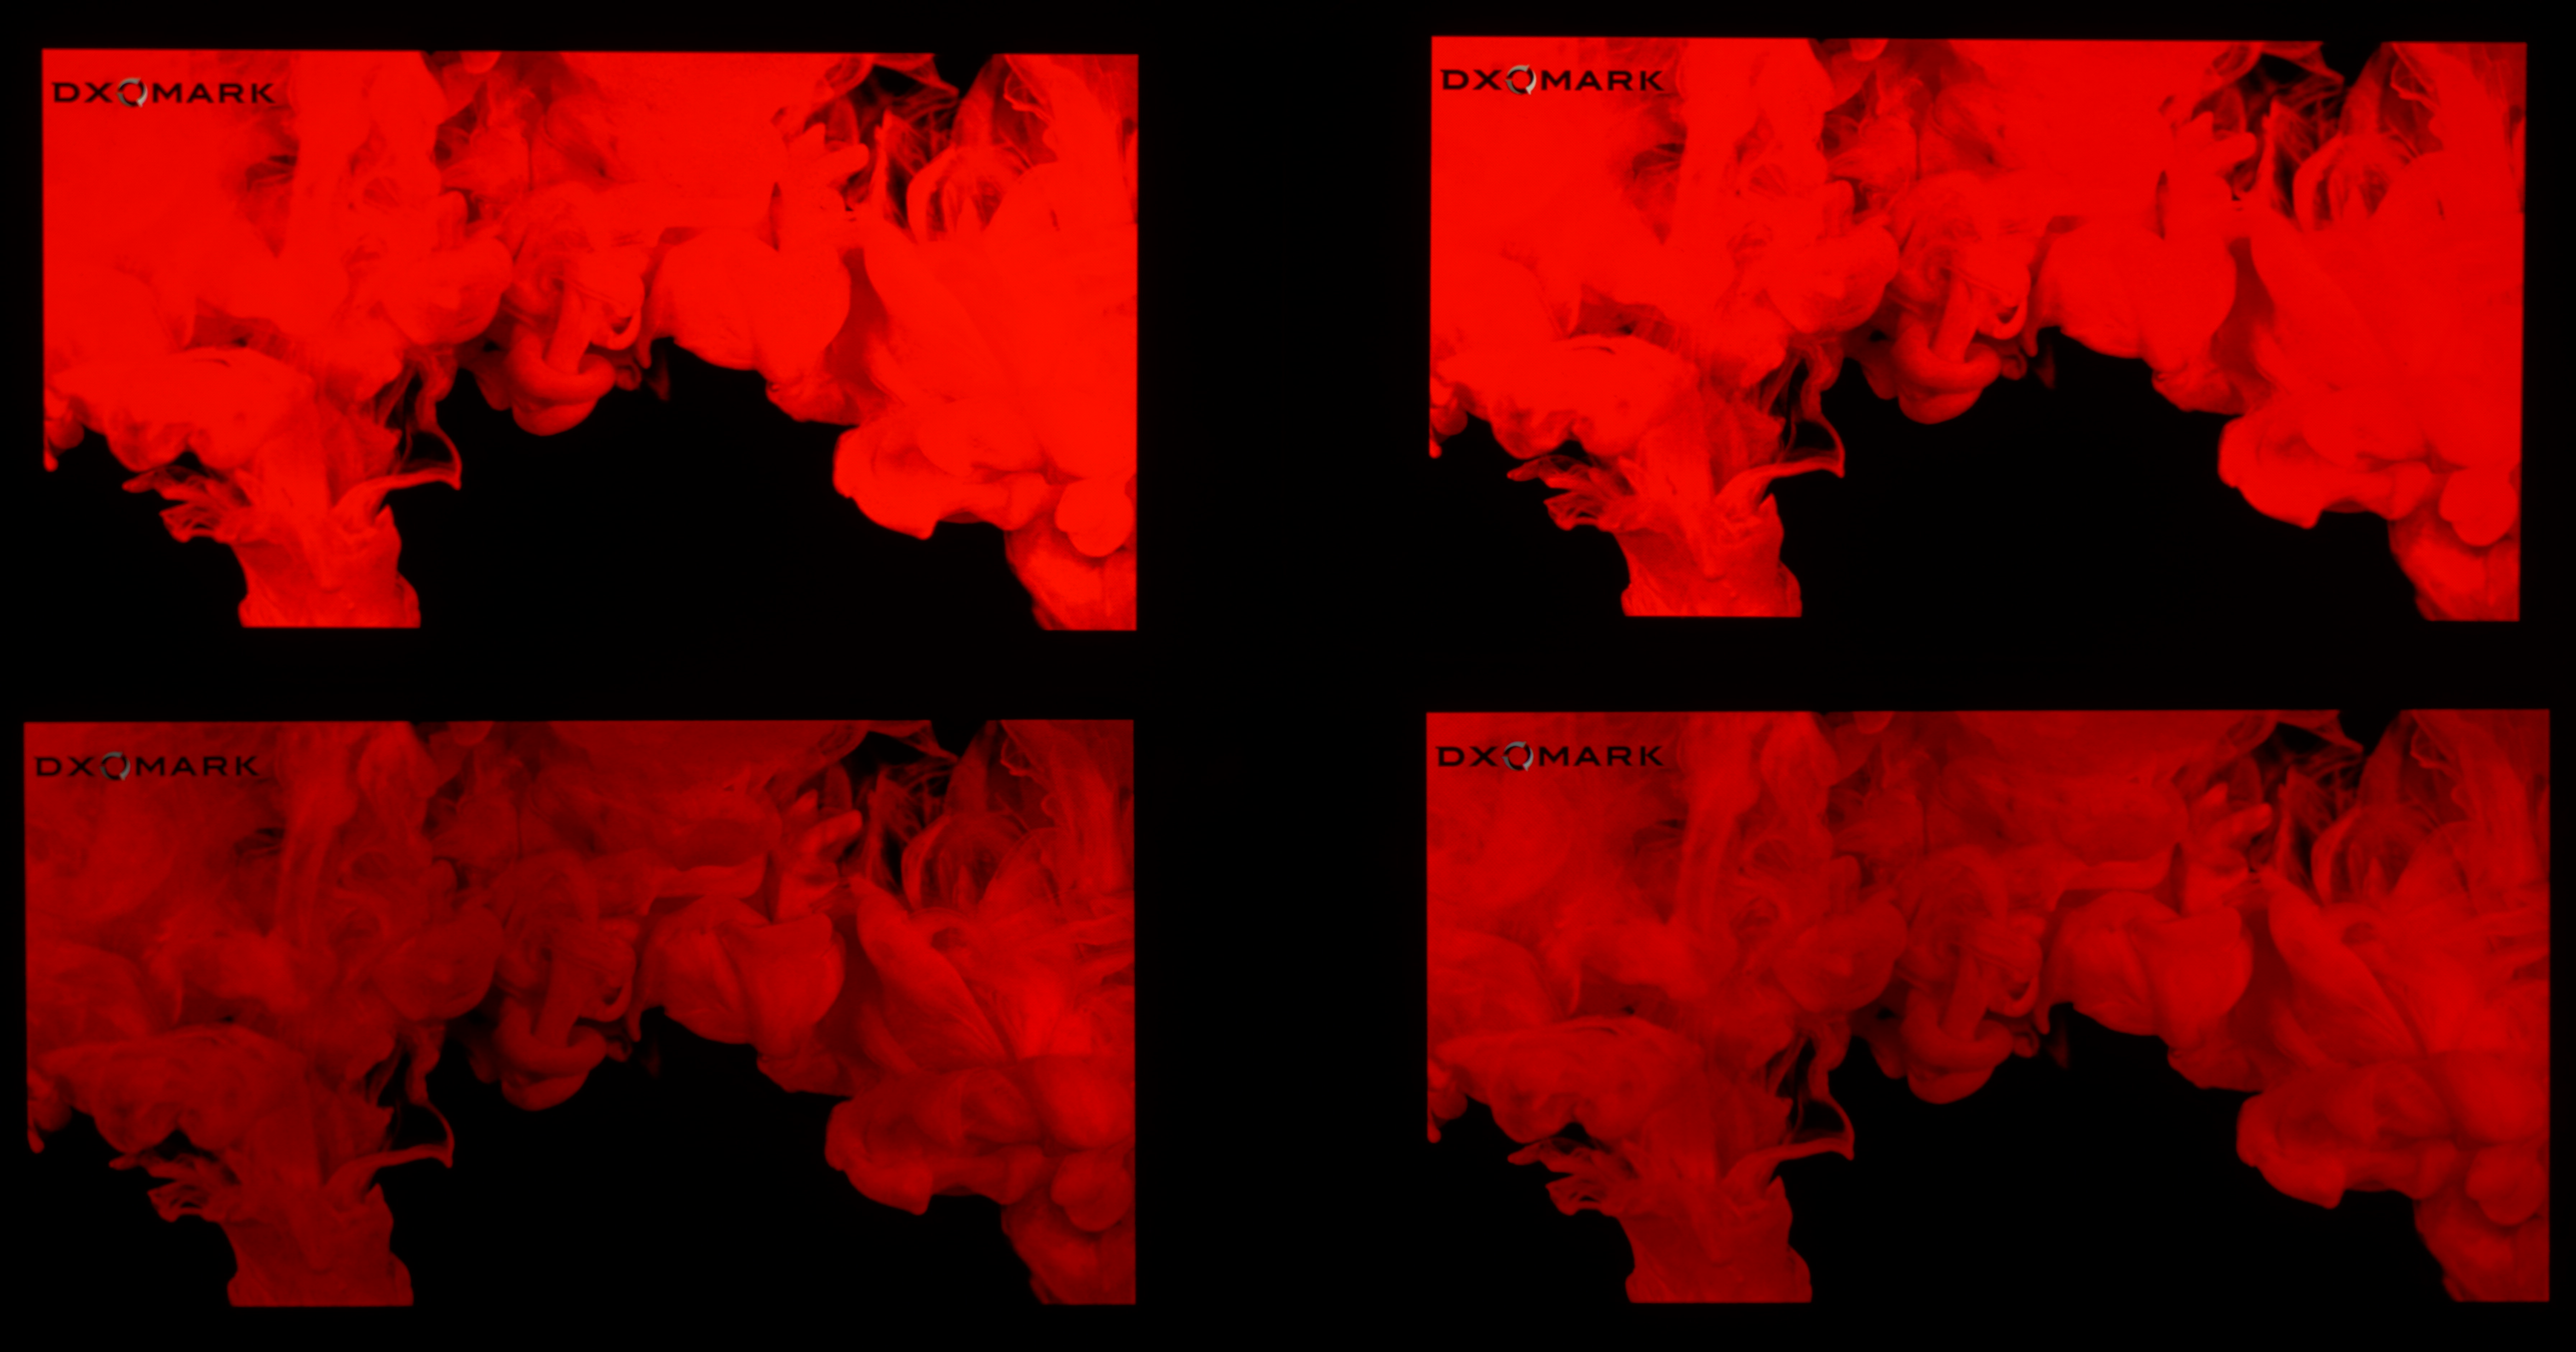
In the illustration below, you can see that the Apple devices struggle to render details in the red shades. This kind of effect can occur when playing certain HDR videos.
Clockwise from top left: Apple iPhone 15 Pro Max, Apple iPhone 14 Pro Max, Samsung Galaxy S23 Ultra, Honor Magic5 Pro
(Photos for illustration only)
Gamut coverage for video content under 0 lux environment
The primary colors are measured both in HDR10 and SDR. The solid color gamut measures the extent of the color area that the device can render in total darkness. The dotted line represents the content’s artistic intent. The measured gamut should match the master color space of each video.
Gamut coverage for video content under 830 lux environment
The primary colors are measured both in HDR10 and SDR. The solid color gamut measures the extent of the color area that the device can render in total darkness. The dotted line represents the content’s artistic intent. The measured gamut should match the master color space of each video.
SDR Video Frame Drops FHD at 30 fps
Apple iPhone 15 Pro Max
Samsung Galaxy S24 Ultra
Honor Magic6 Pro
HDR Video Frame Drops UHD at 30 fps
Apple iPhone 15 Pro Max
Samsung Galaxy S24 Ultra
Honor Magic6 Pro
These gauges present the percentage of frame irregularities in a 30-second video. These irregularities are not necessarily perceived by users (unless they are all located at the same time stamp) but are an indicator of performance.
Touch
157
Google Pixel 7 Pro
Google Pixel 7 Pro
How Display Touch score is composed
We evaluate the touch attributes under many types of contents where touch is key, and requires different behaviors such as gaming (quick touch to response time), web (smooth scrolling of the page) and images (accurate and smooth navigation from one image to another).
Average Touch Response Time Apple iPhone 15 Pro Max
Apple iPhone 15 Pro Max
Samsung Galaxy S24 Ultra
Honor Magic6 Pro
Touch To Display response time
This response time test precisely evaluates the time elapsed between a single touch of the robot on the screen and the displayed action. This test is applied to activities that require high reactivity, such as gaming.