
We put the Apple iPhone Air through our rigorous DXOMARK Camera test suite to measure its performance in photo, video, and zoom quality from an end-user perspective. This article breaks down how the device fared in a variety of tests and several common use cases and is intended to highlight the most important results of our testing with an extract of the captured data.
Overview
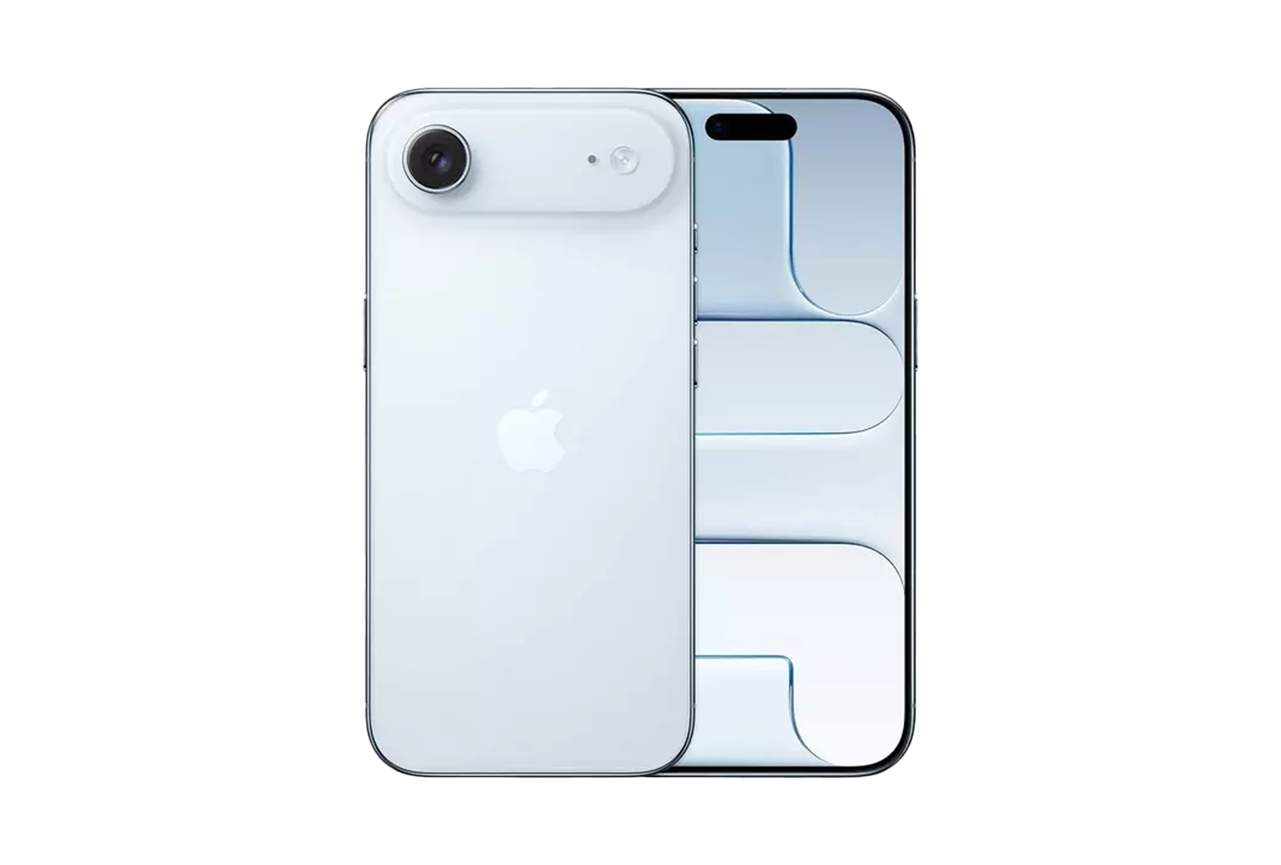
Key camera specifications:
- Primary: 48MP 1/1.56″ sensor, 1.0µm pixels, 26mm equivalent f/1.6-aperture lens, dual pixel PDAF, sensor-shift OIS
Scoring
Sub-scores and attributes included in the calculations of the global score.
Apple iPhone Air
Use cases & Conditions
Use case scores indicate the product performance in specific situations. They are not included in the overall score calculations.
Portrait
Portrait photos of either one person or a group of people
Outdoor
Photos & videos shot in bright light conditions (≥1000 lux)
Indoor
Photos & videos shot in good lighting conditions (≥100lux)
Lowlight
Photos & videos shot in low lighting conditions (<100 lux)
Zoom
Photos and videos captured using zoom (more than 1x)
Pros
- Accurate target exposure and wide dynamic range
- Nice color in most conditions
- Good balance between texture and noise, especially in bright conditions
- Good detail and exposure in night shots
- Very effective image stabilization in video mode results in smooth footage
Cons
- No tele or ultra-wide camera modules
- Some underexposure when capturing photos of high-contrast scenes
- Narrow depth of field can result in out-of-focus background subjects
- Lack of detail, inaccurate exposure in bokeh mode, slight segmentation errors in difficult scenes
- Slightly slow focus in photo mode, occasional loss of focus in video mode
- Exposure instabilities, slight color casts and white balance adaptation issues in video
The Apple iPhone Air did well in the DXOMARK Camera tests, but the lack of dedicated tele and ultra-wide camera modules means it cannot claim a spot among the best in our ranking. In camera terms the iPhone Air is essentially a simplified version of the iPhone 17 Pro, with only one camera module instead of the Pro’s three. Performance is very close to the 17 Pro’s primary camera module, producing bright pictures with very good image quality. However, the lack of tele and ultra-wide modules impacts the Air’s photography experience, especially when compared to some direct competitors, such as the Samsung Galaxy S25 Edge, which include an ultra-wide module for added shooting flexibility.
That being said, the Air’s single camera module captures nice photos in most shooting conditions, with usually pleasant colors and warm white balance. Detail is good and noise levels are low, especially when shooting in daylight. Minor differences to the 17 Pro are noticeable in low light, where the Pro is slightly ahead in terms of detail retention and noise reduction. Like on the Pro, depth of field is slightly limited. As a result background subjects in group shots can be out of focus.
In video mode, the iPhone Air offers a wide range of resolutions and frame rates, up to 60fps at 4K and 240fps at 1080p Full HD. Our testing was performed at 4K/60fps where the device produced the overall best results, with the HDR format delivering a wide dynamic range and vivid colors. The texture/noise trade-off is good in most shooting conditions and the effective image stabilization ensures stable footage. However, our testers noticed occasional exposure instabilities and white balance adaptation issues, as well as some slight refocusing during recording.
Test summary
About DXOMARK Camera tests: DXOMARK’s camera evaluations take place in laboratories and real-world situations using a wide variety of use-cases. The scores rely on objective tests for which the results are calculated directly using measurement software in our laboratory setups, and on perceptual tests where a sophisticated set of metrics allow a panel of image experts to compare aspects of image quality that require human judgment. Testing a smartphone involves a team of engineers and technicians for about a week. Photo and Video quality are scored separately and then combined into an overall score for comparison among the cameras in different devices. For more information about the DXOMARK Camera protocol, click here. More details on smartphone camera scores are available here. The following section gathers key elements of DXOMARK’s exhaustive tests and analyses. Full performance evaluations are available upon request. Please contact us on how to receive a full report.
Photo
Apple iPhone Air
180
For scoring and analysis, DXOMARK engineers capture and evaluate more than 3,800 test images in controlled lab environments as well as outdoor, indoor and low-light natural scenes, using the camera’s default settings. The photo protocol is designed to take into account the main use cases and is based on typical shooting scenarios, such as portraits, landscape and zoom photography. The evaluation is performed by visually inspecting images against a reference of natural scenes, and by running objective measurements on images of charts captured in the lab under different lighting conditions from 0.1 to 10,000+ lux and color temperatures from 2,300K to 6,500K.
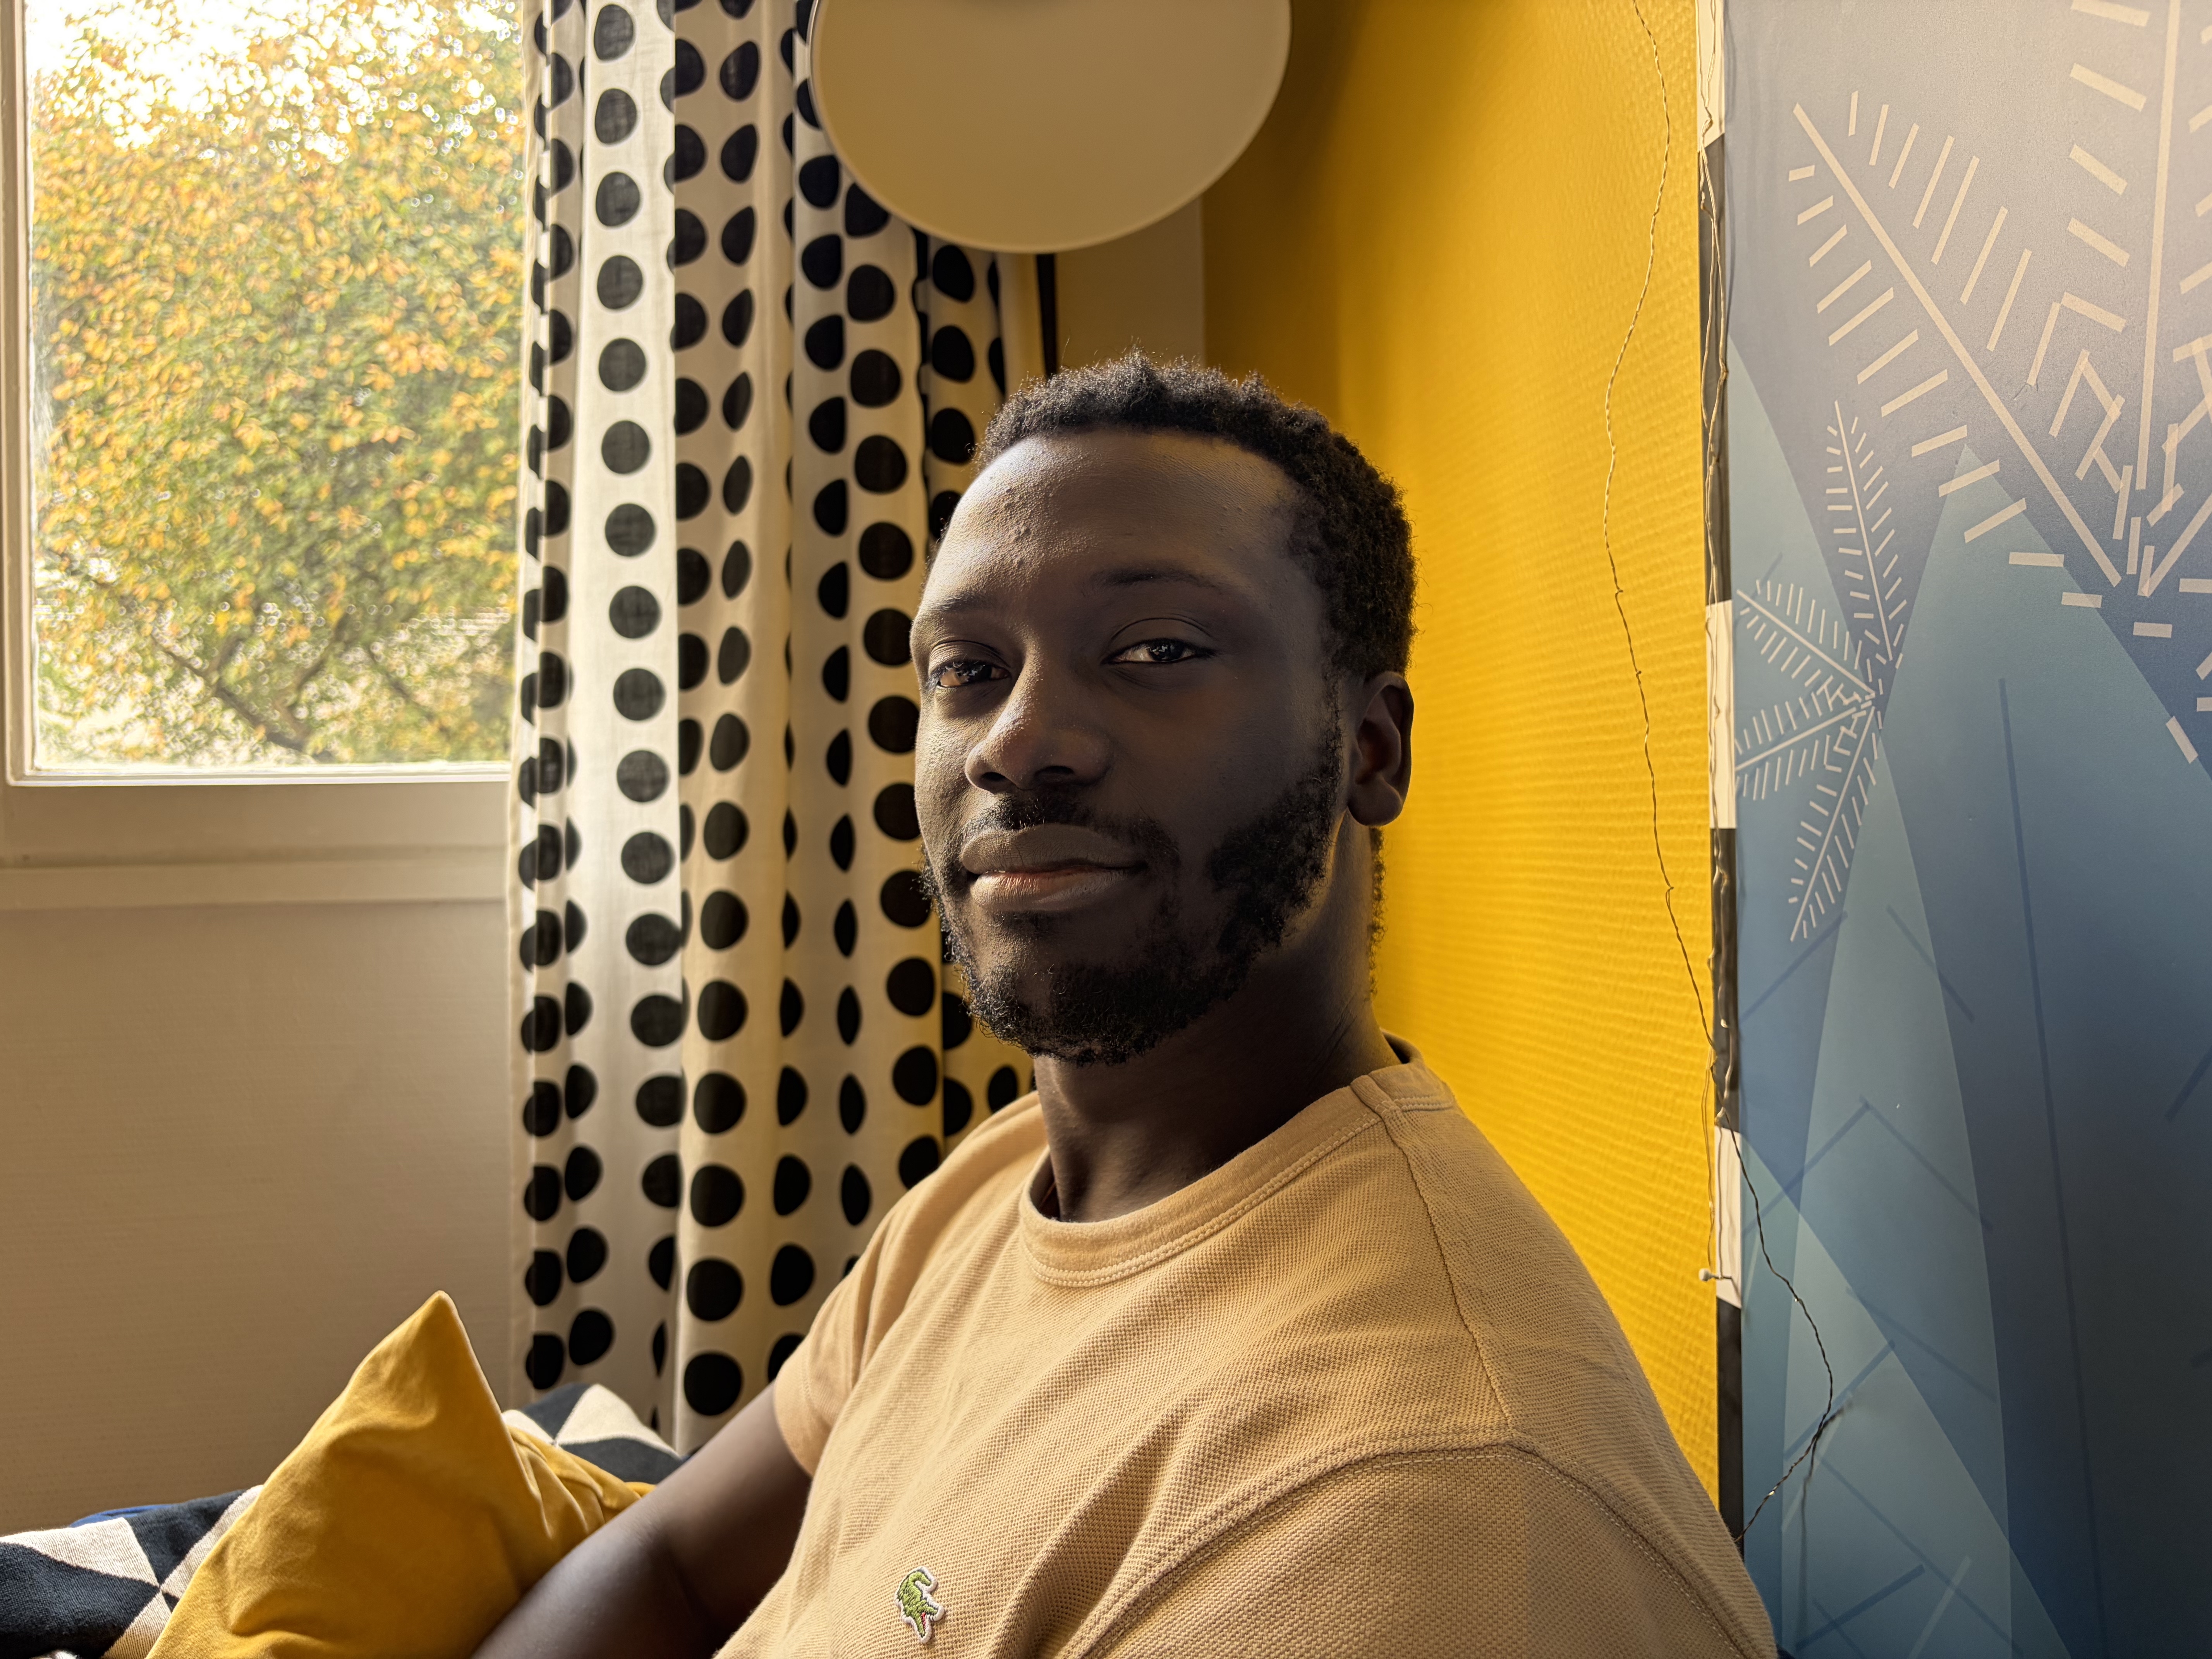
In our tests, image quality and camera performance of the iPhone Air were very close to the iPhone 17 Pro’s primary camera module, with similar strengths and weaknesses. Overall image quality is very good, with pleasant image output in most shooting conditions. Skin tones are rendered very well and nicely exposed, especially when images are viewed on an HDR display, but some occasional underexposure can be noticeable in difficult high-contrast scenes.
Images captured with the iPhone Air camera offer very good detail and a good trade-off between detail and noise, especially when shooting in bright light. In low light scenes noise can become more intrusive and detail levels lag slightly behind the flagship iPhone 17 Pro. The autofocus system does mostly a good job. Pictures are sharp and well focused in most situations, but the focus could be slightly faster to lock on. Depth of field is a little narrow as well, resulting in some out-of-focus background subjects in group shots.
When shooting in portrait mode, the camera produces nice pictures with a natural simulated bokeh effect. However, there can be a lack of detail on subjects and our testers also noticed some imprecise subject segmentation, especially in difficult scenes. The iPhone Air does not come with a dedicated tele zoom camera, so unsurprisingly detail in tele images could be better, especially at medium and long range tele settings. This is also where the difference to the iPhone 17 Pro is most noticeable. At close range tele, the camera produces decent detail which is pretty much on par with the flagship iPhone model.

Main
Apple iPhone Air
184

Exposure
Apple iPhone Air
134

Color
Apple iPhone Air
133
Exposure and color are the key attributes for technically good pictures. For exposure, the main attribute evaluated is the brightness level of the main subject through various use cases such as landscape, portrait, or still life. Other factors evaluated are the global contrast and the ability to render the dynamic range of the scene (ability to render visible details in both bright and dark areas). When the camera provides Photo HDR format, the images are analyzed with a visualization on an HDR reference monitor, under reference conditions specified in the ISO-22028-5 standard. Repeatability is also important because it demonstrates the camera's ability to provide the same rendering when shooting several images of the same scene.
For color, the image quality attributes analyzed are skin-tone rendering, white balance, color shading, and repeatability. For color and skin tone rendering, we penalize unnatural colors according to results gathered in various studies and consumer insights while respecting the manufacturer's choice of color signature.


Sharpness & Timing
Apple iPhone Air
135
Autofocus tests concentrate on focus accuracy, focus repeatability, shooting time delay, and depth of field. Shooting delay is the difference between the time the user presses the capture button and the time the image is actually taken. It includes focusing speed and the capability of the device to capture images at the right time, what is called 'zero shutter lag' capability. Even if a shallow depth of field can be pleasant for a single subject portrait or close-up shot, it can also be a problem in some specific conditions such as group portraits; Both situations are tested. Focus accuracy is also evaluated in all the real-life images taken, from infinity to close-up objects and in low light to outdoor conditions.

Texture
Apple iPhone Air
132
Texture tests analyze the level of details and the texture of subjects in the images taken in the lab as well as in real-life scenarios. For natural shots, particular attention is paid to the level of details in the bright and dark areas of the image. Objective measurements are performed on chart images taken in various lighting conditions from 0.1 to 10,000+ lux and different kinds of dynamic range conditions. The charts used are the proprietary DXOMARK chart (DMC), and the Dead Leaves chart. We also have an AI based metric for the level of details on our realistic mannequins Eugene and Diana.

Noise
Apple iPhone Air
129
Noise tests analyze various attributes of noise such as intensity, chromaticity, grain, structure on real-life images as well as images of charts taken in the lab. For natural images, particular attention is paid to the noise on faces, landscapes, but also on dark areas and high dynamic range conditions. Noise on moving objects is also evaluated on natural images. Objective measurements are performed on images of charts taken in various conditions from 0.1 to 10000 lux and different kinds of dynamic range conditions. The chart used is the Dead Leaves chart and the standardized measurement such as Visual Noise derived from ISO 15739.

Artifacts
Apple iPhone Air
81
The artifacts evaluation looks at flare, lens shading, chromatic aberrations, geometrical distortion, edges ringing, halos, ghosting, quantization, unexpected color hue shifts, among others type of possible unnatural effects on photos. The more severe and the more frequent the artifact, the higher the point deduction on the score. The main artifacts observed and corresponding point loss are listed below.

Bokeh
Apple iPhone Air
180
Bokeh is tested in one dedicated mode, usually portrait or aperture mode, and analyzed by visually inspecting all the images captured in the lab and in natural conditions. The goal is to reproduce portrait photography comparable to one taken with a DLSR and a wide aperture. The main image quality attributes paid attention to are depth estimation, artifacts, blur gradient, and the shape of the bokeh blur spotlights. Portrait image quality attributes (exposure, color, texture) are also taken into account.


Tele
Apple iPhone Air
170
All image quality attributes are evaluated at focal lengths from approximately 40 mm to 300 mm, with particular attention paid to texture and detail. The score is derived from a number of objective measurements in the lab and perceptual analysis of real-life images.


Video
Apple iPhone Air
172
DXOMARK engineers capture and evaluate almost 3 hours of video in controlled lab environments and in natural low-light, indoor and outdoor scenes, using the camera’s default settings. The evaluation consists of visually inspecting natural videos taken in various conditions and running objective measurements on videos of charts recorded in the lab under different conditions from 0.1 to 10000+ lux and color temperatures from 2,300K to 6,500K.
Not only the iPhone Air’s photo quality very close to the 17 Pro’s primary camera. The same is true for the video output. Video clips are bright, with a wide dynamic range, thanks to Apple’s HDR processing and format. Color rendering is generally accurate in most recording conditions, but our testers noticed some slight white balance casts and adaptation issues, as well as some exposure instabilities.
Video footage offers decent trade-off between texture and noise in bright light. Video noise is well under control and detail is good when recording in daylight or under typical indoor lighting. Video autofocus is fast and mostly accurate, but we did notice occasional loss of focus when tracking faces. Video stabilization is very effective, making for stable video, even when running during recording. In addition, motion is very smooth, thanks to a 60fps frame rate. The lack of tele and ultra-wide camera modules also has a negative impact on the video experience, especially when zooming. While at close range tele settings video detail is decent and on a similar level as on the iPhone 17 Pro, there is a noticeable reduction in detail at medium and long range tele.
Main
Apple iPhone Air
186
Exposure
Apple iPhone Air
133
Color
Apple iPhone Air
131
Exposure tests evaluate the brightness level of the main subject, the global contrast and the ability to render the dynamic range of the scene (ability to render visible details in both bright and dark areas). When the camera provides Video HDR format, the videos are analyzed with visualization on an HDR reference monitor, under reference conditions specified in the metadata. Stability and temporal adaption of the exposure are also analyzed.
Image-quality color analysis looks at color rendering, skin-tone rendering, white balance, color shading, stability of the white balance and its adaption when light is changing.
Texture
Apple iPhone Air
118
Texture tests analyze the level of details and texture of the real-life videos as well as the videos of charts recorded in the lab. Natural videos recordings are visually evaluated, with particular attention paid to the level of details in the bright and areas as well as in the dark. Objective measurements are performed of images of charts taken in various conditions from 0.1 to 10000 lux. The charts used are the DXOMARK chart (DMC) and Dead Leaves chart.
Noise
Apple iPhone Air
129
Noise tests analyze various attributes of noise such as intensity, chromaticity, grain, structure, temporal aspects on real-life video recording as well as videos of charts taken in the lab. Natural videos are visually evaluated, with particular attention paid to the noise in the dark areas and high dynamic range conditions. Objective measurements are performed on the videos of charts recorded in various conditions from 0.1 to 10000 lux. The chart used is the DXOMARK visual noise chart.

Stabilization
Apple iPhone Air
124
Stabilization evaluation tests the ability of the device to stabilize footage thanks to software or hardware technologies such as OIS, EIS, or any others means. The evaluation looks at residual motion, smoothness, jello artifacts and residual motion blur on walk and run use cases in various lighting conditions. The video below is an extract from one of the tested scenes.
Artifacts
Apple iPhone Air
89
Artifacts are evaluated with MTF and ringing measurements on the SFR chart in the lab as well as frame-rate measurements using the LED Universal Timer. Natural videos are visually evaluated by paying particular attention to artifacts such as aliasing, quantization, blocking, and hue shift, among others. The more severe and the more frequent the artifact, the higher the point deduction from the score. The main artifacts and corresponding point loss are listed below.
Tele
Apple iPhone Air
140
All image quality attributes are evaluated at focal lengths from approximately 12 mm to 300 mm, with particular attention paid to texture and smoothness of the zooming effect. The score is derived from a number of objective measurements in the lab and perceptual analysis of real-life video recordings.