We put the Apple MacBook Air 13″ (2022) through our rigorous DXOMARK Laptop test suite to measure its performance both at sound, camera and display.
In this review, we will break down how it fared in a variety of tests and several common use cases.
Overview
Key specifications include (as given by the manufacturer):
- Physical specs : 30.41 x 21.5 x 1.13 cm
- Display : 13.6”, 2560×1664, 500nits, True Tone, P3
- Audio : Quad speaker, Dolby Atmos, 3-microphone array with beamforming
- Webcam : FaceTime HD 1080p
Scoring
Use-case and feature subscores included in the calculations of the global score

Apple MacBook Air 13" (2022)
84
95
84
Pros
- In video call, camera providing a high level of details, a pleasing color rendering, good dynamic range, and accurate target exposure on faces
- In video call, in capture, good tonal balance, sharp dynamics and good voice loudness
- Excellent playback of voices with warm, realistic and intelligible voices
- Very good HDR rendering with wide gamut, satisfying EOTF and good handling of the limited brightness range
- Reflectance is well handled overall
- Excellent dynamics with sharp, precise impacts and strong punch in music & video audio
- Good audio spatial rendering with wide stereo and good distance rendition
Cons
- Visible artifacts like ringing, quantization and fringing in most tested conditions
- Background noises insufficiently attenuated
- Duplex handling issues with gating
With a great performance in both video call and multimedia use cases, the Macbook Air took the second spot on the list of devices tested to date — just below the Macbook Pro and ahead of all Windows laptops.
Test summary
About DXOMARK Laptop tests: For scoring and analysis in our laptop reviews, DXOMARK engineers perform a variety of objective tests and undertake more than 20 hours of perceptual evaluations under controlled lab conditions and real-life scenarios.
(For more details about the Laptop protocol, click here.)
The following section gathers key elements of our exhaustive tests and analyses performed in DXOMARK laboratories. Detailed performance evaluations under the form of reports are available upon request. Do not hesitate to contact us.
Video Call
Apple MacBook Air 13" (2022)
144
DXOMARK's Video call use case is a score that evaluates how a device handles video calls and videoconferencing in multiple conditions. This score focuses on the camera performance and the capture and playback rendering of voices. Read more about how we test the use cases of Video call score here.
The MacBook Air’s camera produced a nice level of details in all situations, along with pleasing color rendering, good dynamic range in well-lit scenes, and well-handled target exposure on faces. Still, some artifacts such as ringing, quantization, and fringing were visible in most tested conditions. Its audio setup had satisfactory tonal balance and intelligibility for voices, albeit a bit thin-sounding in capture. Background noises were not well attenuated and directivity was not optimal for this use case. For playback, despite a slight lack of low-end, voices sounded clear and natural. The device’s handling of complex duplex situations was not perfect, however, as some gating occurred that impaired voice intelligibility.
Camera
Apple MacBook Air 13" (2022)
135
The following chart presents the camera subscores for the video call use case:
The following graphs show the objective measurements performed in our camera labs:
Audio
Apple MacBook Air 13" (2022)
144
The following chart presents the capture subscores for the video call use case:
The following graphs show the frequency response, distortion and directivity in capture, recorded in our semi-anechoic room:
Music & Video
Apple MacBook Air 13" (2022)
154
DXOMARK's Video and Music use case score evaluates the capability of a device to reproduce multimedia usages such as videos, movies and music playback in indoor conditions. This score focuses on the display performance and audio-playback rendering. Read more about how we test this use case here.
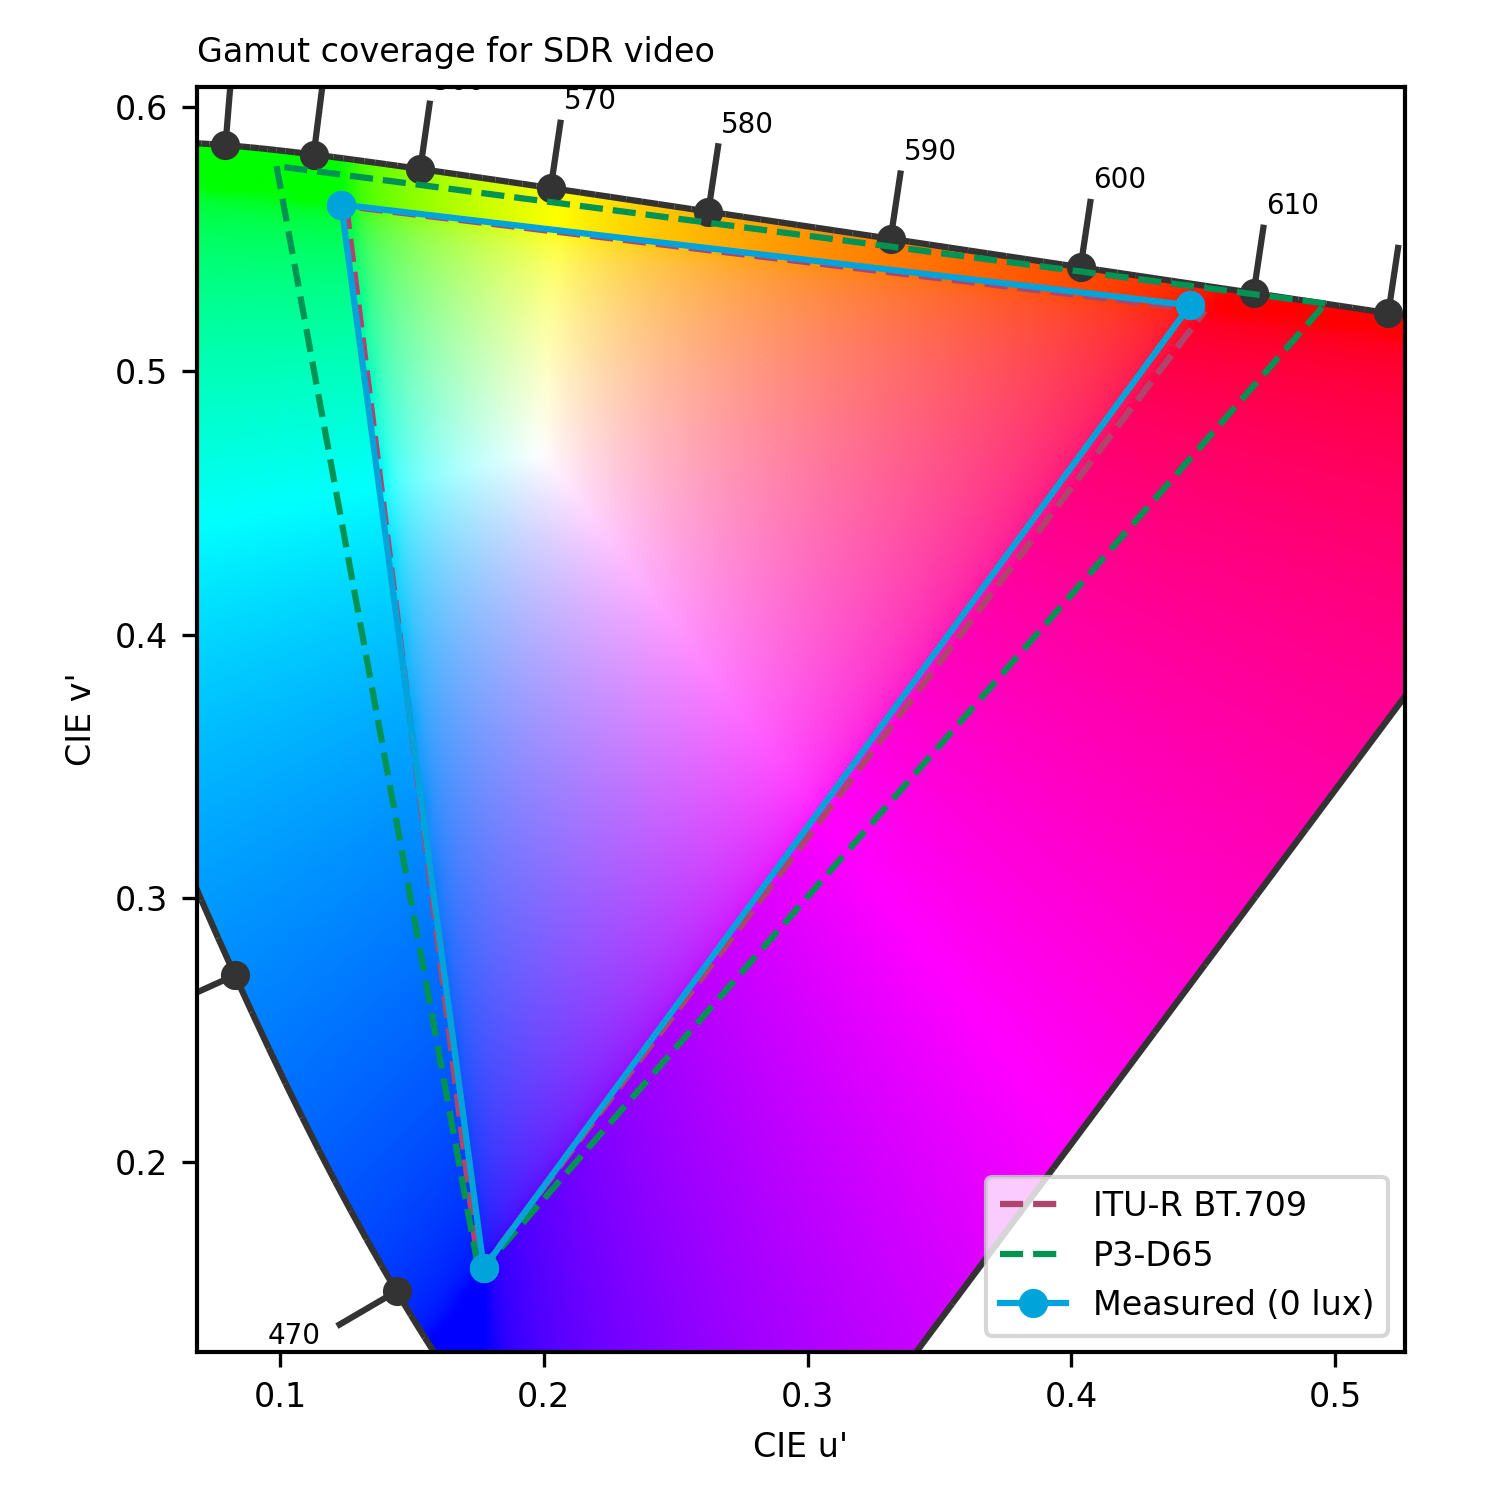
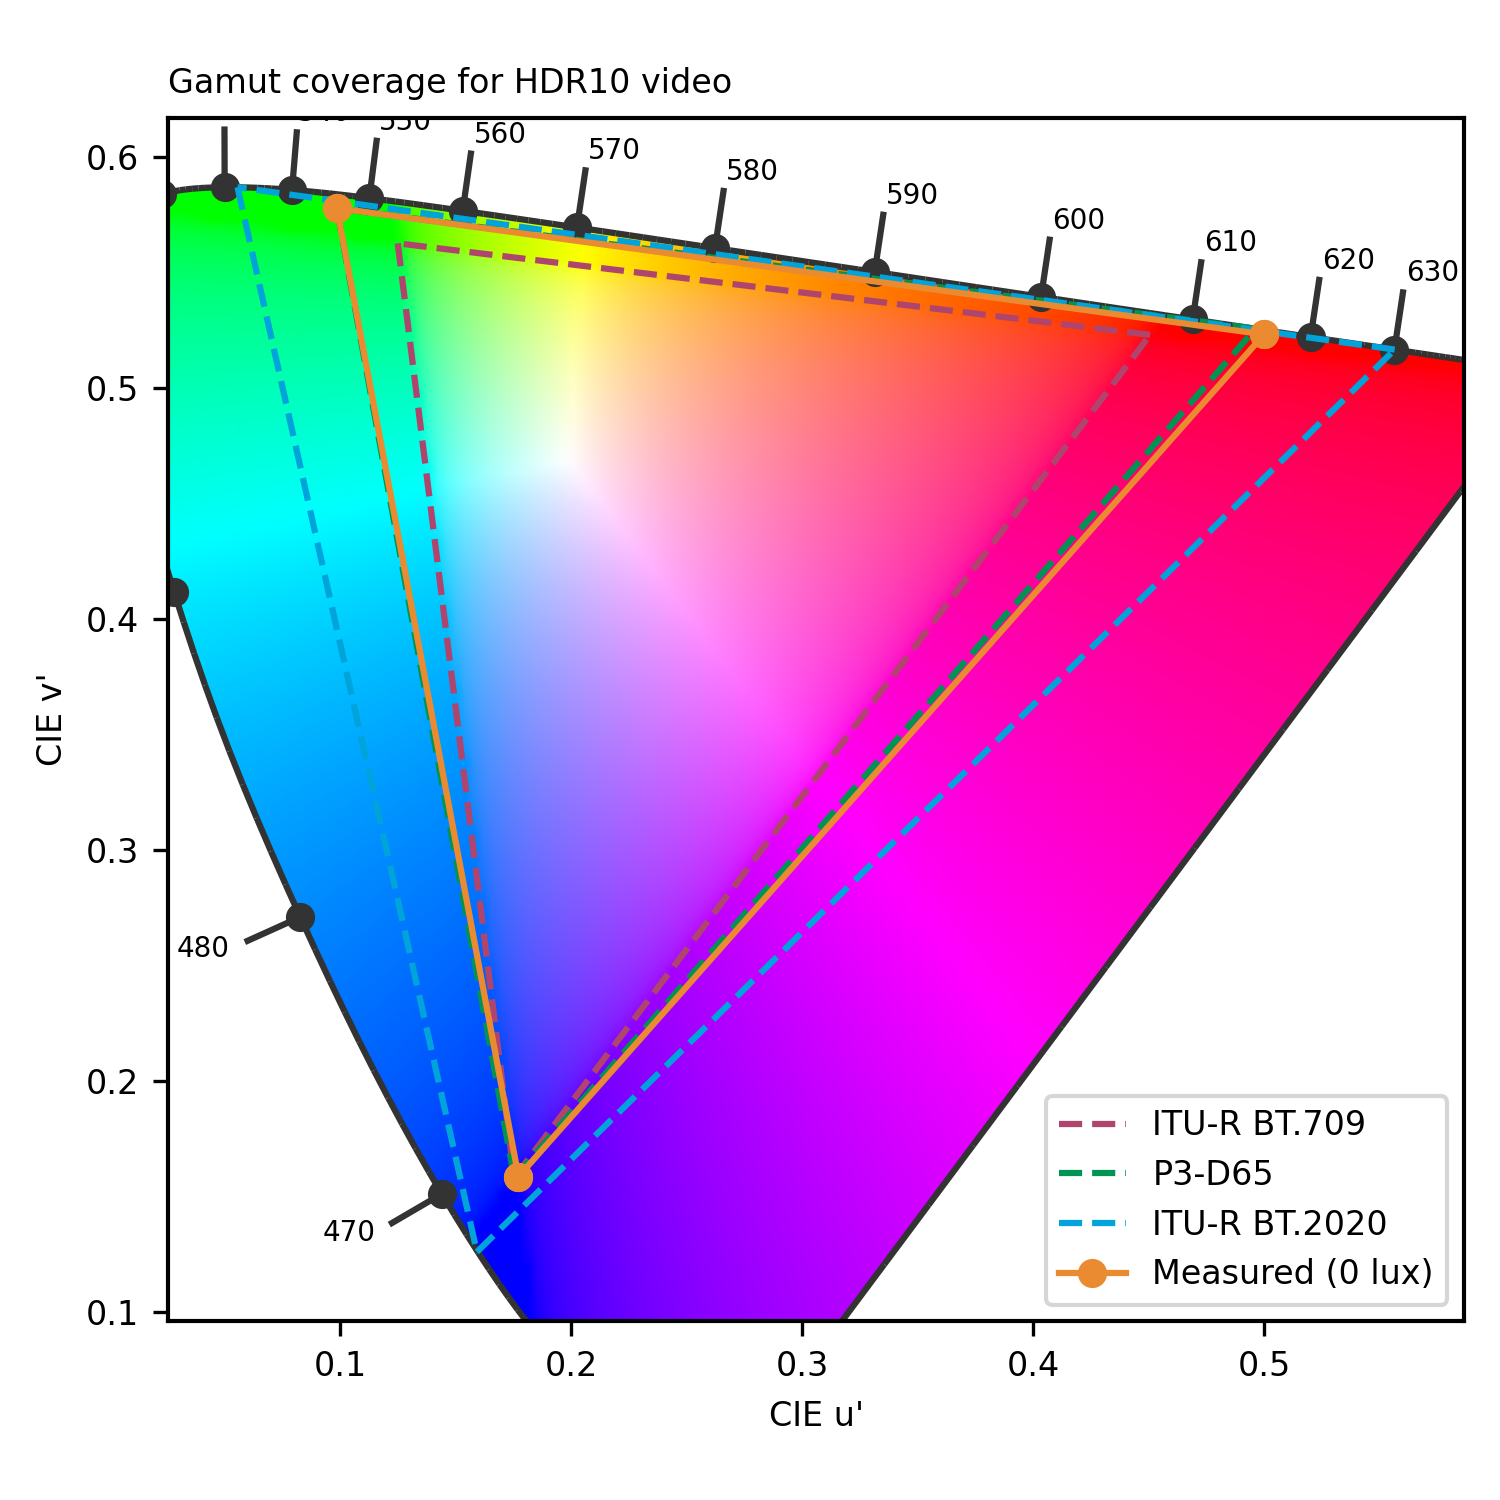
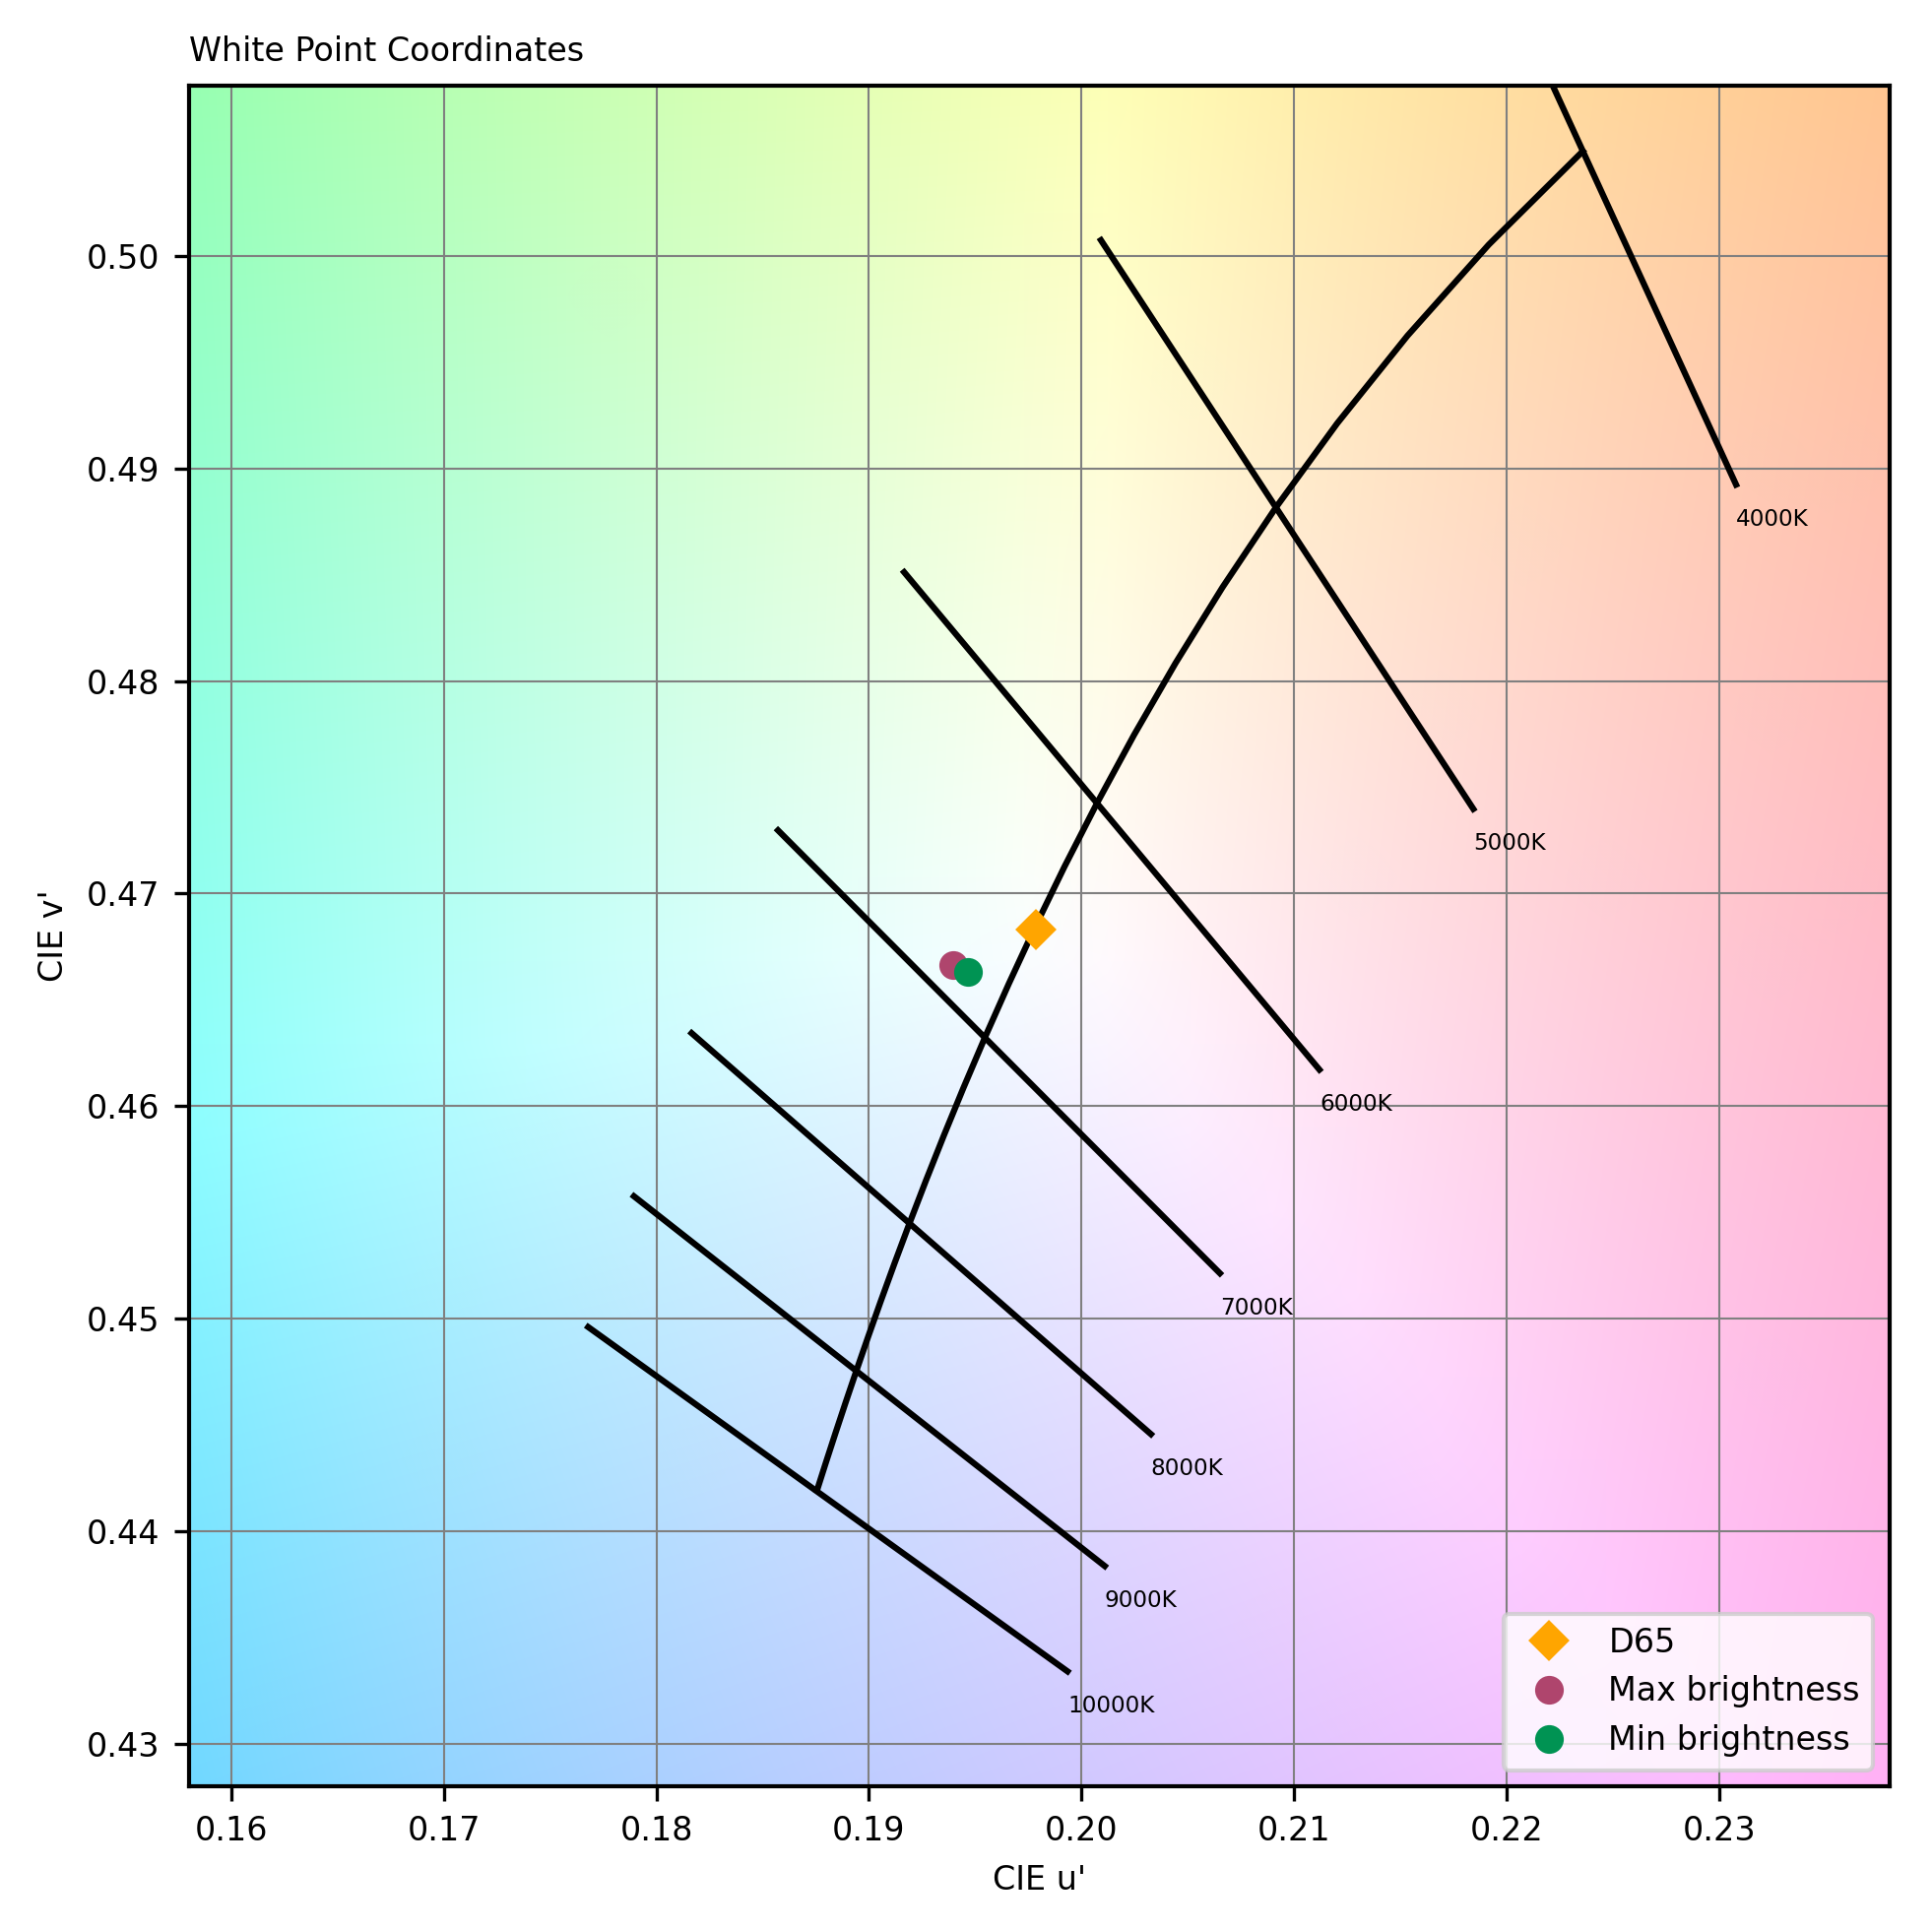
Though more limited than the Macbook Pro, the Air display handled reflectance well, and showed a wide gamut and satisfying EOTF. Its overall display rendering is warm overall compared to all tested Windows laptops. Its SDR rendering was not perfect though, with warm tones overall and unnatural EOTF. Even though bass lacked some strength, audio rendering for multimedia was good overall, with a satisfying tonal balance overall, sharp attack, and punch. The device provided wide audio, correct distance, and very easily localizable sound sources. It handled artifacts well, too, aside from some slight pumping at loud volumes.
Display
Apple MacBook Air 13" (2022)
156
The following chart presents the display subscores for the multimedia use case:
The following graphs show the objective measurements performed in our display lab:
cd/m²
cd/m²
cd/m²
cd/m²
cd/m²
cd/m²
cd/m²
cd/m²
cd/m²
 Distribution of brightness (min)
cd/m²
cd/m²
cd/m²
cd/m²
cd/m²
cd/m²
cd/m²
cd/m²
cd/m²
Distribution of brightness (max)
Audio
Apple MacBook Air 13" (2022)
152
The following chart presents the playback for the multimedia use case:
The following graphs show the frequency response, distortion and directivity in multimedia playback, recorded in our semi-anechoic room:
DXOMARK encourages its readers to share comments on the articles. To read or post comments, Disqus cookies are required. Change your Cookies Preferences and read more about our Comment Policy.