
We put the Apple MacBook Pro 14″ (2023) through our rigorous DXOMARK Laptop test suite to measure its performance both at sound, camera and display.
In this review, we will break down how it fared in a variety of tests and several common use cases.
Overview
Key specifications include (as given by the manufacturer):
- Physical specs : 31.26×22.12×1.55 cm, 1.6 kg
- Display : 14.2” Liquid Retina XDR, 3024×1964, 1000 nits XDR (1600nits peak), 500nits SDR, Pro motion 120Hz dynamic, True Tone.
- Audio : 6 high-fidelity speakers with force canceling woofers, Dolby Atmos, 3-microphone array with beamforming
- Webcam : FaceTime HD 1080p
Scoring
Use-case and feature subscores included in the calculations of the global score
Apple MacBook Pro 14" (2023)

84
95
84
Pros
- In video call, camera provides a great level of detail in most conditions and a very good control of visual noise in well-exposed scenes
- In video call, audio capture features a good tonal balance
- Excellent playback of voices with warm, realistic and intelligible voices
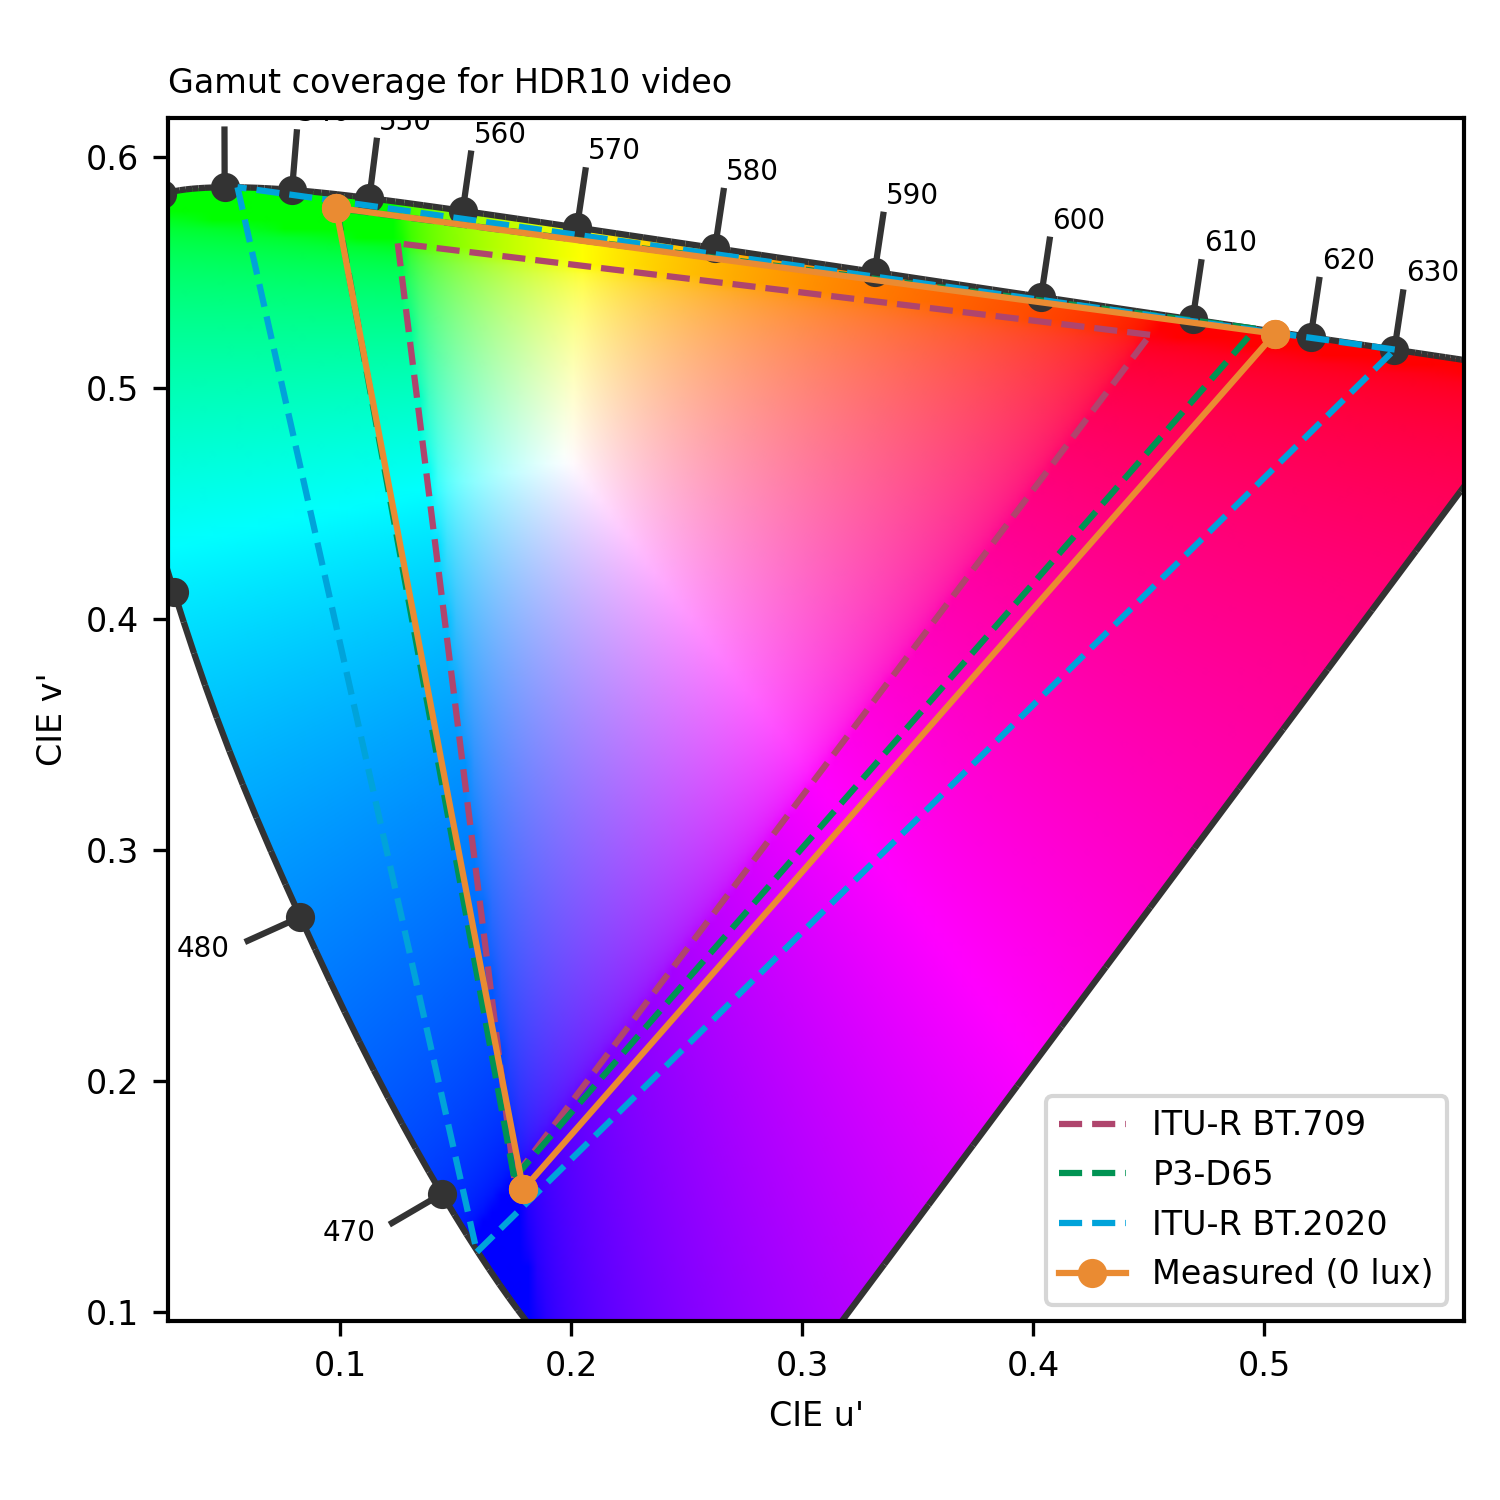
- Best-in-class HDR video rendering with wide gamut, accurate EOTF and very high peak brightness
- Reflectance is well handled overall
- Faithful and very pleasant tonal balance for music & video
- Excellent dynamics with sharp, precise impacts and strong punch in music & video audio
- Good audio spatial rendering with wide stereo and good distance rendition
Cons
- Occasional unnatural color rendering in some challenging scenarios
- In video calls, mono-only audio capture impairs intelligibility in stereo-capable voice call situations
- Duplex handling issues; voices impaired by gating
The Apple MacBook Pro 14” established itself as the current reference for audiovisual performance, achieving the top scores for all tested use cases and features. It was simply excellent in all tested conditions.
Test summary
About DXOMARK Laptop tests: For scoring and analysis in our laptop reviews, DXOMARK engineers perform a variety of objective tests and undertake more than 20 hours of perceptual evaluations under controlled lab conditions and real-life scenarios.
(For more details about the Laptop protocol, click here.)
The following section gathers key elements of our exhaustive tests and analyses performed in DXOMARK laboratories. Detailed performance evaluations under the form of reports are available upon request. Do not hesitate to contact us.
DXOMARK's Video call use case is a score that evaluates how a device handles video calls and videoconferencing in multiple conditions. This score focuses on the camera performance and the capture and playback rendering of voices. Read more about how we test the use cases of Video call score here.
The MacBook Pro’s camera provided great detail in most tested conditions, as well as very good control of visual noise on well-exposed scenes. Exposure was accurate and stable in all situations.
Skins tones were accurate, but overall color rendering sometimes looked unnatural. Some artifacts such as ringing, quantization, and fringing were visible in most tested conditions. Audio capture of voices featured good, if slightly boomy, tonal balance. Envelopes were sharp and well preserved. Noise reduction is disabled by default, so noise levels were quite high. (The device relies more on videoconferencing apps to handle noise reduction.) Capture is mono only, which can impair intelligibility in stereo-capable voice call situations. Voice playback was excellent overall, with warm and realistic voices that were easily localizable and intelligible. Duplex situations induced some gating that may impair voice intelligibility in the most challenging situations.
The following chart presents the camera subscores for the video call use case:
The following graphs show the objective measurements performed in our camera labs:
The following chart presents the capture subscores for the video call use case:
The following graphs show the frequency response, distortion and directivity in capture, recorded in our semi-anechoic room:
Music & Video
Apple MacBook Pro 14" (2023)
154
DXOMARK's Video and Music use case score evaluates the capability of a device to reproduce multimedia usages such as videos, movies and music playback in indoor conditions. This score focuses on the display performance and audio-playback rendering. Read more about how we test this use case here.
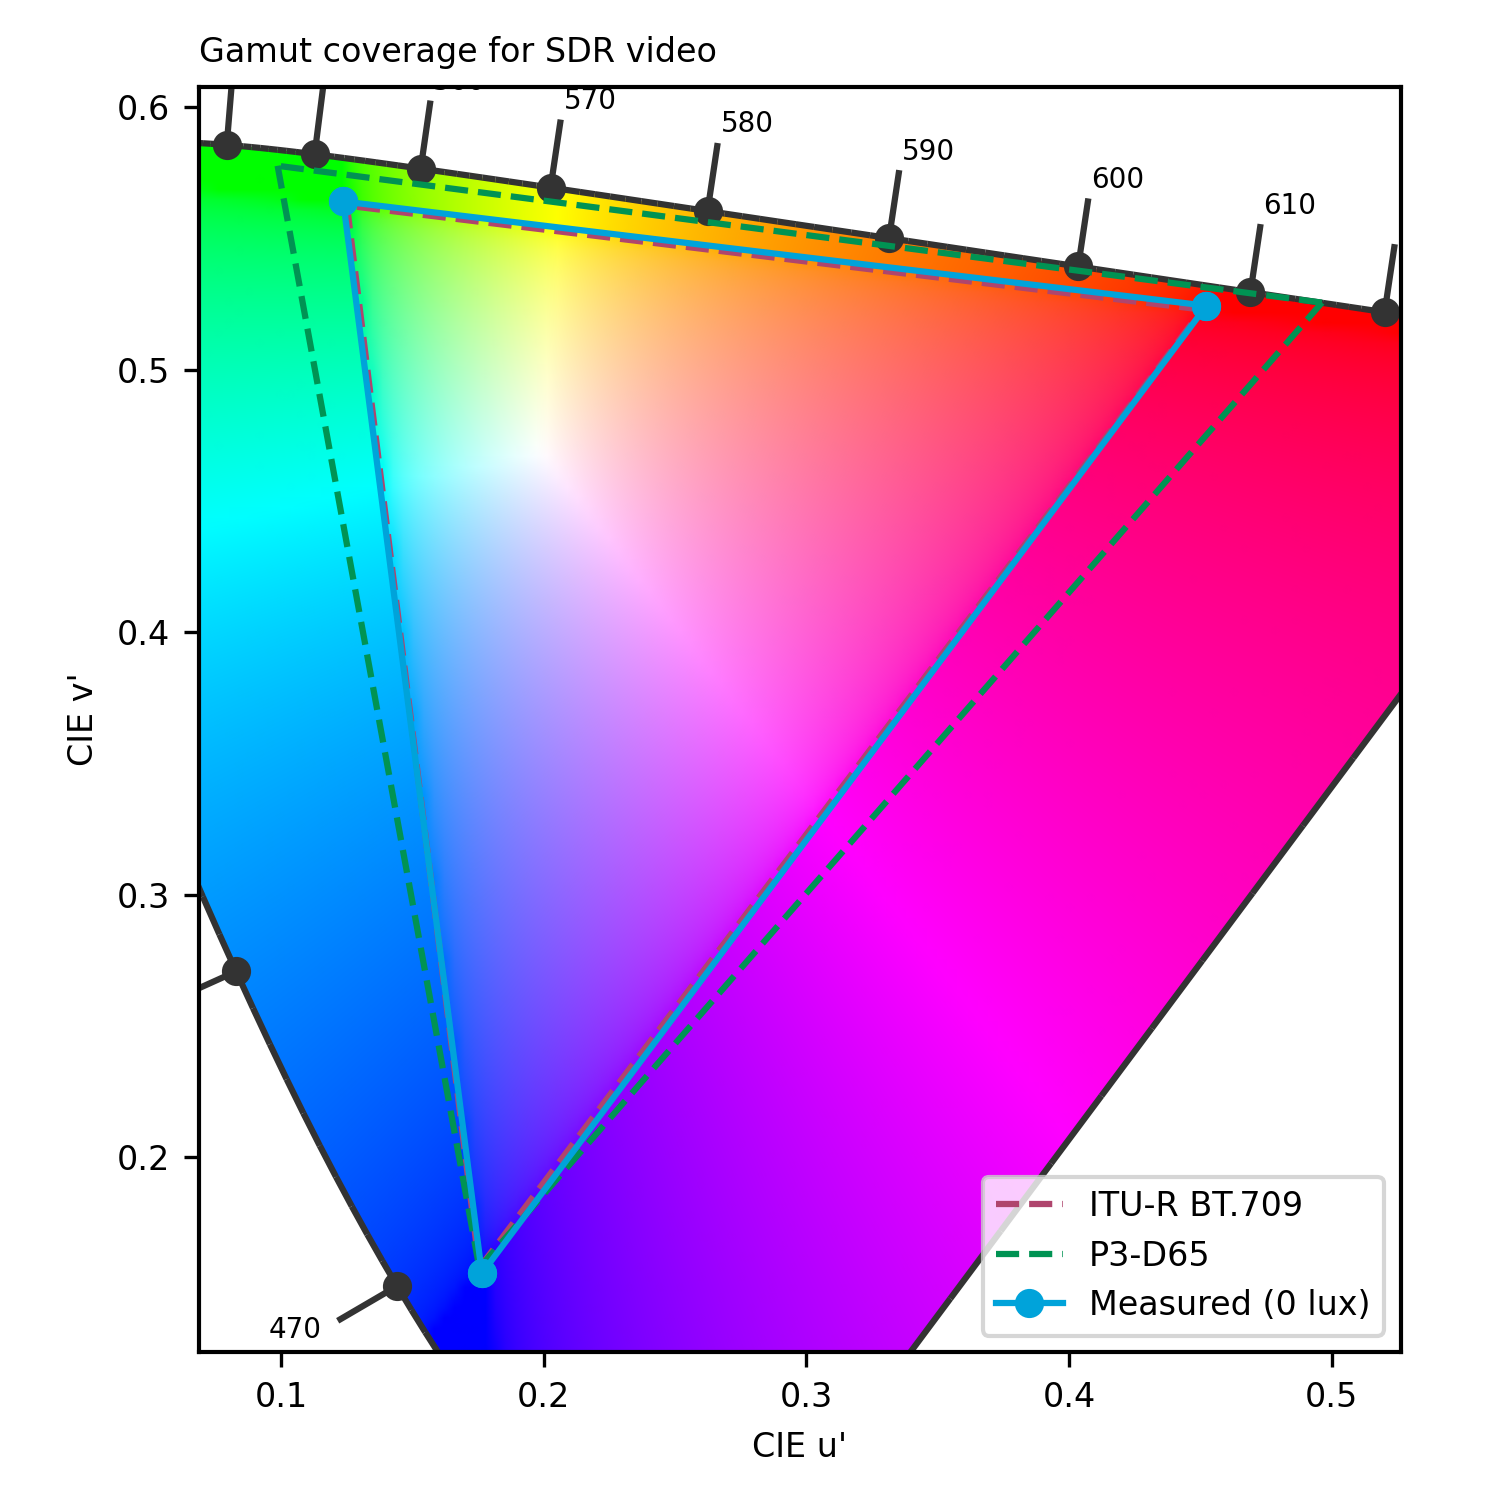
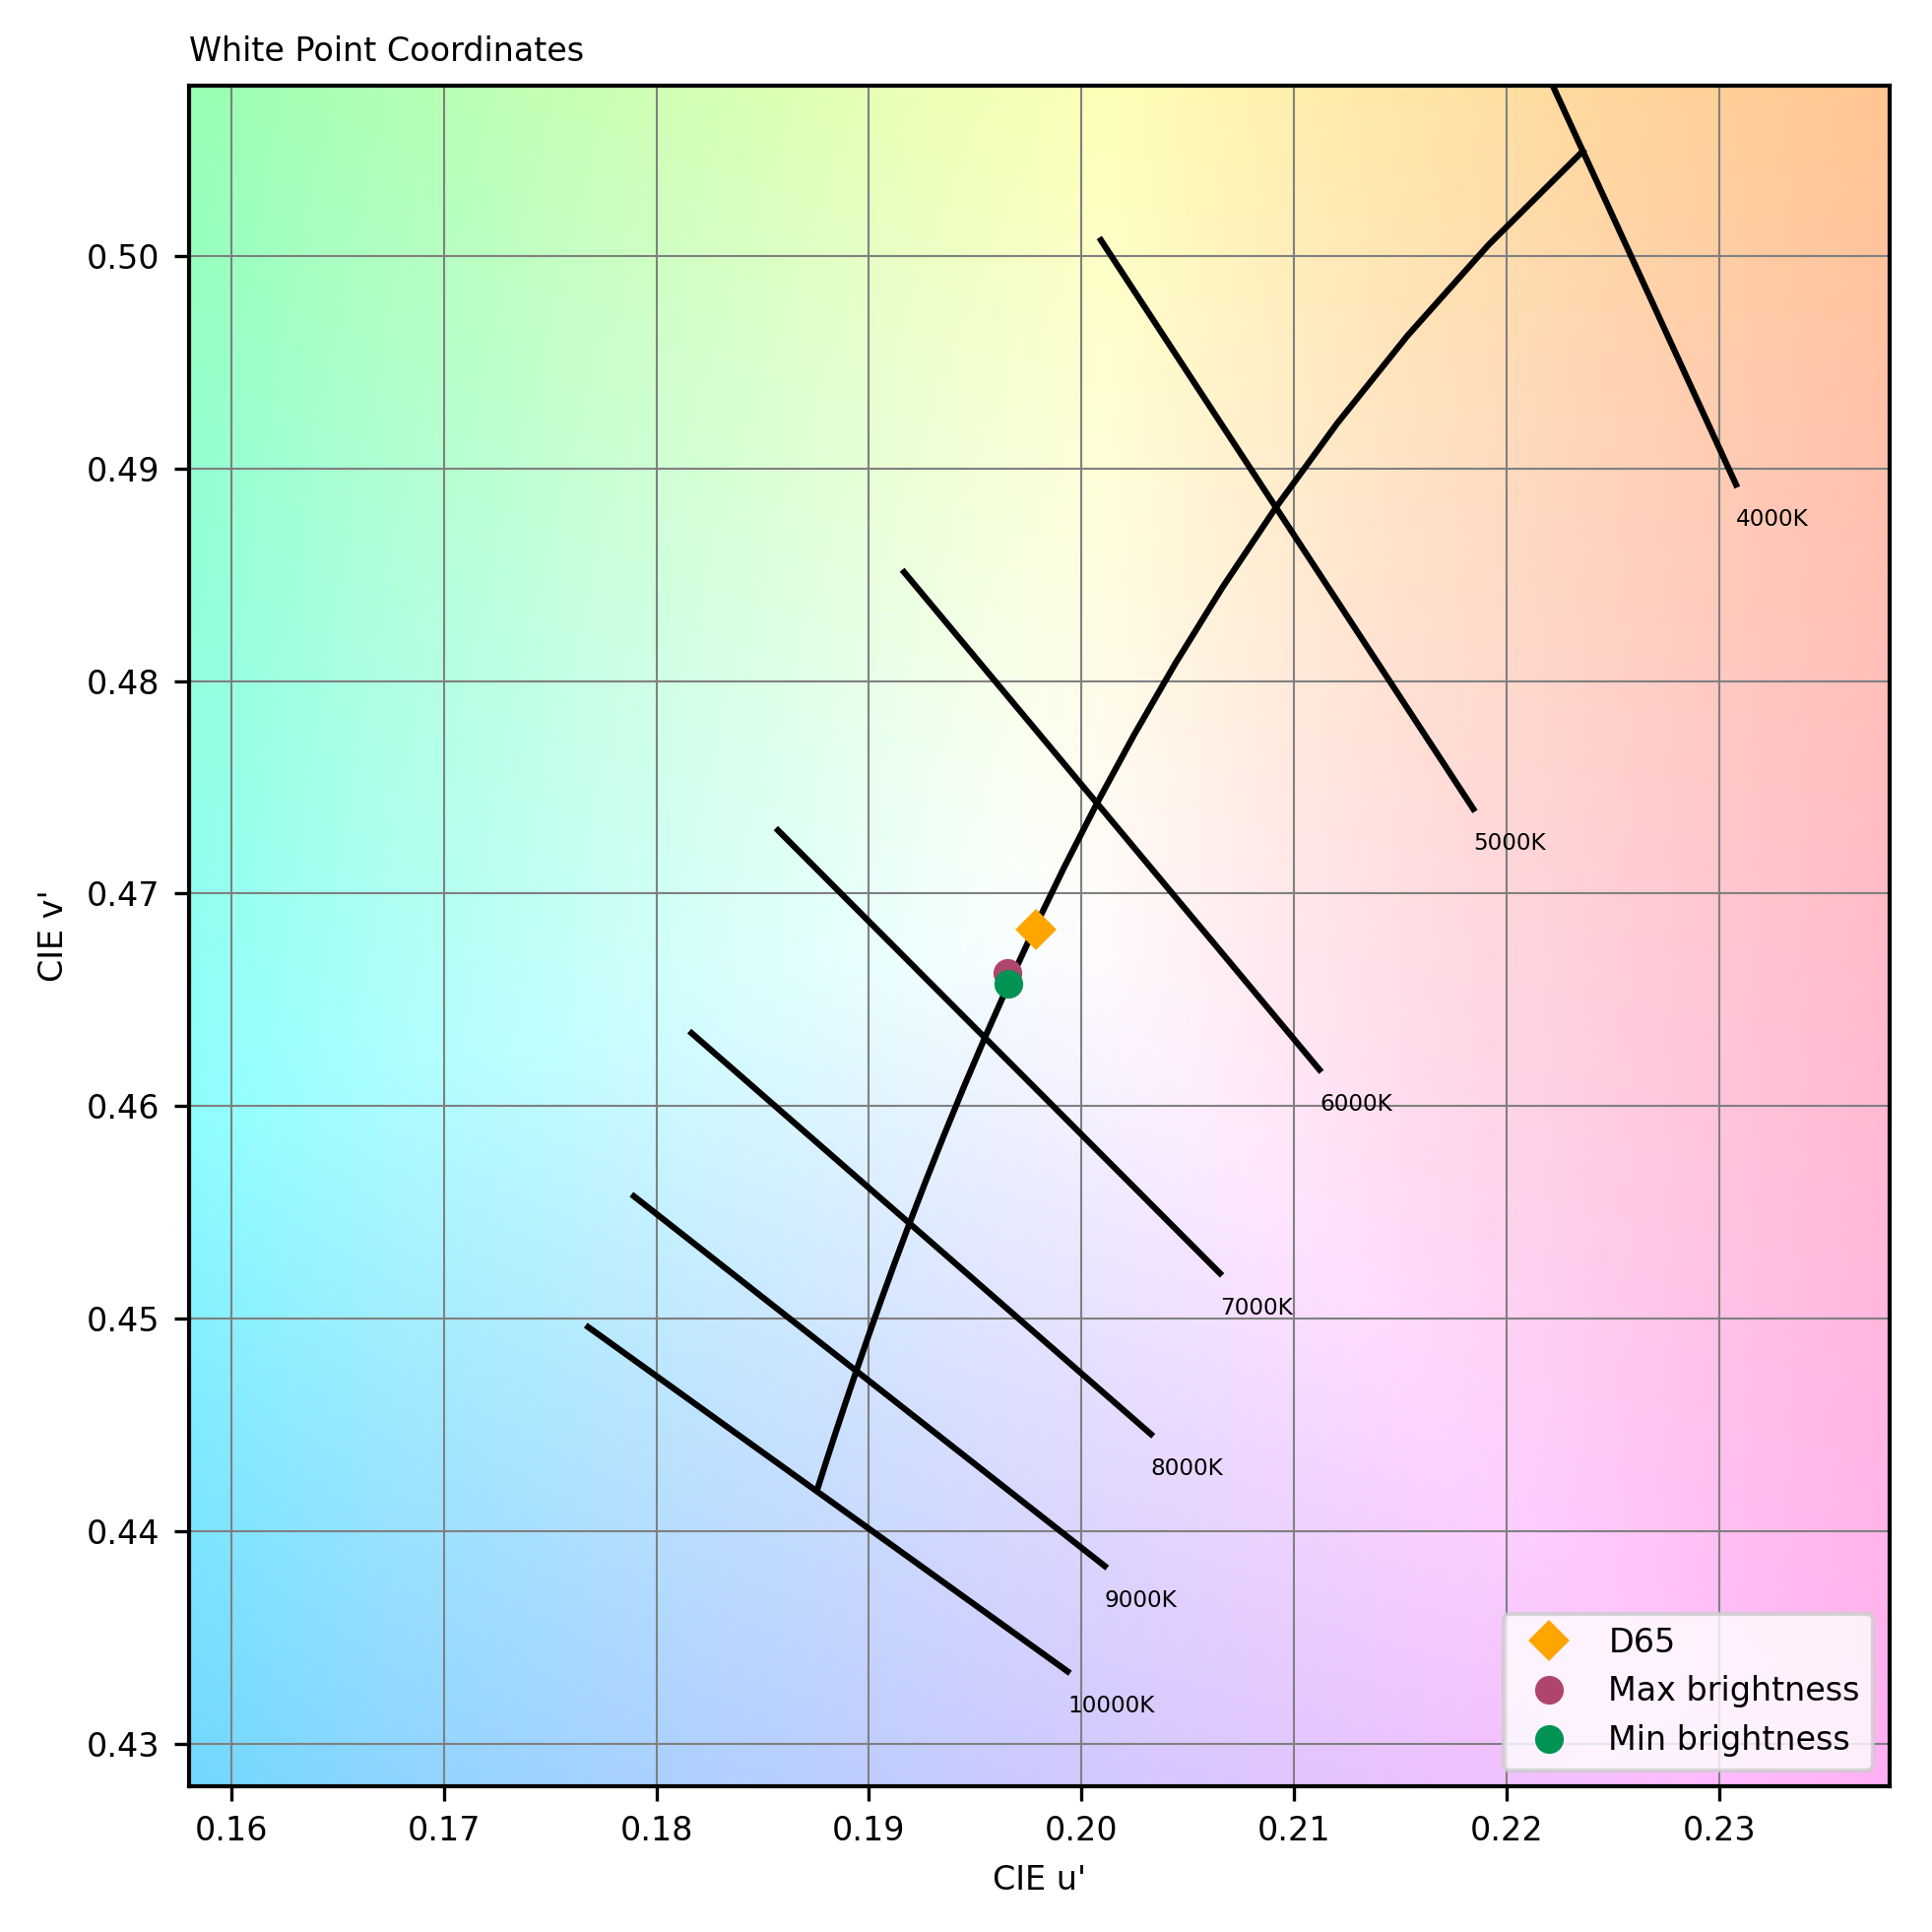
The MacBook Pro’s top-flight HDR rendering had a wide gamut, accurate EOTF, and very high peak measured brightness compared to other laptops. Its SDR rendering was not perfect though, with tones warm overall; and EOTF, while contrasted, looked unnatural. The display handled reflectance well. Audio rendering of multimedia content was excellent, with faithful and very pleasant tonal balance. Basses were deep (though sometimes slightly resonant), with more power than those of any other tested laptop. Dynamics were also excellent, with sharp and precise impacts and strong punch.
Display
Apple MacBook Pro 14" (2023)
156
The following chart presents the display subscores for the multimedia use case:
The following graphs show the objective measurements performed in our display lab:
cd/m²
cd/m²
cd/m²
cd/m²
cd/m²
cd/m²
cd/m²
cd/m²
cd/m²
 Distribution of brightness (min)
cd/m²
cd/m²
cd/m²
cd/m²
cd/m²
cd/m²
cd/m²
cd/m²
cd/m²
Distribution of brightness (max)
The following chart presents the playback for the multimedia use case:
The following graphs show the frequency response, distortion and directivity in multimedia playback, recorded in our semi-anechoic room:
DXOMARK encourages its readers to share comments on the articles. To read or post comments, Disqus cookies are required. Change your Cookies Preferences and read more about our Comment Policy.