We put the Asus ExpertBook B9 OLED through our rigorous DXOMARK Laptop test suite to measure its
performance in sound, camera and display. In this review, we will break down how it fared in a variety of tests and several common use cases.
Overview
Scoring
Use-case and feature subscores included in the calculations of the global score
 Asus ExpertBook B9 OLED

76
camera
53
Apple MacBook Pro 14" (M3 Pro, 2023)
Best: Apple MacBook Pro 14" (M3 Pro, 2023) (93)
42
Lenovo ThinkPad X9 Aura
Best: Lenovo ThinkPad X9 Aura (56)
57
Microsoft Surface Laptop 13-inch
Best: Microsoft Surface Laptop 13-inch (79)
65
Apple MacBook Pro 14" (M2 Pro, 2023)
Best: Apple MacBook Pro 14" (M2 Pro, 2023) (83)
120
display
57
Apple MacBook Pro 14" (M3 Pro, 2023)
Best: Apple MacBook Pro 14" (M3 Pro, 2023) (84)
65
Apple MacBook Pro 14" (M3 Pro, 2023)
Best: Apple MacBook Pro 14" (M3 Pro, 2023) (95)
76
Honor MagicBook View 14 (2022)
Best: Honor MagicBook View 14 (2022) (84)
125
audio
124
Apple MacBook Pro 14" (M2 Pro, 2023)
Best: Apple MacBook Pro 14" (M2 Pro, 2023) (149)
130
Acer Swift Go 14
Best: Acer Swift Go 14 (133)
87
Asus Zenbook 14X OLED (2023)
Best: Asus Zenbook 14X OLED (2023) (153)
Pros
- Excellent OLED display contrast
- Good audio capture during video calls
Cons
- Disappointing camera performance
- Poor handling of duplex speech
- Glossy screen reduces readability in bright environments
- Unpleasant timbre with built-in speakers
The Asus ExpertBook B9 OLED put in a decent all-round display and audio performance for both video call and multimedia purposes, although its camera performance pulled down the laptop’s overall placement in our ranking. During calls, its internal microphones provided good audio quality, but duplex speech was impossible as voices would completely cut each other off. For video & music, the laptop’s OLED display had excellent contrast, but inadequate maximum brightness, and overall glossiness made the screen hard to read in a bright lighting environment; in addition, playback timbre was somewhat unpleasant.
Test summary
About DXOMARK Laptop tests: For scoring and analysis in our laptop reviews, DXOMARK engineers perform a variety of objective tests and undertake more than 20 hours of perceptual evaluations under controlled lab conditions and real-life scenarios. (For more details about the Laptop protocol, click here.)
The following section gathers key elements of our exhaustive tests and analyses performed in DXOMARK laboratories. Detailed performance evaluations under the form of reports are available upon request. Do not hesitate to contact us.
Asus ExpertBook B9 OLED overall & use-cases scores
Video Call
118
Apple MacBook Pro 14" (M2 Pro, 2023)
Apple MacBook Pro 14" (M2 Pro, 2023)
About DXOMARK Laptop tests
DXOMARK's Video call use case is a score that evaluates how a device handles video calls and videoconferencing in multiple conditions. This score focuses on the camera performance and the capture and playback rendering of voices.
The Asus ExpertBook B9 OLED’s camera had fairly good texture rendering, albeit hampered by a loss of fine details. Further, exposure instabilities and strong clipping were often visible, and color rendering was often inaccurate. Our engineers found it impossible to record usable low-light videos. The laptop had nice audio capture quality during video calls, but the device produced a high-frequency noise at all times, which could be annoying for a person on the receiving end of the call.
Camera
76
Apple MacBook Pro 14" (M3 Pro, 2023)
Apple MacBook Pro 14" (M3 Pro, 2023)
Camera texture acutance on Deadleaves with illuminance levels
This graph shows the evolution of texture acutance with the level of lux measured on a Deadleaves chart.
The following graphs show the objective measurements performed in our camera labs:
Camera visual noise evolution with illuminance levels
This graph shows the evolution of spatial visual noise with the level of lux. Spatial visual noise is measured on the visual noise chart in the video noise setup. DXOMARK visual noise measurement is derived from ISO15739 standard.
Target exposure on face with illuminance levels
These measurements take place on a setup combining realistic mannequins and a backlit panel simulating high dynamic range conditions. This graph shows the evolution of lightness measured on the forehead of the realistic mannequin with the level of lux, for multiple lighting conditions. The lightness is measured in L*. Delta EV specifies the difference of luminance in stops between the face and the light panel simulating HDR conditions.
Target exposure on face with illuminance levels in HDR conditions
These measurements take place on a setup combining realistic mannequins and a backlit panel simulating high dynamic range conditions. This graph shows the evolution of lightness measured on the forehead of the realistic mannequin with the level of lux, for multiple lighting conditions. The lightness is measured in L*. Delta EV specifies the difference of luminance in stops between the face and the light panel simulating HDR conditions.
Audio
130
Apple MacBook Pro 14" (M2 Pro, 2023)
Apple MacBook Pro 14" (M2 Pro, 2023)
Audio capture scores comparison
The following graphs show the frequency response, distortion and directivity in capture, recorded in our semi-anechoic room:
Audio capture frequency response
A 1/12 octave frequency response graph, which measures the volume of each frequency captured by the laptop when recording an objective test signal at 1 meter in an anechoic environment.
Audio capture Total Harmonic Distortion + Noise
This graph shows the Total Harmonic Distortion and Noise over the hearable frequency range. It represents the distortion and noise of the device capturing our test signal.
Audio capture directivity
Directivity graph of the laptop microphone(s) when capturing test signals using the camera app. It represents the acoustic energy (in dB) over the angle of incidence of the sound source (normalized to the angle 0°, in front of the device).
About DXOMARK Laptop tests
DXOMARK's Video and Music use case score evaluates the capability of a device to reproduce multimedia usages such as videos, movies and music playback in indoor conditions. This score focuses on the display performance and audio-playback rendering.
The ExpertBook B9 OLED display had good color rendering and gamut adaptation for HDR and SDR videos, and offered excellent contrast. As mentioned above, the glossy screen impaired readability in a bright environment, and its maximum brightness was only around 400 nits, except when watching HDR content, where its brightness was around 600 nits. The placement of its speakers provided pleasant spatial sound during playback, although the overall timbre was not pleasing.
The following chart presents the display subscores for the multimedia use case:
Display scores comparison
The following graphs show the objective measurements performed in our display lab:
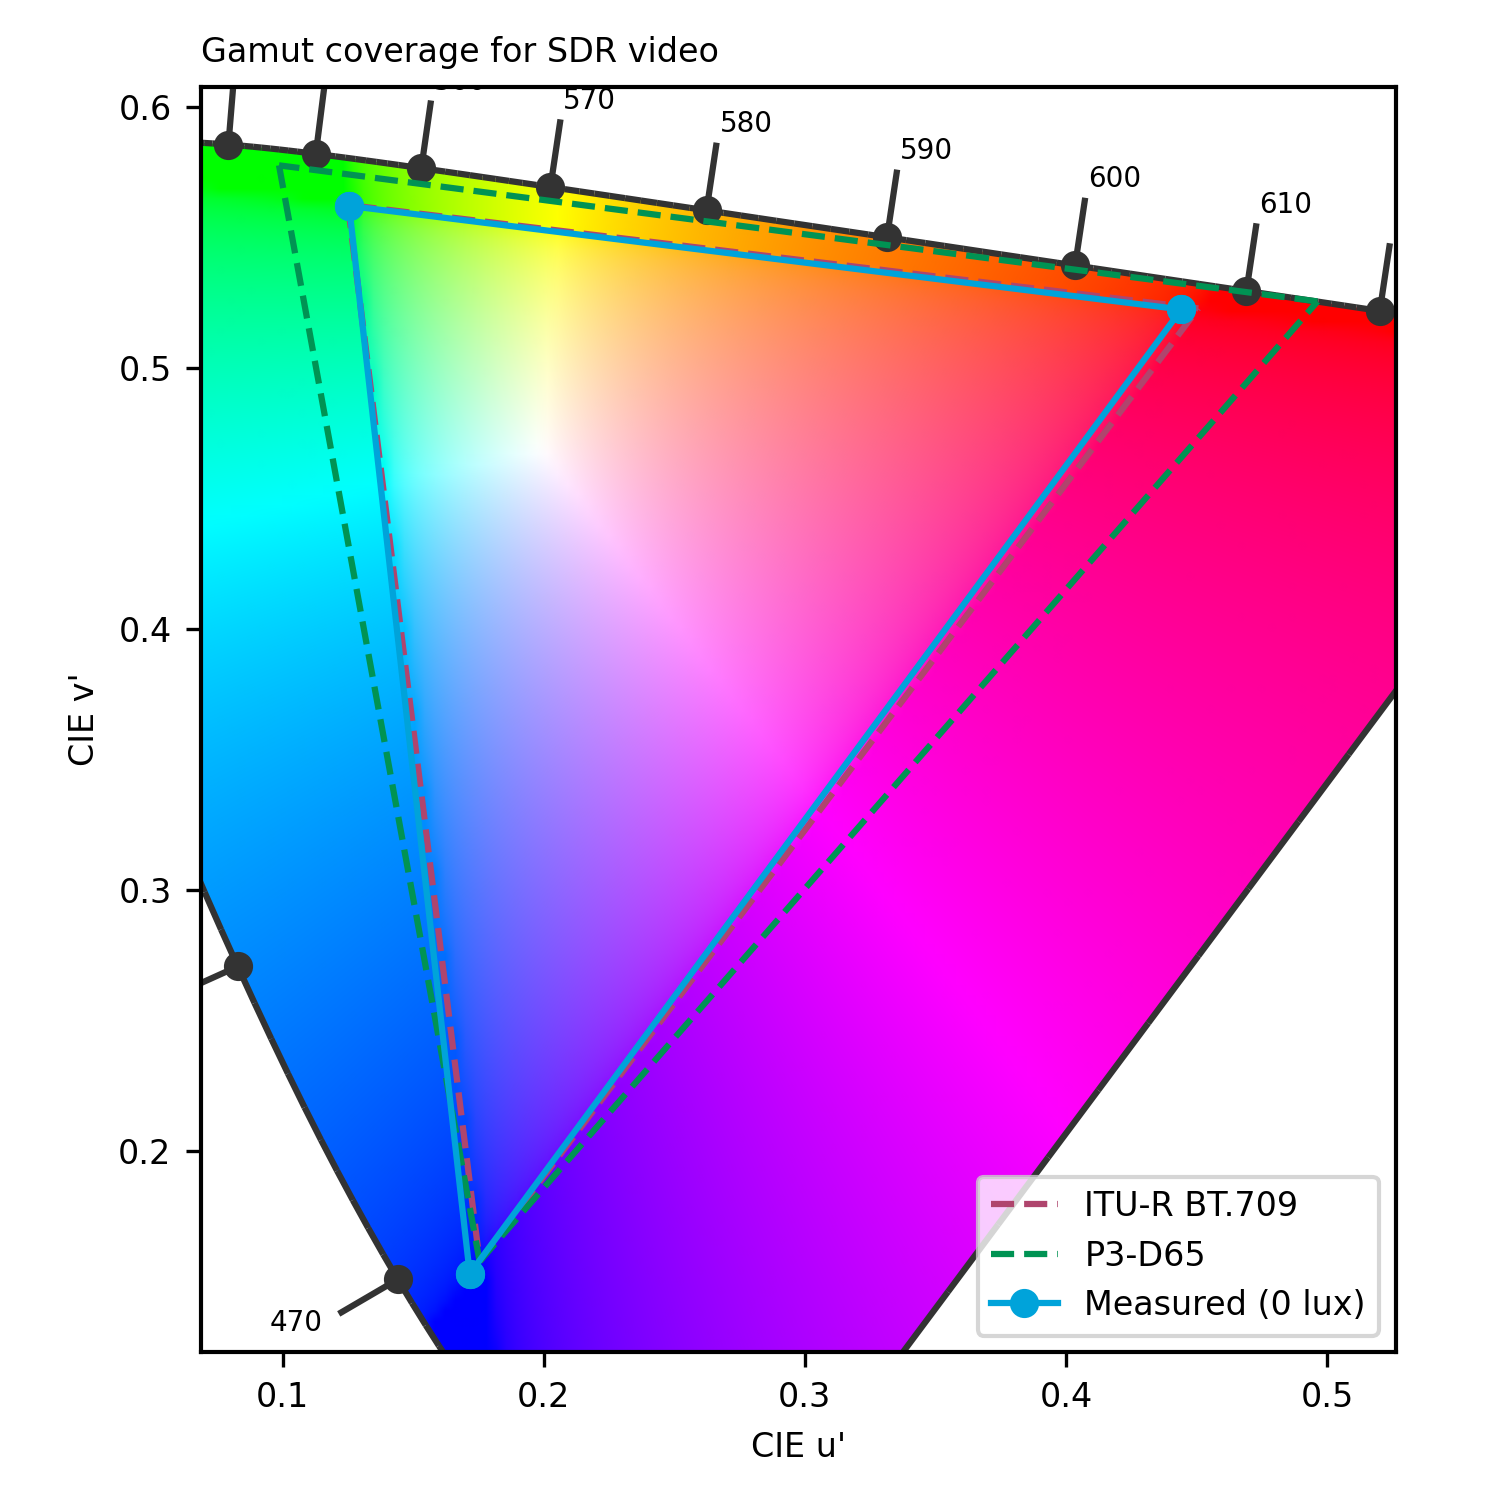
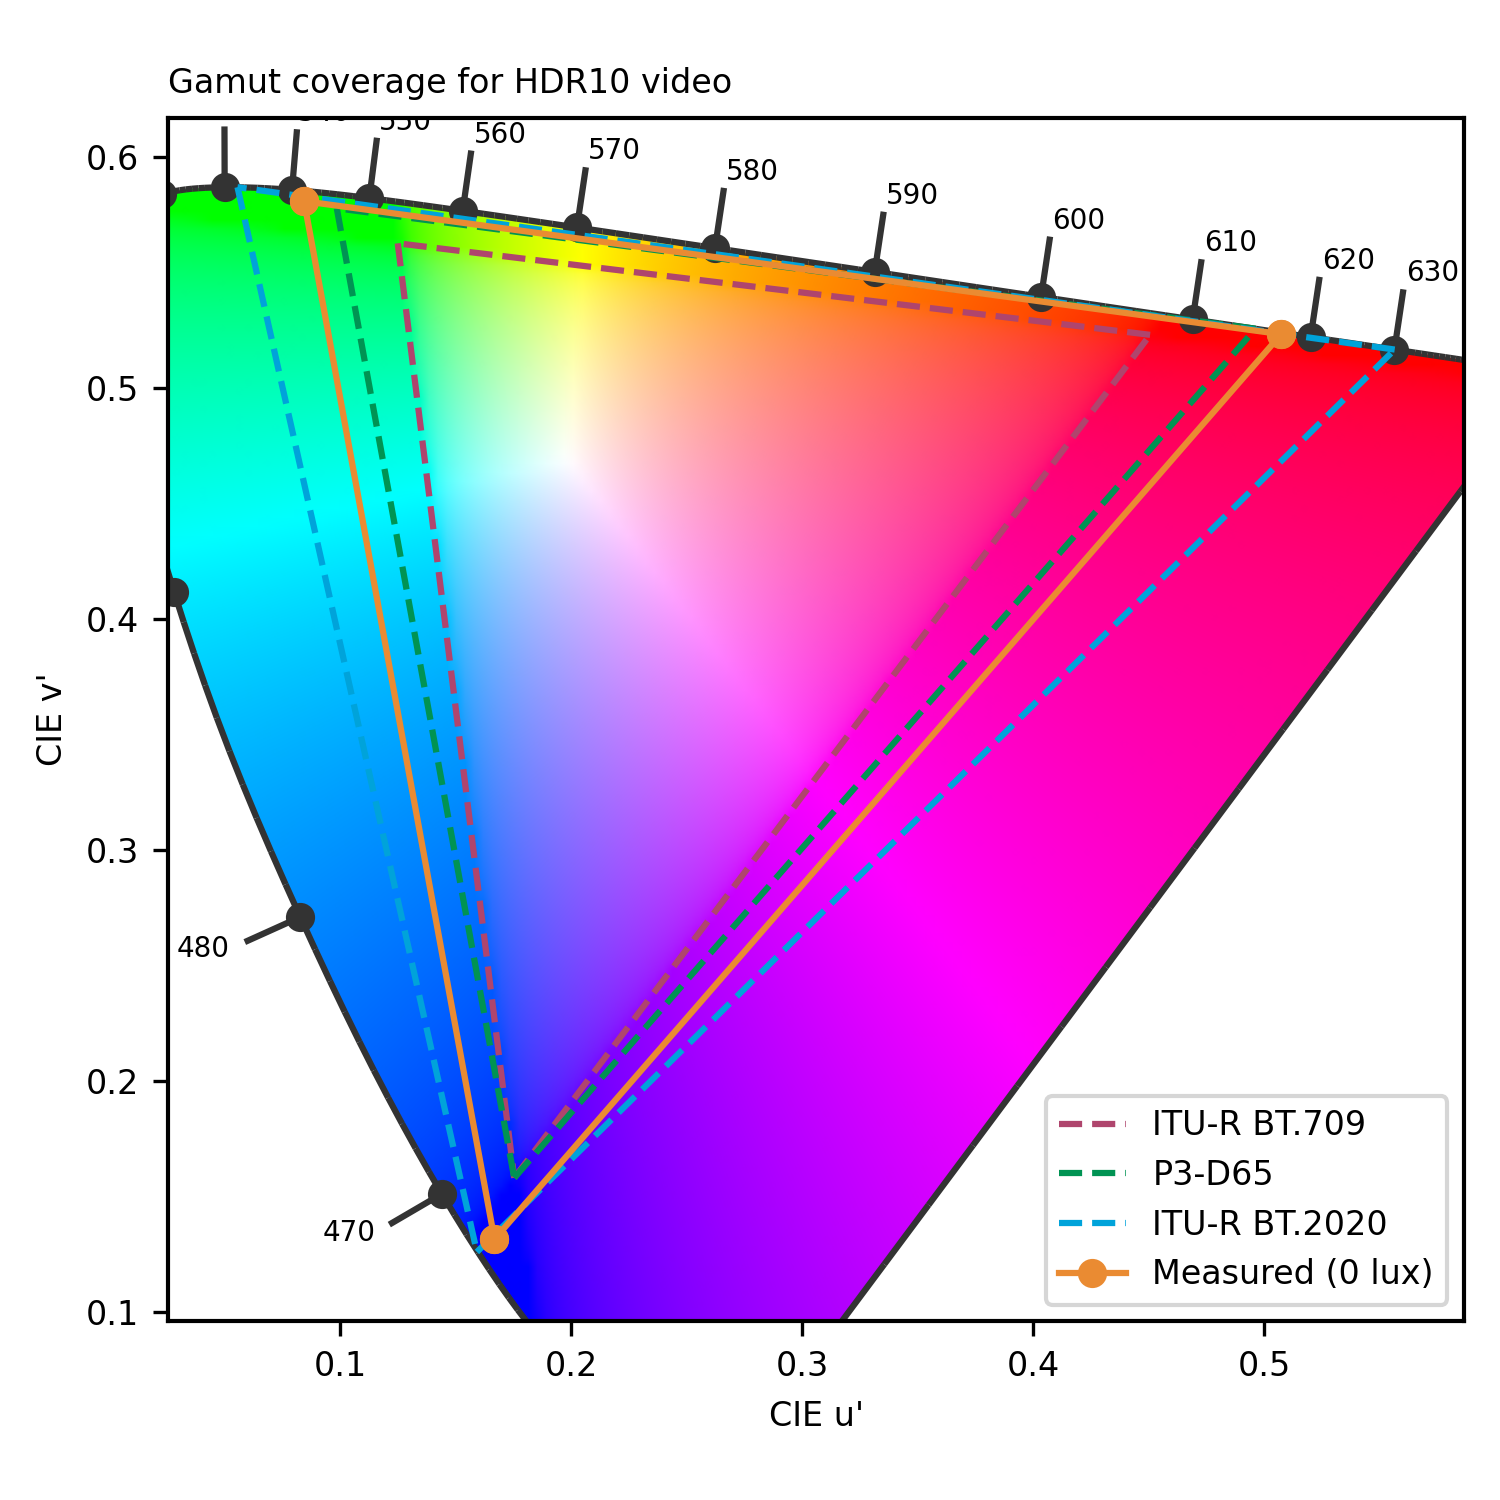
Display gamut coverage for video contents
The primary colors are measured both in HDR10 and SDR. The extracted color gamut shows the extent of the color area that the device can render. To respect the artistic intent, the measured gamut should match the master color space of each video.
Display reflectance measurement (SCI)
Measurements above show the reflection of the device within the visible spectrum range (400 nm to 700 nm). It includes both diffuse and specular reflection.
Display reflectance profile
Display brightness uniformity
0.068
cd/m²
0.055
cd/m²
0.054
cd/m²
0.082
cd/m²
0.039
cd/m²
0.06
cd/m²
0.06
cd/m²
0.032
cd/m²
0.045
cd/m²
 Distribution of brightness (min)
400
cd/m²
397.8
cd/m²
398.2
cd/m²
393.8
cd/m²
394
cd/m²
396.6
cd/m²
395.8
cd/m²
394.4
cd/m²
400.6
cd/m²
Distribution of brightness (max)
This illustration shows the brightness measured on nine zones of the display for minimum brightness (left) and maximum brightness (right) for SDR content.
Display SDR EOTF measurement
This graph represents the rendering of contrast (gray levels) for SDR video content, measured in the dark. We expect to be close to the 2.2 or 2.4 gamma references.
Display peak brightness for video contents
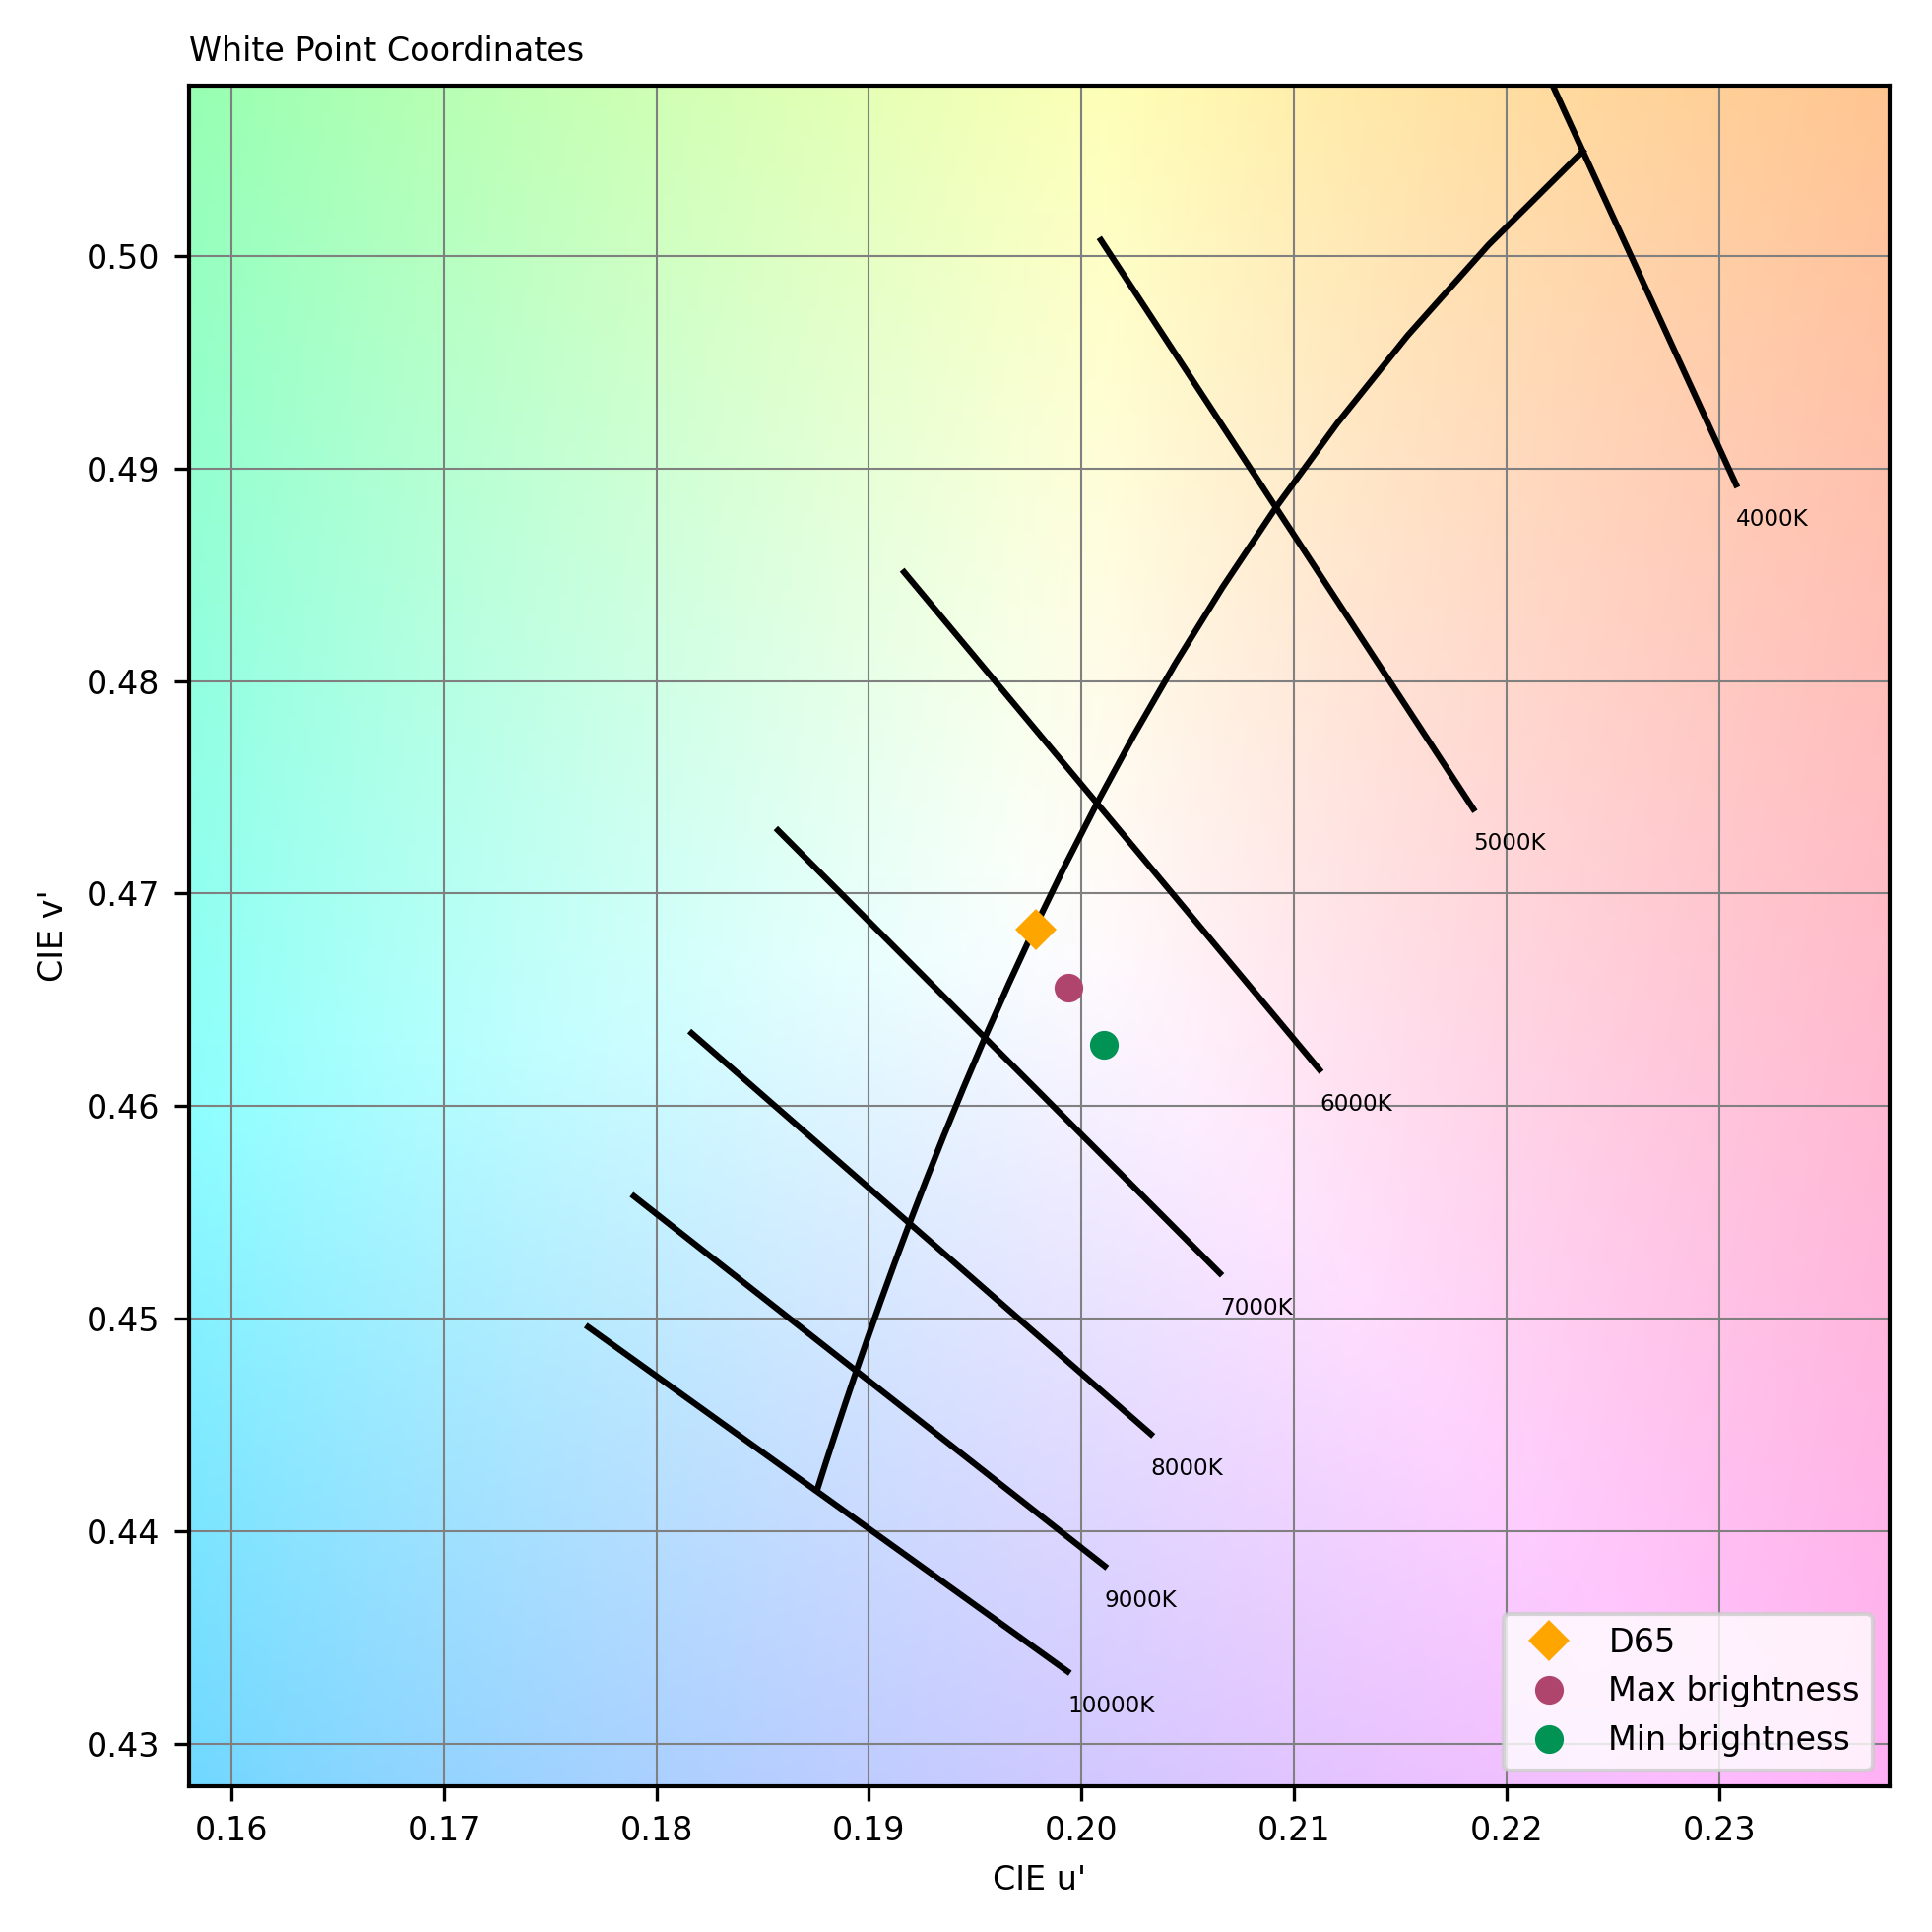
Display white point
This graph represents the color temperature of white content, compared with the reference (Daylight illuminant D65) measured in the dark on video at minimum and maximum brightness.
The following chart presents the playback for the multimedia use case:
Audio playback scores comparison
The following graphs show the frequency response, distortion and directivity in multimedia playback, recorded in our semi-anechoic room:
Audio playback frequency response
A 1/12 octave frequency response graph, which measures the volume of each frequency emitted by the laptop when playing a pure-sine wave in an anechoic environment.