We put the Asus Zenbook 14X OLED (2023) through our rigorous DXOMARK Laptop test suite to measure its performance both at sound, camera and display.
In this review, we will break down how it fared in a variety of tests and several common use cases.
Overview
Key specifications include (as given by the manufacturer):
- Physical specs : 22.3 x 31.2 x 1.6 cm
- Display : 14.5”, OLED 2800×1800, 120Hz, 400nits, 100% DCI-P3, Glossy
- Audio : Dolby Atmos, Stereo, Harman-Kardon certified, Dual-mic array, Two-Way AI Noise cancelation
- Webcam : Full HD webcam
Scoring
Use-case and feature subscores included in the calculations of the global score
 Asus Zenbook 14X OLED (2023)

88
camera
64
Apple MacBook Pro 14" (M3 Pro, 2023)
Best: Apple MacBook Pro 14" (M3 Pro, 2023) (93)
37
Lenovo ThinkPad X9 Aura
Best: Lenovo ThinkPad X9 Aura (56)
52
Microsoft Surface Laptop 13-inch
Best: Microsoft Surface Laptop 13-inch (79)
69
Apple MacBook Pro 14" (M2 Pro, 2023)
Best: Apple MacBook Pro 14" (M2 Pro, 2023) (83)
113
display
50
Apple MacBook Pro 14" (M3 Pro, 2023)
Best: Apple MacBook Pro 14" (M3 Pro, 2023) (84)
65
Apple MacBook Pro 14" (M3 Pro, 2023)
Best: Apple MacBook Pro 14" (M3 Pro, 2023) (95)
76
Honor MagicBook View 14 (2022)
Best: Honor MagicBook View 14 (2022) (84)
143
audio
143
Apple MacBook Pro 14" (M2 Pro, 2023)
Best: Apple MacBook Pro 14" (M2 Pro, 2023) (149)
118
Acer Swift Go 14
Best: Acer Swift Go 14 (133)
153
Asus Zenbook 14X OLED (2023)
Pros
- In video call, generally pleasant skin tone rendering while running video calls
- In video call, wide and detailed stereo in capture
- In video call, good handling of duplex (more than one person speaking at the same time)
- In music & video, good HDR experience with wide color gamut
- In music & video, immersive audio experience with precise spatial rendering
Cons
- In video call, low face exposure in high dynamic range scenes
- In music & video, raised blacks in SDR video contents at maximum brightness decrease perceived contrast
The Asus Zenbook 14X OLED laptop turned the best audio performance for among all Windows laptops tested. Its camera performance was only average, however, and while its display offered a good HDR experience, it lacked readability. The device did better in the video call use case than it did in the multimedia use case.
Test summary
About DXOMARK Laptop tests: For scoring and analysis in our laptop reviews, DXOMARK engineers perform a variety of objective tests and undertake more than 20 hours of perceptual evaluations under controlled lab conditions and real-life scenarios.
(For more details about the Laptop protocol, click here.)
The following section gathers key elements of our exhaustive tests and analyses performed in DXOMARK laboratories. Detailed performance evaluations under the form of reports are available upon request. Do not hesitate to contact us.
Asus Zenbook 14X OLED (2023) overall & use-cases scores
Video Call
126
Asus Zenbook 14X OLED (2023)
144
Apple MacBook Pro 14" (M2 Pro, 2023)
Apple MacBook Pro 14" (M2 Pro, 2023)
About DXOMARK Laptop tests
DXOMARK's Video call use case is a score that evaluates how a device handles video calls and videoconferencing in multiple conditions. This score focuses on the camera performance and the capture and playback rendering of voices. Read more about how we test the use cases of Video call score here.
With average results for all camera test attributes, the Asus device’s camera provided generally pleasant skin tone rendering, but underexposed faces in high dynamic range scenes. The Zenbook 14X had excellent audio performance for video calls both for playback and capture, with wide and detailed stereo recording and good handling of duplex situations.
Camera
88
Asus Zenbook 14X OLED (2023)
135
Apple MacBook Pro 14" (M3 Pro, 2023)
Apple MacBook Pro 14" (M3 Pro, 2023)
The following chart presents the camera subscores for the video call use case:
Camera texture acutance on Deadleaves with illuminance levels
This graph shows the evolution of texture acutance with the level of lux measured on a Deadleaves chart.
The following graphs show the objective measurements performed in our camera labs:
Camera visual noise evolution with illuminance levels
This graph shows the evolution of spatial visual noise with the level of lux. Spatial visual noise is measured on the visual noise chart in the video noise setup. DXOMARK visual noise measurement is derived from ISO15739 standard.
Target exposure on face with illuminance levels
These measurements take place on a setup combining realistic mannequins and a backlit panel simulating high dynamic range conditions. This graph shows the evolution of lightness measured on the forehead of the realistic mannequin with the level of lux, for multiple lighting conditions. The lightness is measured in L*. Delta EV specifies the difference of luminance in stops between the face and the light panel simulating HDR conditions.
Target exposure on face with illuminance levels in HDR conditions
These measurements take place on a setup combining realistic mannequins and a backlit panel simulating high dynamic range conditions. This graph shows the evolution of lightness measured on the forehead of the realistic mannequin with the level of lux, for multiple lighting conditions. The lightness is measured in L*. Delta EV specifies the difference of luminance in stops between the face and the light panel simulating HDR conditions.
Audio
143
Asus Zenbook 14X OLED (2023)
144
Apple MacBook Pro 14" (M2 Pro, 2023)
Apple MacBook Pro 14" (M2 Pro, 2023)
The following chart presents the capture subscores for the video call use case:
Audio capture scores comparison
The following graphs show the frequency response, distortion and directivity in capture, recorded in our semi-anechoic room:
Audio capture frequency response
A 1/12 octave frequency response graph, which measures the volume of each frequency captured by the laptop when recording an objective test signal at 1 meter in an anechoic environment.
Audio capture Total Harmonic Distortion + Noise
This graph shows the Total Harmonic Distortion and Noise over the hearable frequency range. It represents the distortion and noise of the device capturing our test signal.
Audio capture directivity
Directivity graph of the laptop microphone(s) when capturing test signals using the camera app. It represents the acoustic energy (in dB) over the angle of incidence of the sound source (normalized to the angle 0°, in front of the device).
About DXOMARK Laptop tests
DXOMARK's Video and Music use case score evaluates the capability of a device to reproduce multimedia usages such as videos, movies and music playback in indoor conditions. This score focuses on the display performance and audio-playback rendering. Read more about how we test this use case here.
The laptop’s display at maximum brightness raised blacks in SDR video content, thus decreasing perceived contrast. The screen had faithful color rendering in SDR and HDR, thanks to good gamut coverage. It showed a wide color gamut in HDR, but colors were generally oversaturated. Readability was lower than average, with a highly reflective panel showing very noticeable light reflections. The audio system provided wide and precise spatial rendering, but bass power and low-end extension were lacking. Loud volumes had good punch and dynamics, but the device could use better tuning to improve medium and low volume performance.
The following chart presents the display subscores for the multimedia use case:
Display scores comparison
The following graphs show the objective measurements performed in our display lab:
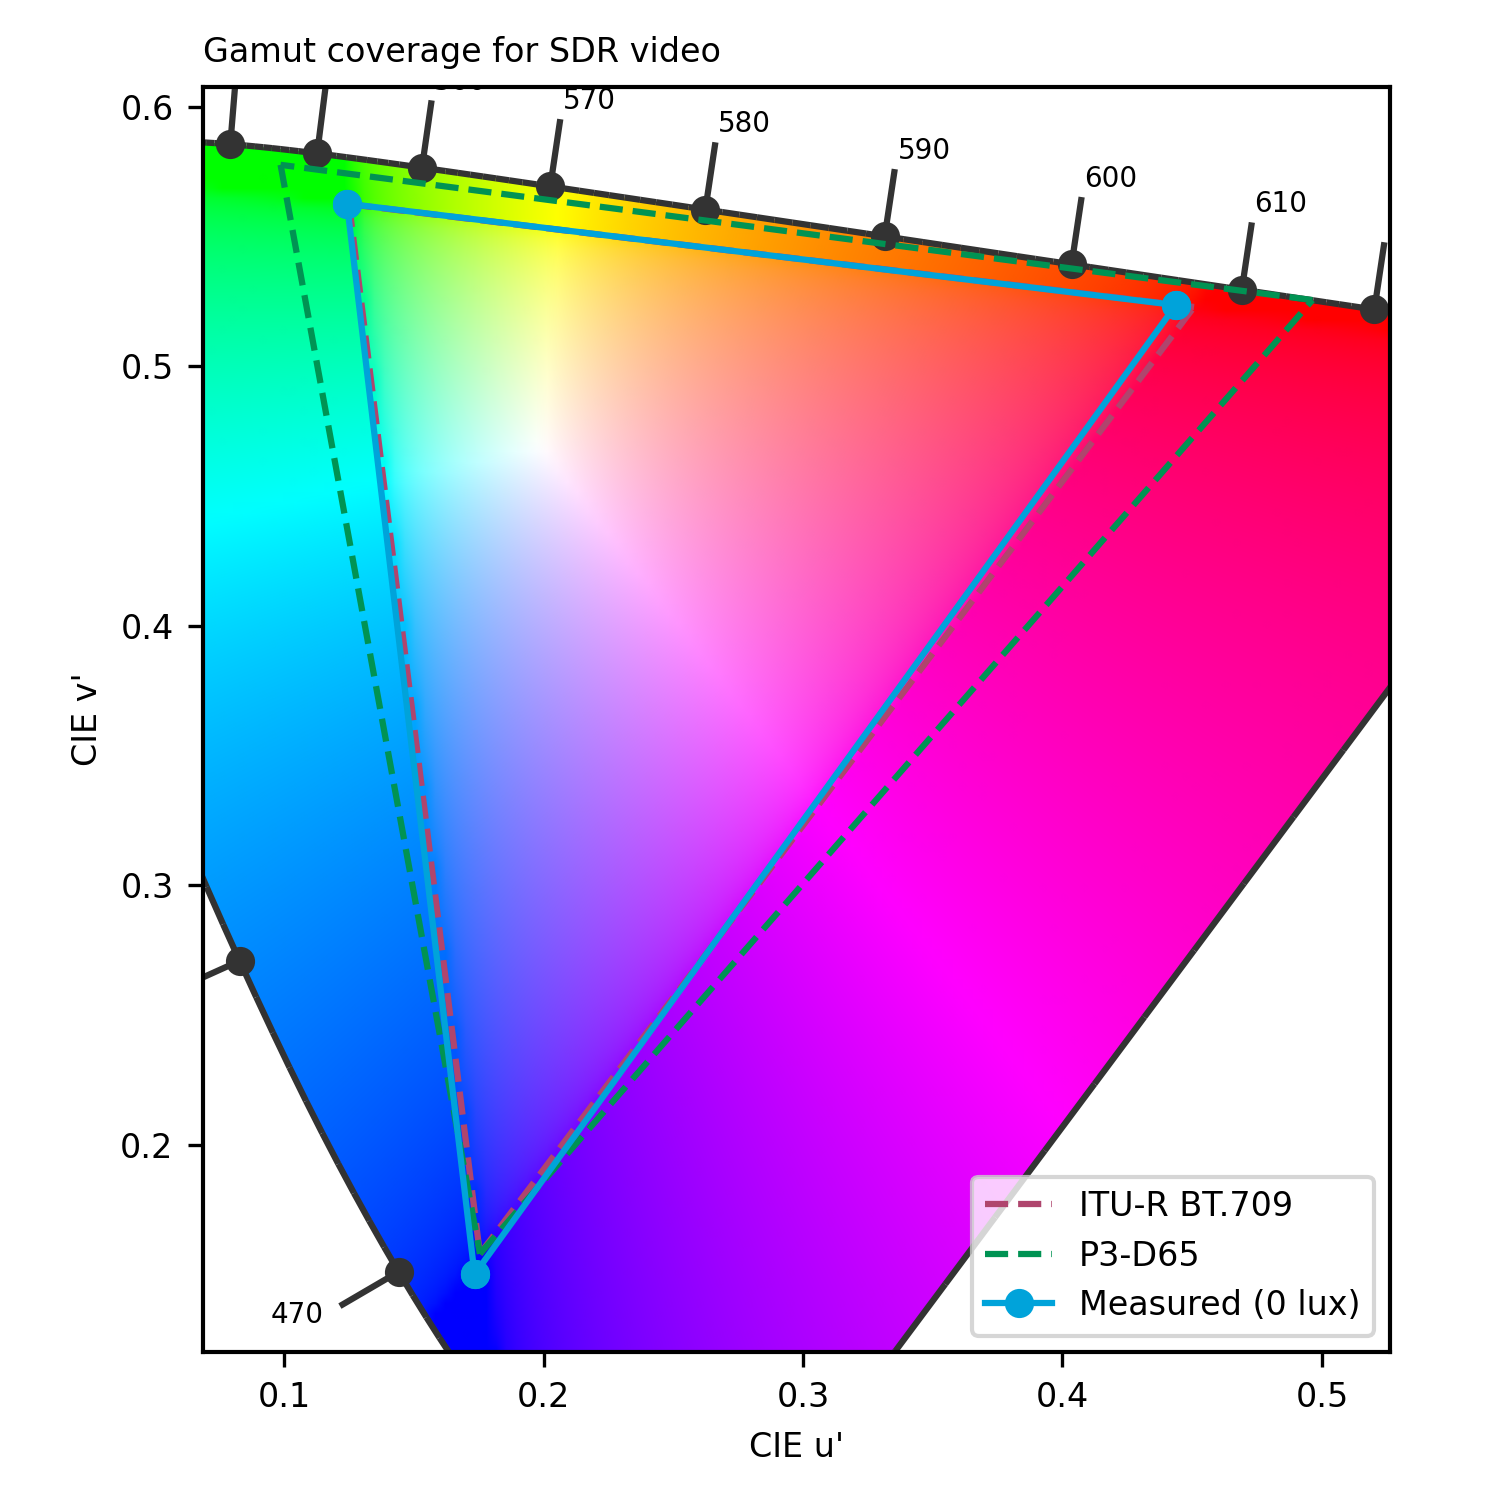
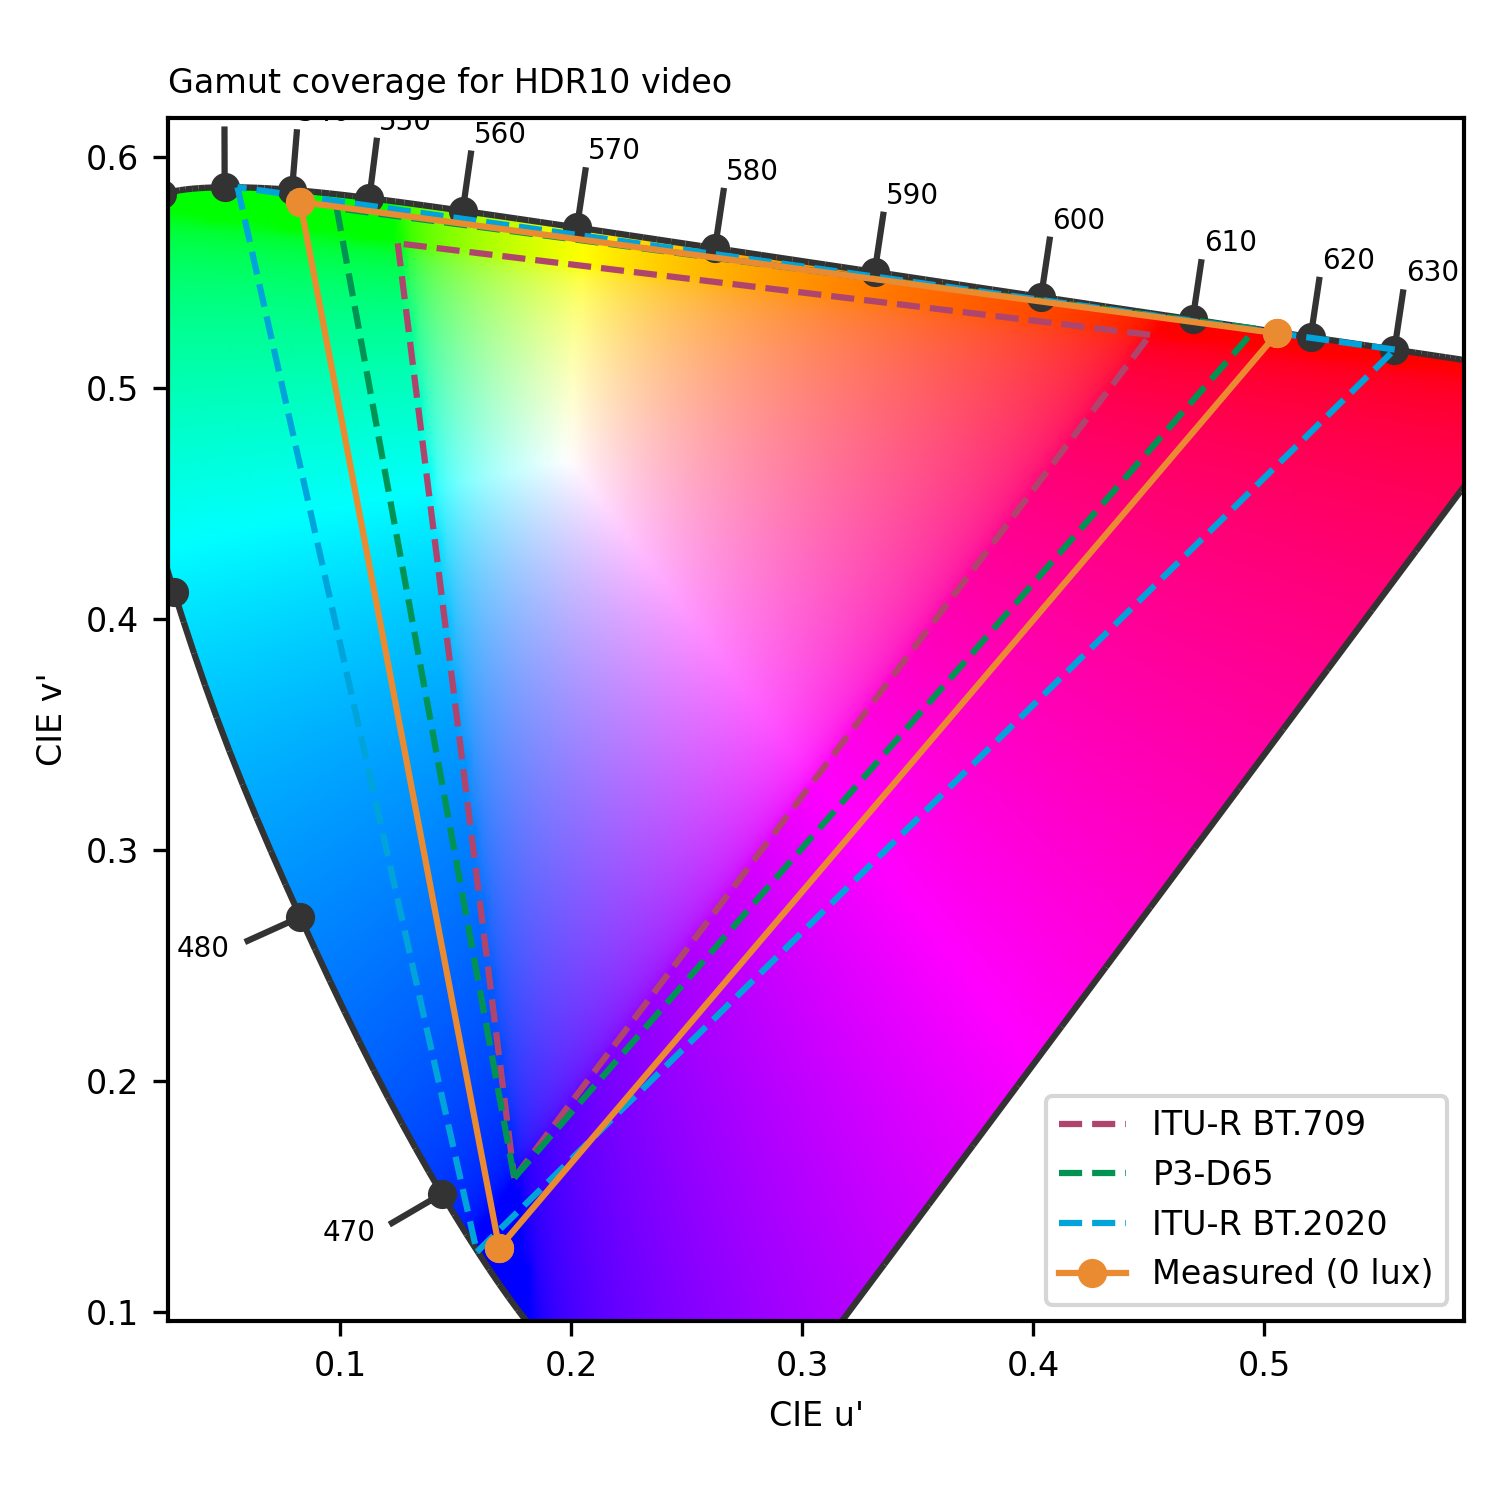
Display gamut coverage for video contents
The primary colors are measured both in HDR10 and SDR. The extracted color gamut shows the extent of the color area that the device can render. To respect the artistic intent, the measured gamut should match the master color space of each video.
Display reflectance measurement (SCI)
Measurements above show the reflection of the device within the visible spectrum range (400 nm to 700 nm). It includes both diffuse and specular reflection.
Display reflectance profile
Display brightness uniformity
0.133
cd/m²
0.036
cd/m²
0.041
cd/m²
0.095
cd/m²
0.031
cd/m²
0.036
cd/m²
0.08
cd/m²
0.027
cd/m²
0.037
cd/m²
 Distribution of brightness (min)
389.9
cd/m²
383.7
cd/m²
388.2
cd/m²
388.6
cd/m²
384.3
cd/m²
389.6
cd/m²
385
cd/m²
385.6
cd/m²
390.1
cd/m²
Distribution of brightness (max)
This illustration shows the brightness measured on nine zones of the display for minimum brightness (left) and maximum brightness (right) for SDR content.
Display SDR EOTF measurement
This graph represents the rendering of contrast (gray levels) for SDR video content, measured in the dark. We expect to be close to the 2.2 or 2.4 gamma references.
Display peak brightness for video contents
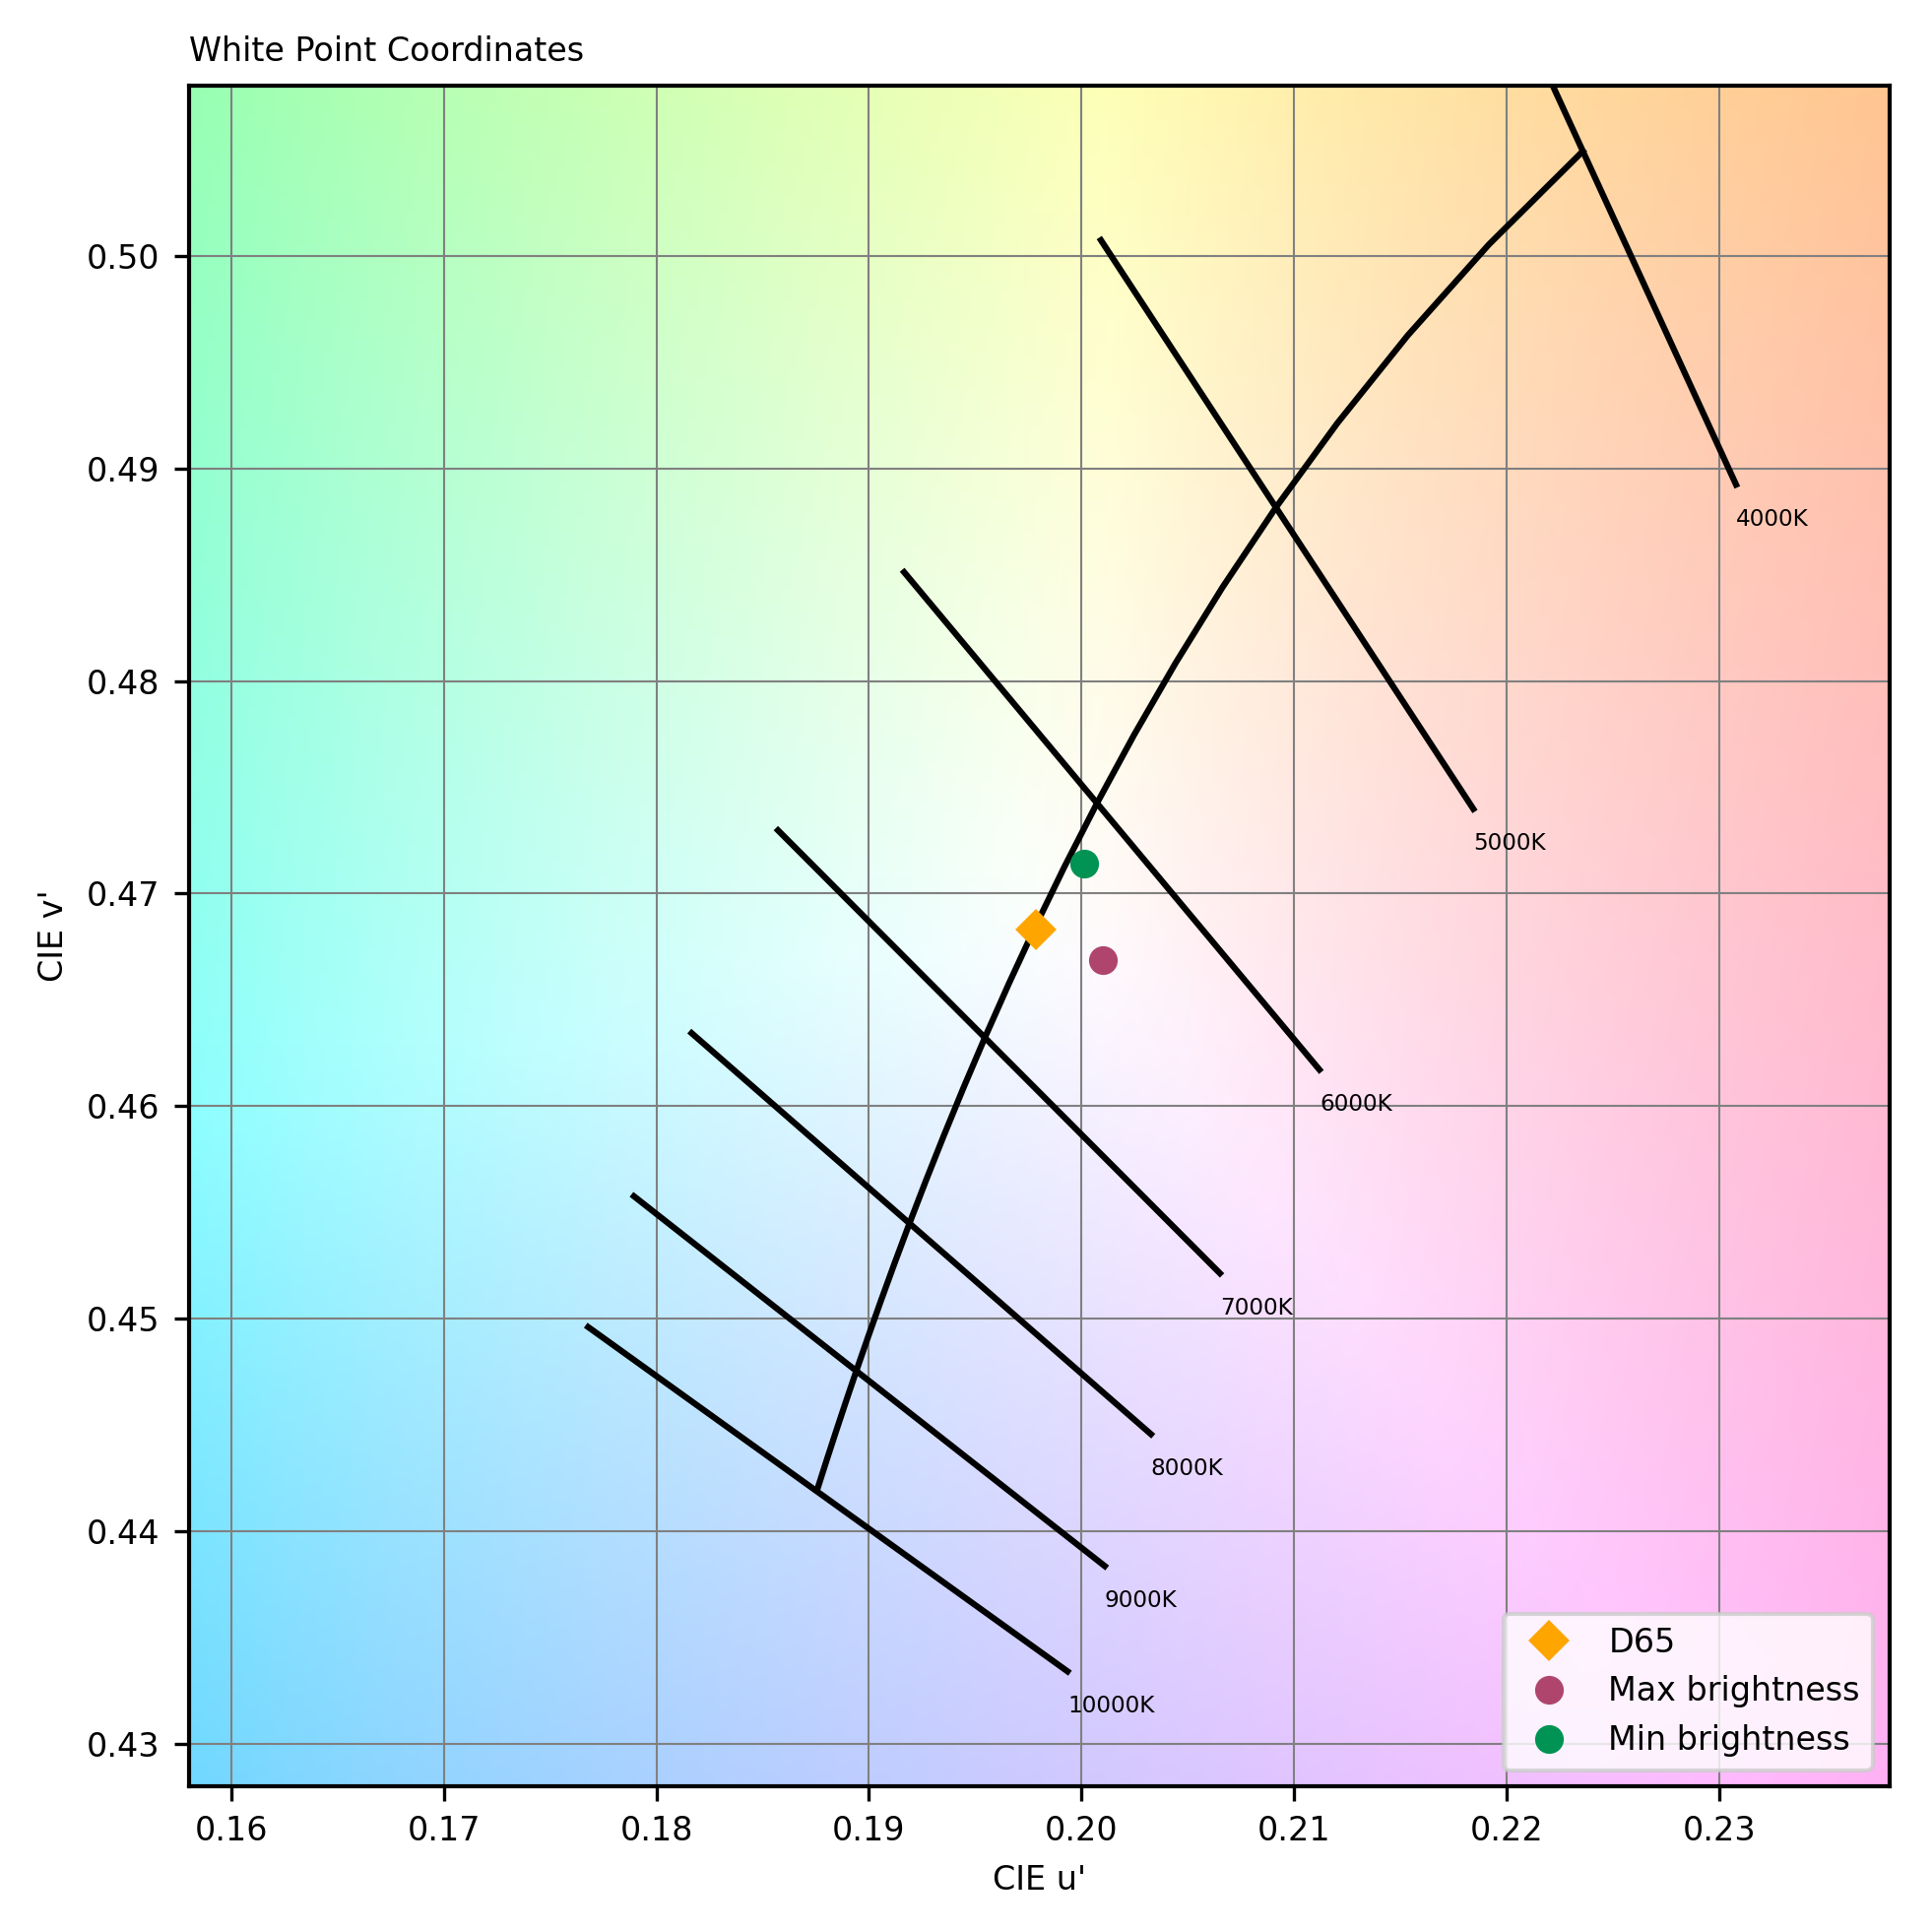
Display white point
This graph represents the color temperature of white content, compared with the reference (Daylight illuminant D65) measured in the dark on video at minimum and maximum brightness.
The following chart presents the playback for the multimedia use case:
Audio playback scores comparison
The following graphs show the frequency response, distortion and directivity in multimedia playback, recorded in our semi-anechoic room:
Audio playback frequency response
A 1/12 octave frequency response graph, which measures the volume of each frequency emitted by the laptop when playing a pure-sine wave in an anechoic environment.
Audio playback Total Harmonic Distortion + Noise


DXOMARK encourages its readers to share comments on the articles. To read or post comments, Disqus cookies are required. Change your Cookies Preferences and read more about our Comment Policy.