We put the Dell Latitude 9440 2-in-1 through our rigorous DXOMARK Laptop test suite to measure its performance in sound, camera, and display. In this review, we will break down how it fared in a variety of tests and several common use cases.
Overview
Scoring
Use-case and feature subscores included in the calculations of the global score
 Dell Latitude 9440 2 in 1

103
camera
69
Apple MacBook Pro 14" (M3 Pro, 2023)
Best: Apple MacBook Pro 14" (M3 Pro, 2023) (93)
40
Lenovo ThinkPad X9 Aura
Best: Lenovo ThinkPad X9 Aura (56)
70
Microsoft Surface Laptop 13-inch
Best: Microsoft Surface Laptop 13-inch (79)
72
Apple MacBook Pro 14" (M2 Pro, 2023)
Best: Apple MacBook Pro 14" (M2 Pro, 2023) (83)
124
display
63
Apple MacBook Pro 14" (M3 Pro, 2023)
Best: Apple MacBook Pro 14" (M3 Pro, 2023) (84)
48
Apple MacBook Pro 14" (M3 Pro, 2023)
Best: Apple MacBook Pro 14" (M3 Pro, 2023) (95)
76
Honor MagicBook View 14 (2022)
Best: Honor MagicBook View 14 (2022) (84)
133
audio
134
Apple MacBook Pro 14" (M2 Pro, 2023)
Best: Apple MacBook Pro 14" (M2 Pro, 2023) (149)
120
Acer Swift Go 14
Best: Acer Swift Go 14 (133)
118
Asus Zenbook 14X OLED (2023)
Best: Asus Zenbook 14X OLED (2023) (153)
Pros
- Very good overall performance, particularly in video call
- Accurate camera depth of field and low noise level
- Very good audio capture performance (good intelligibility and filtering out of background noise)
- Good overall display readability
Cons
- Hue shifting can occur, affecting skin tone accuracy
- Limited in situations when voices overlap or are too quiet
- Colors lack fidelity and saturation in HDR
- Not especially suited for music & video playback purposes
The new Dell Latitude 9440 2-in-1 reaches first place among Windows laptops in our rankings, just like the Dell Latitude 7340 2-in-1, with both devices featuring a consistent performance among camera, display, and audio tests. Both are especially well-suited for video call applications, with very good audio capture, a good display brightness range, and a camera with an accurate depth of field for the usual distances from the laptop. Audio performance is limited when voices overlap or are too quiet, and neither device is especially suited for media playback, with HDR colors lacking in fidelity and saturation, and audio timbre lacking in bass and body.
Test summary
About DXOMARK Laptop tests: For scoring and analysis in our laptop reviews, DXOMARK engineers perform a variety of objective tests and undertake more than 20 hours of perceptual evaluations under controlled lab conditions and real-life scenarios. (For more details about the Laptop protocol, click here.)
The following section gathers key elements of our exhaustive tests and analyses performed in DXOMARK laboratories. Detailed performance evaluations under the form of reports are available upon request. Do not hesitate to contact us.
Dell Latitude 9440 2-in-1 overall & use-cases scores
Video Call
130
Dell Latitude 9440 2 in 1
144
Apple MacBook Pro 14" (M2 Pro, 2023)
Apple MacBook Pro 14" (M2 Pro, 2023)
About DXOMARK Laptop tests
DXOMARK's Video call use case is a score that evaluates how a device handles video calls and videoconferencing in multiple conditions. This score focuses on the camera performance and the capture and playback rendering of voices. Read more about how we test the use cases of Video call score here.
The camera on the Latitude 9440 2-in-1 laptop has a depth of field that is well calibrated to the most common camera-to-face distances on laptops, along with generally accurate target exposure. Skin-tone rendering is sometimes inaccurate and clipping in bright areas is often visible.
Hue shift near saturation and aliasing are sometimes noticeable as well. Focused on mainly front sound sources, the device achieves excellent voice intelligibility for video calls, although the efficient SNR can sometimes remove quiet voices and the duplex experience is impaired by gating. The display has a nice brightness range that results in good overall readability.
Camera
103
Dell Latitude 9440 2 in 1
135
Apple MacBook Pro 14" (M3 Pro, 2023)
Apple MacBook Pro 14" (M3 Pro, 2023)
Camera texture acutance on Deadleaves with illuminance levels
This graph shows the evolution of texture acutance with the level of lux measured on a Deadleaves chart.
The following graphs show the objective measurements performed in our camera labs:
Camera visual noise evolution with illuminance levels
This graph shows the evolution of spatial visual noise with the level of lux. Spatial visual noise is measured on the visual noise chart in the video noise setup. DXOMARK visual noise measurement is derived from ISO15739 standard.
Target exposure on face with illuminance levels
These measurements take place on a setup combining realistic mannequins and a backlit panel simulating high dynamic range conditions. This graph shows the evolution of lightness measured on the forehead of the realistic mannequin with the level of lux, for multiple lighting conditions. The lightness is measured in L*. Delta EV specifies the difference of luminance in stops between the face and the light panel simulating HDR conditions.
Target exposure on face with illuminance levels in HDR conditions
These measurements take place on a setup combining realistic mannequins and a backlit panel simulating high dynamic range conditions. This graph shows the evolution of lightness measured on the forehead of the realistic mannequin with the level of lux, for multiple lighting conditions. The lightness is measured in L*. Delta EV specifies the difference of luminance in stops between the face and the light panel simulating HDR conditions.
Audio
134
Dell Latitude 9440 2 in 1
144
Apple MacBook Pro 14" (M2 Pro, 2023)
Apple MacBook Pro 14" (M2 Pro, 2023)
Audio capture scores comparison
The following graphs show the frequency response, distortion and directivity in capture, recorded in our semi-anechoic room:
Audio capture frequency response
A 1/12 octave frequency response graph, which measures the volume of each frequency captured by the laptop when recording an objective test signal at 1 meter in an anechoic environment.
Audio capture directivity
Directivity graph of the laptop microphone(s) when capturing test signals using the camera app. It represents the acoustic energy (in dB) over the angle of incidence of the sound source (normalized to the angle 0°, in front of the device).
About DXOMARK Laptop tests
DXOMARK's Video and Music use case score evaluates the capability of a device to reproduce multimedia usages such as videos, movies and music playback in indoor conditions. This score focuses on the display performance and audio-playback rendering. Read more about how we test this use case here.
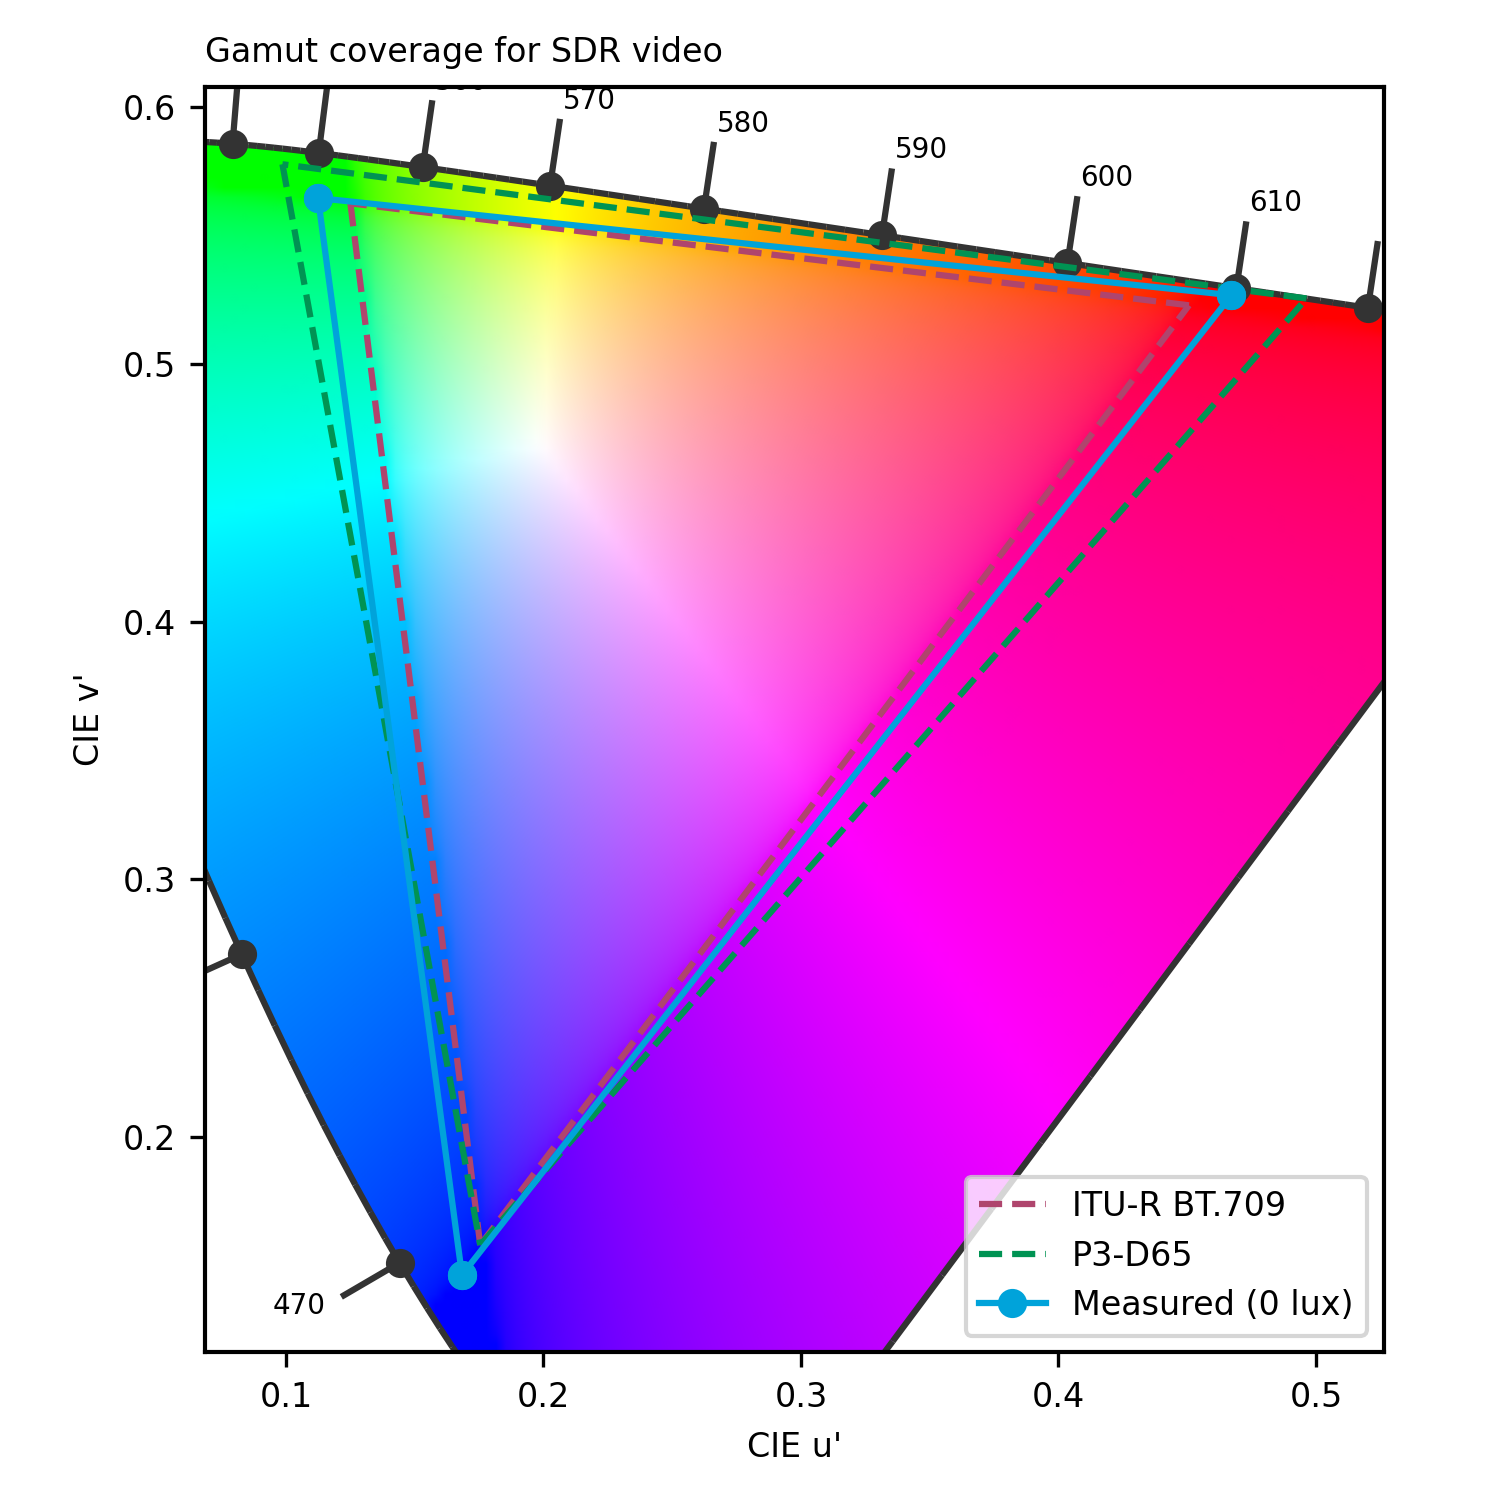
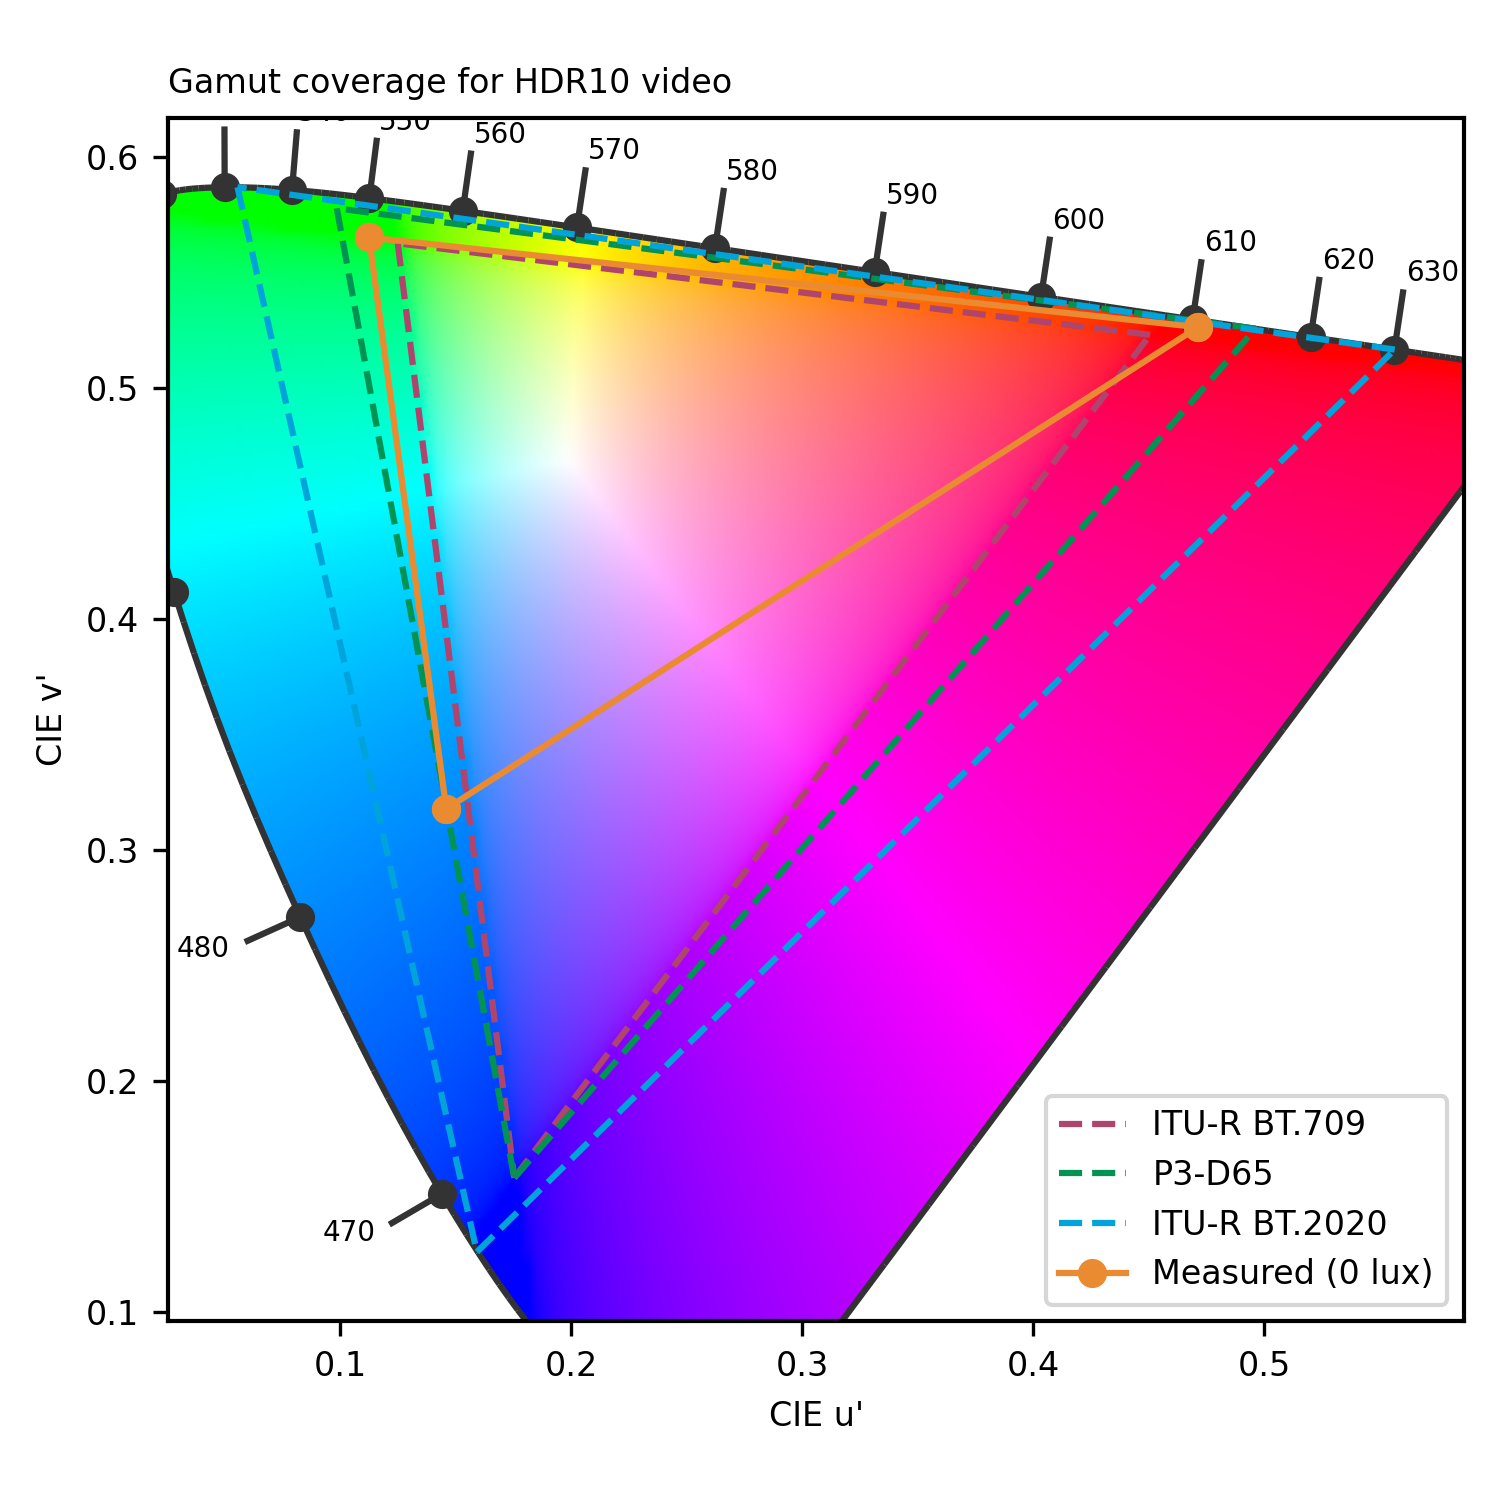
The 9440 2-in-1’s display achieves more than 500 nits of brightness, providing good readability in all lighting conditions. It correctly renders color and adapts its gamut for SDR videos; for HDR content, however, its gamut is narrow and colors lack fidelity and saturation. The display’s minimum brightness of 36 nits is too high for comfortable use in a low-light environment. The laptop’s sound lacks bass and body, making it a less suitable device for playing music and videos.
The following chart presents the display subscores for the multimedia use case:
Display scores comparison
The following graphs show the objective measurements performed in our display lab:
Display gamut coverage for video contents
The primary colors are measured both in HDR10 and SDR. The extracted color gamut shows the extent of the color area that the device can render. To respect the artistic intent, the measured gamut should match the master color space of each video.
Display reflectance measurement (SCI)
Measurements above show the reflection of the device within the visible spectrum range (400 nm to 700 nm). It includes both diffuse and specular reflection.
Display reflectance profile
Display brightness uniformity
1.072
cd/m²
1.086
cd/m²
1.077
cd/m²
1.029
cd/m²
1.076
cd/m²
1.057
cd/m²
0.999
cd/m²
0.978
cd/m²
0.999
cd/m²
 Distribution of brightness (min)
524.3
cd/m²
527.8
cd/m²
517.7
cd/m²
502.2
cd/m²
514
cd/m²
496.3
cd/m²
481.7
cd/m²
470.4
cd/m²
477
cd/m²
Distribution of brightness (max)
This illustration shows the brightness measured on nine zones of the display for minimum brightness (left) and maximum brightness (right) for SDR content.
Display SDR EOTF measurement
This graph represents the rendering of contrast (gray levels) for SDR video content, measured in the dark. We expect to be close to the 2.2 or 2.4 gamma references.
Display peak brightness for video contents
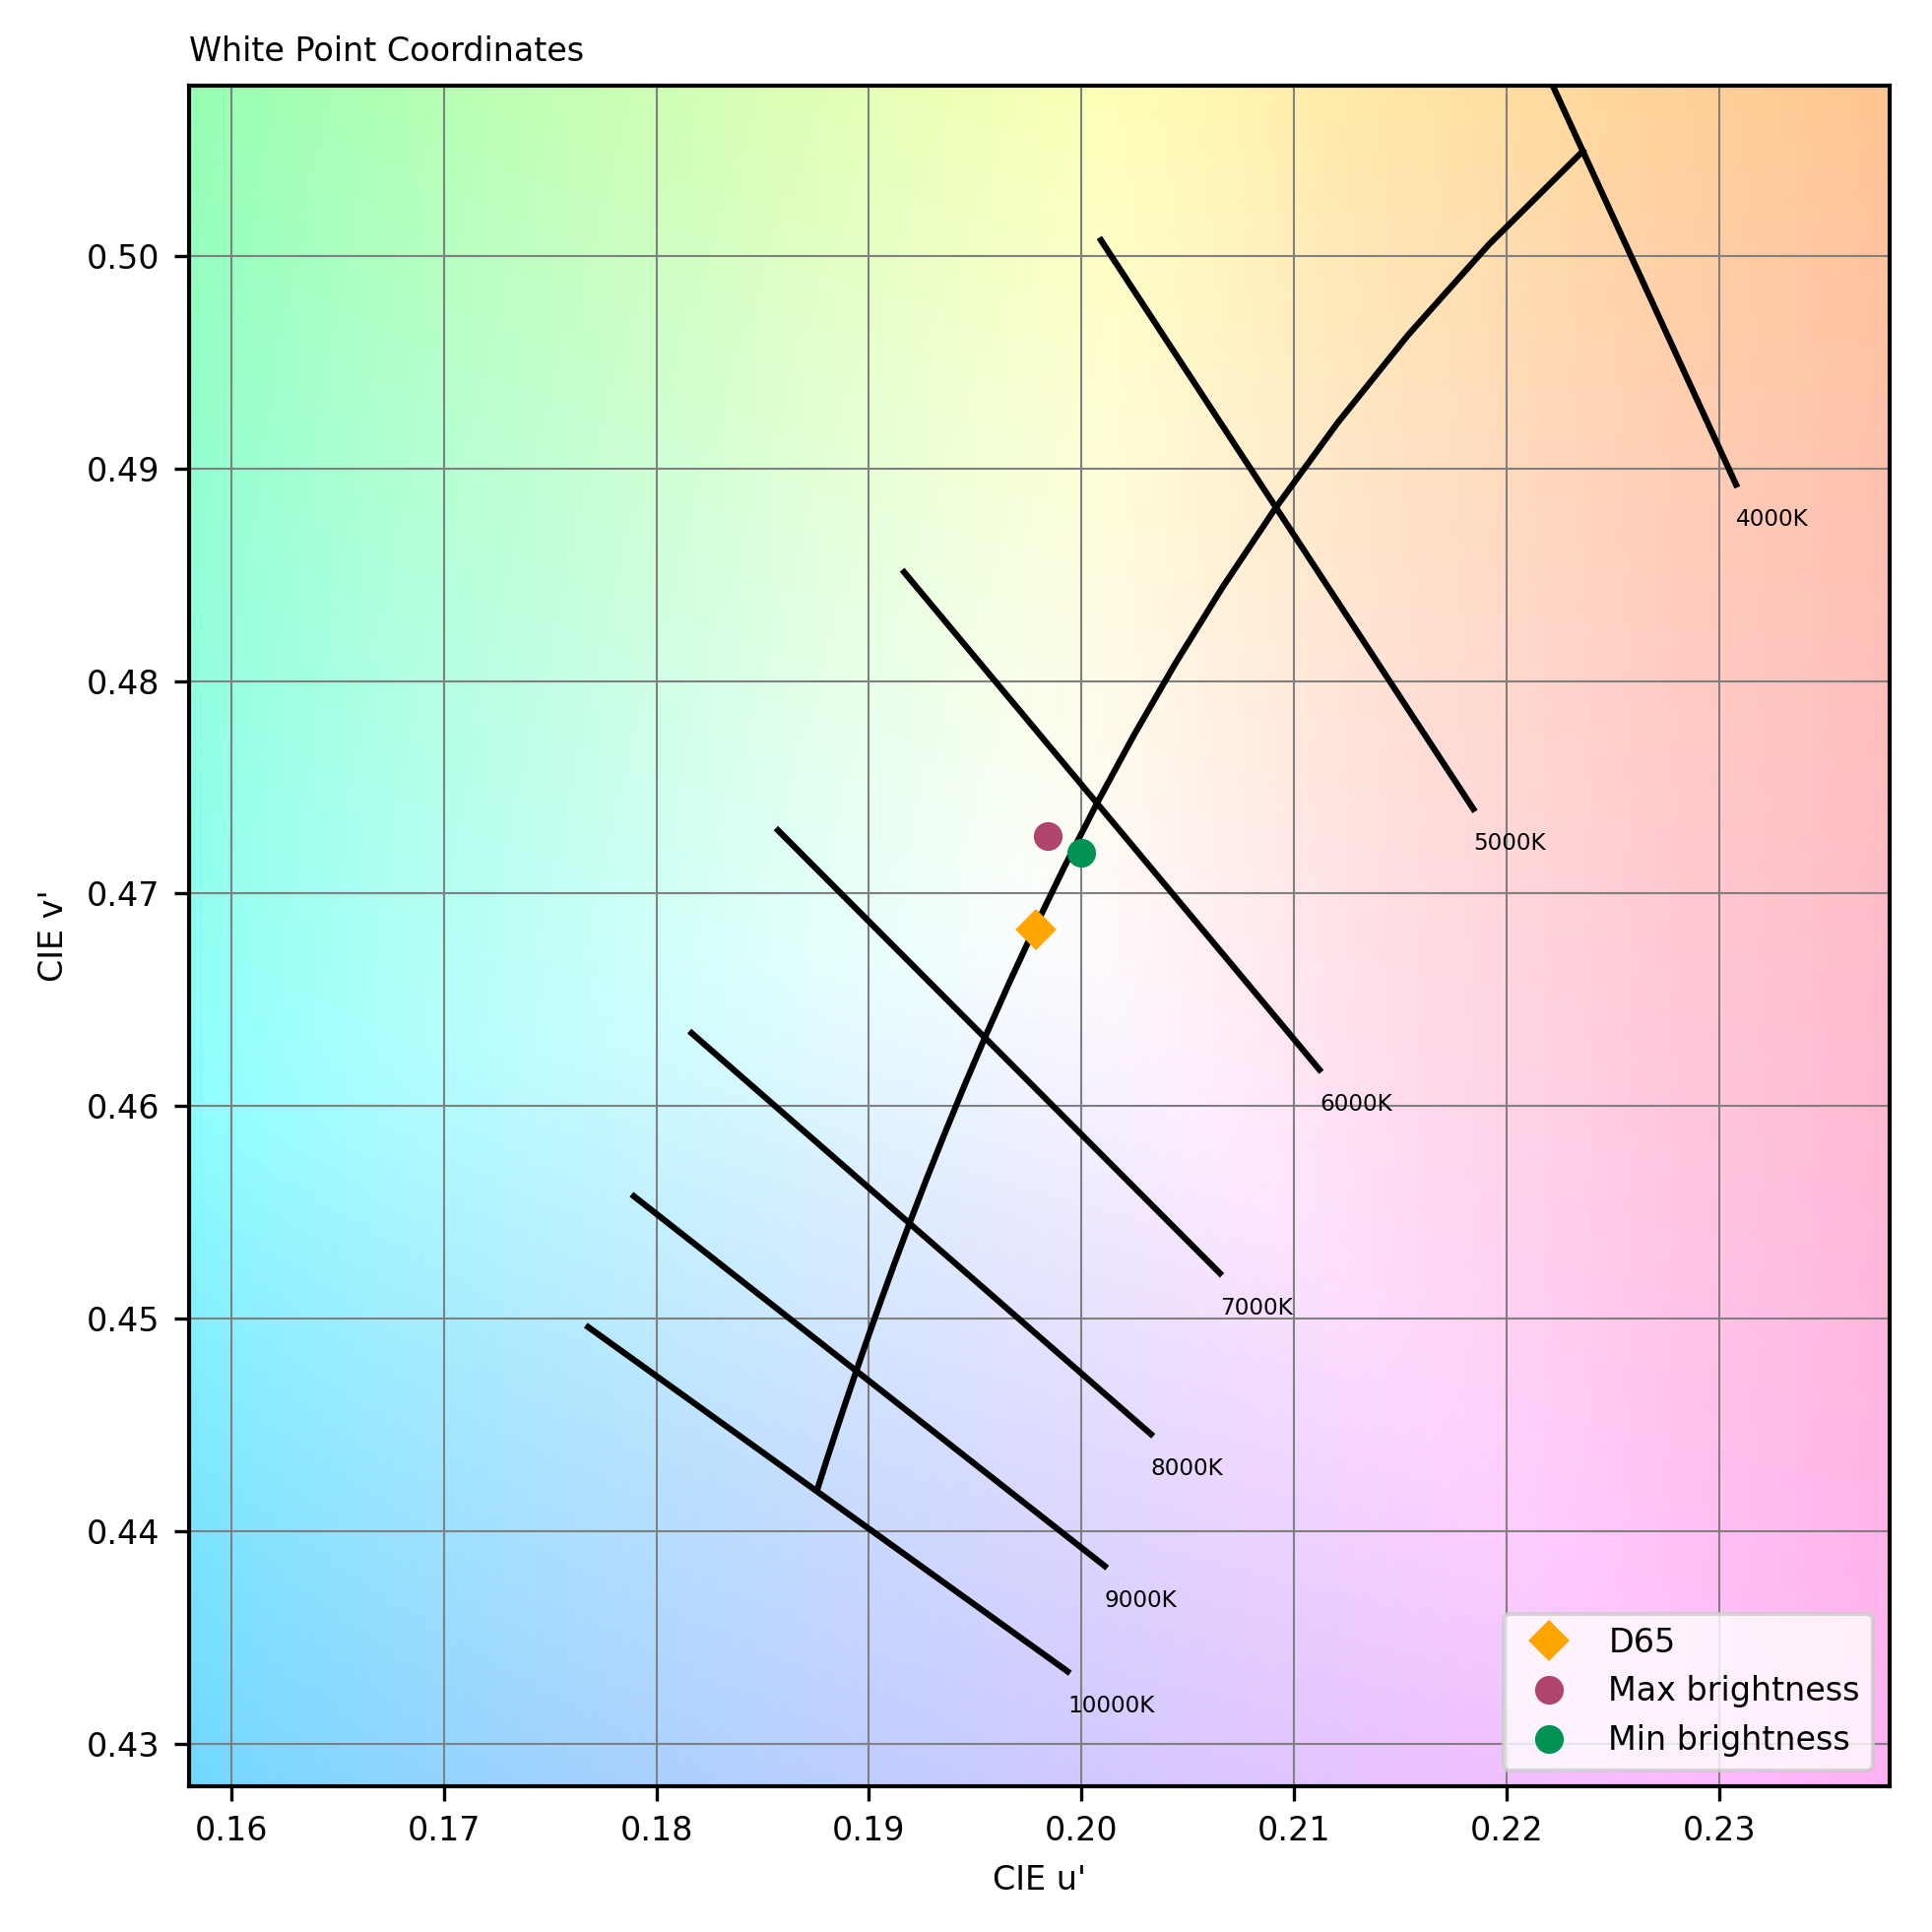
Display white point
This graph represents the color temperature of white content, compared with the reference (Daylight illuminant D65) measured in the dark on video at minimum and maximum brightness.
The following chart presents the playback for the multimedia use case:
Audio playback scores comparison
The following graphs show the frequency response, distortion and directivity in multimedia playback, recorded in our semi-anechoic room:
Audio playback frequency response
A 1/12 octave frequency response graph, which measures the volume of each frequency emitted by the laptop when playing a pure-sine wave in an anechoic environment.
Audio playback Total Harmonic Distortion + Noise
DXOMARK encourages its readers to share comments on the articles. To read or post comments, Disqus cookies are required. Change your Cookies Preferences and read more about our Comment Policy.