We put the Huawei Pura 70 Ultra through our rigorous DXOMARK Camera test suite to measure its performance in photo, video, and zoom quality from an end-user perspective. This article breaks down how the device fared in a variety of tests and several common use cases and is intended to highlight the most important results of our testing with an extract of the captured data.
Overview
Key camera specifications:
- Primary: 50MP 1″ sensor, f/1.6-4.0-aperture lens, DualPD AF, Sensor-shift OIS
- Ultra-wide: 40MP, f/2.2-aperture lens, QuadPD AF
- Tele: 50MP, f/2.1-aperture lens, QuadPD AF, OIS
Scoring
Sub-scores and attributes included in the calculations of the global score.

Huawei Pura 70 Ultra
Use cases & Conditions
Use case scores indicate the product performance in specific situations. They are not included in the overall score calculations.
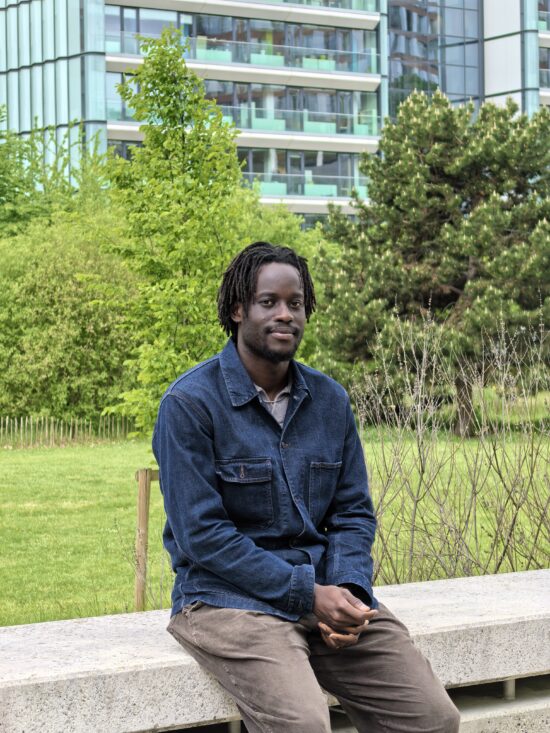
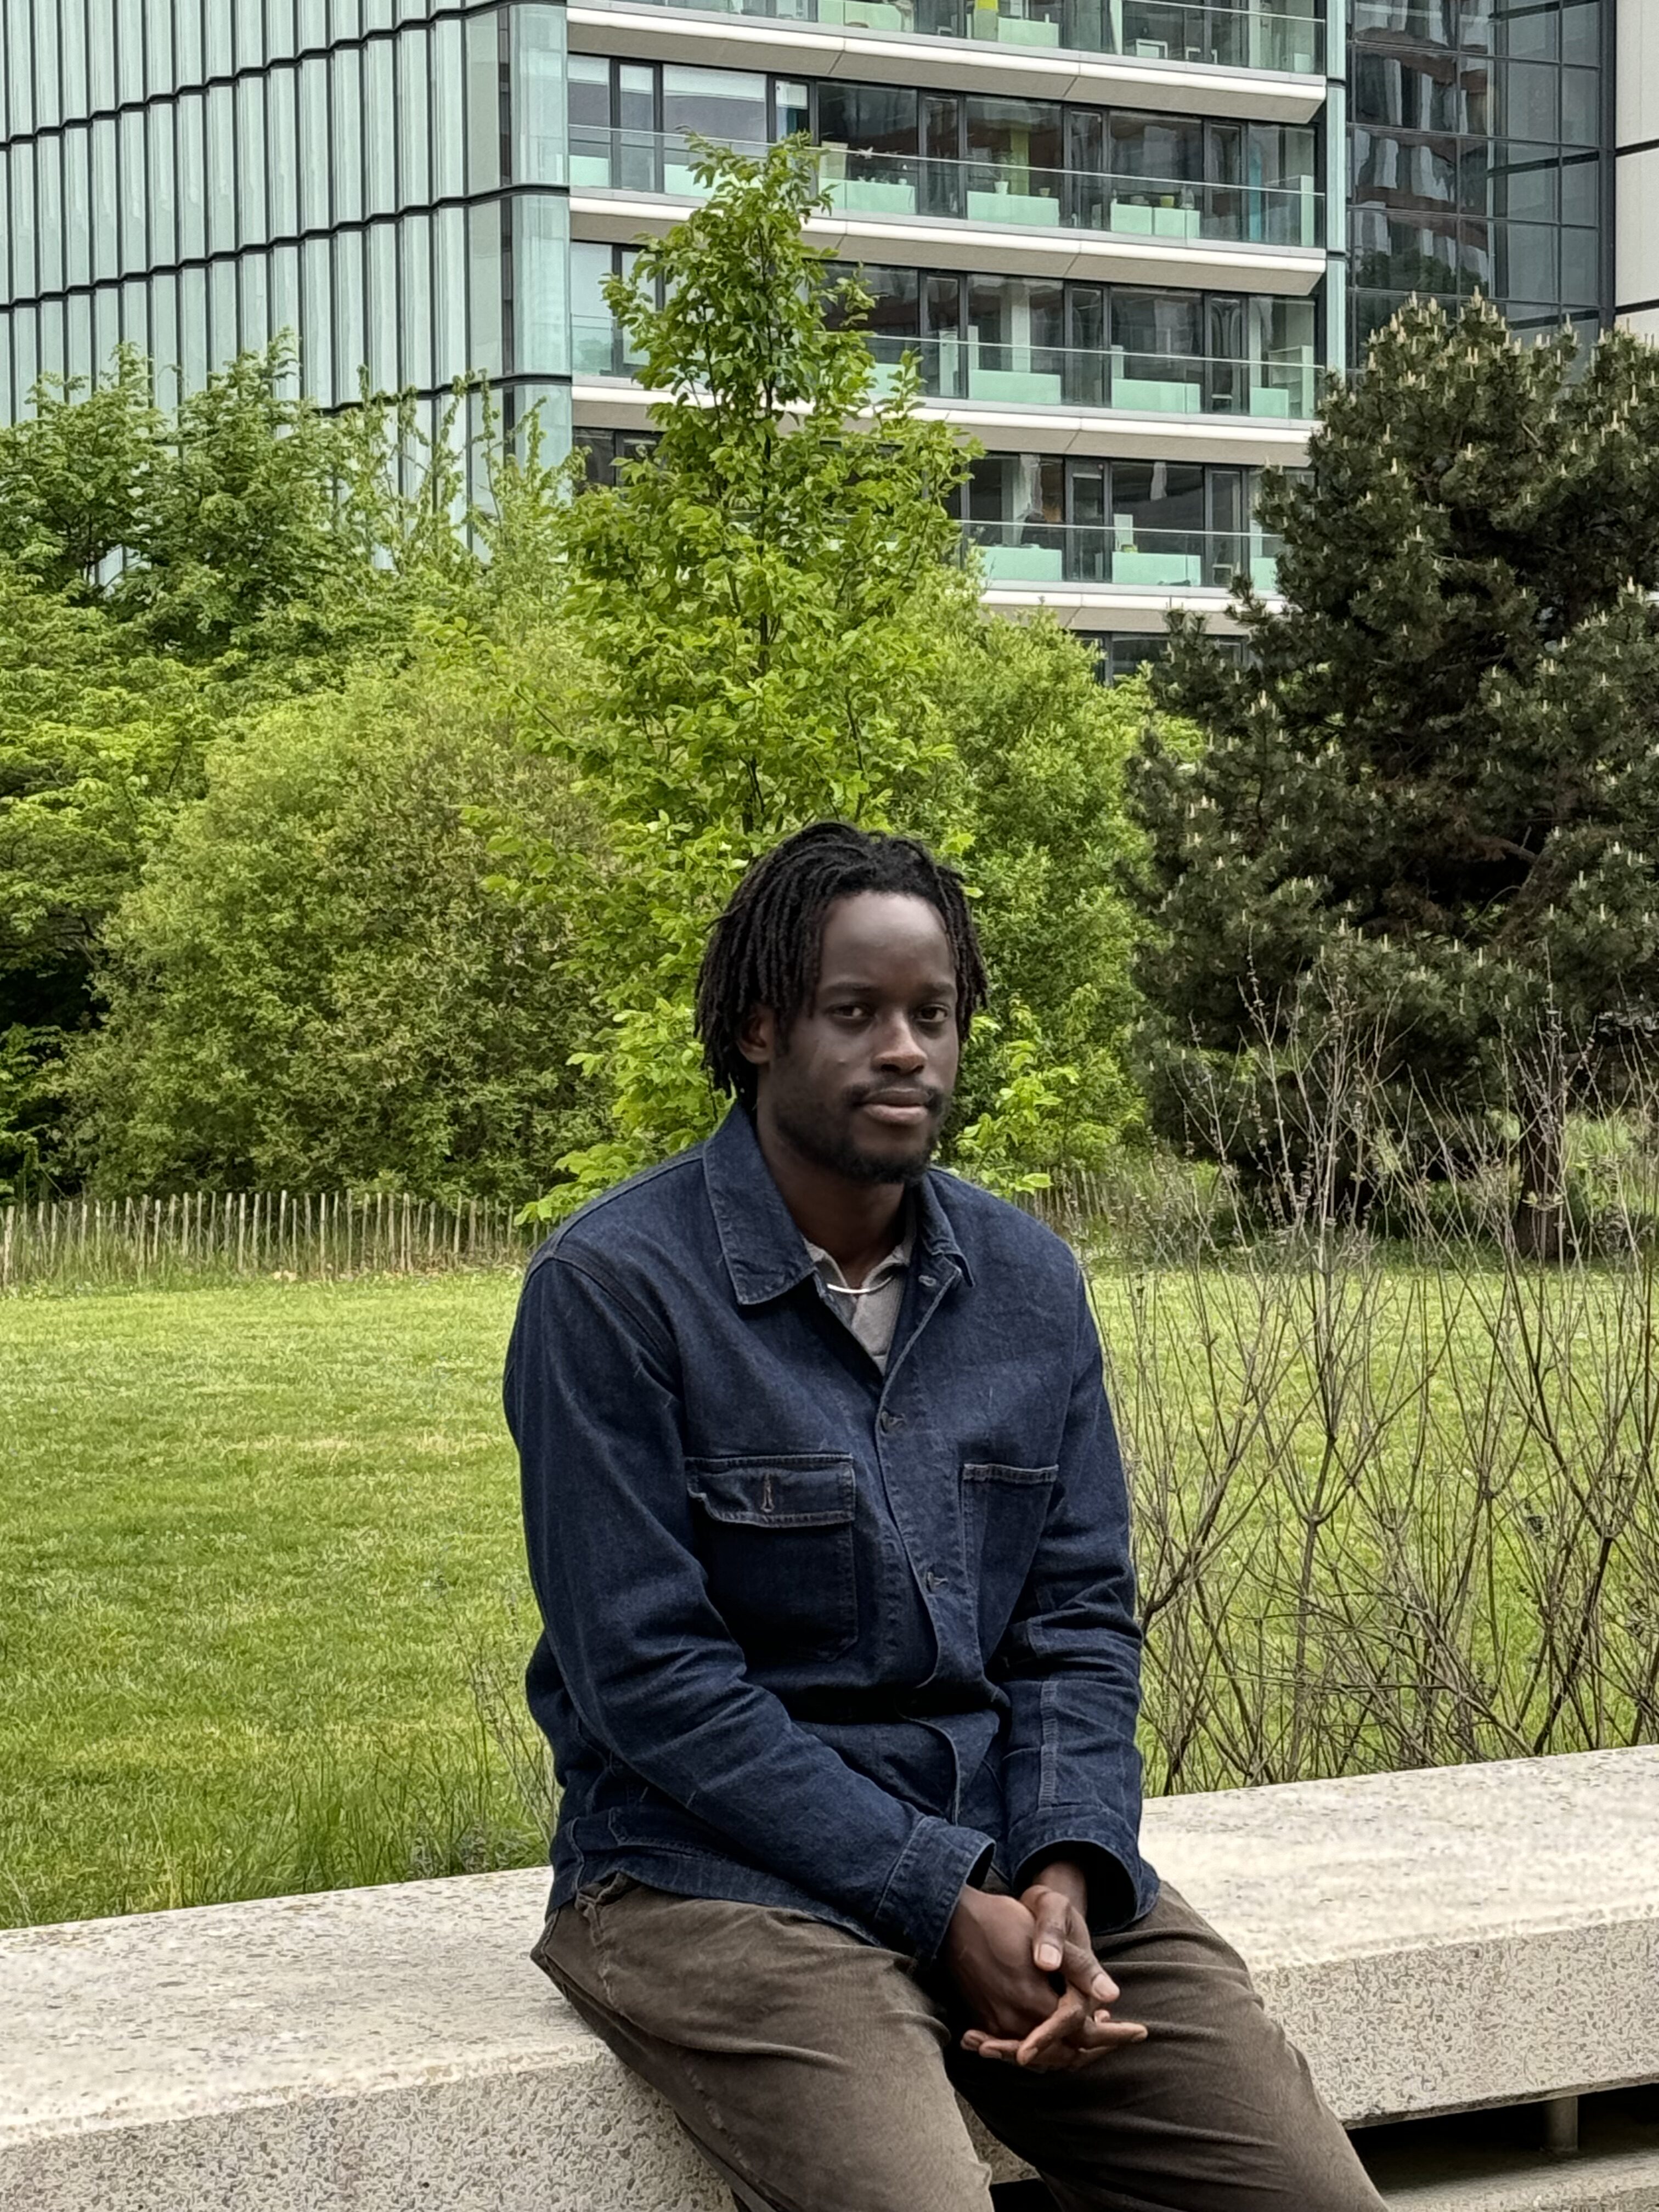
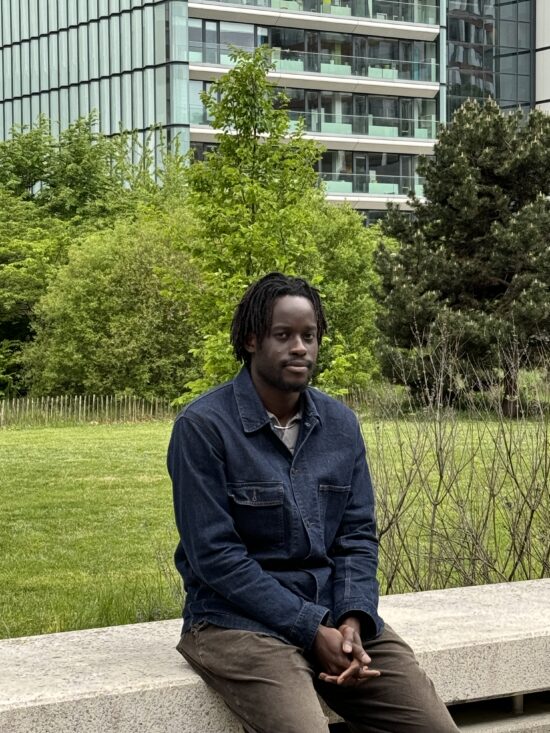
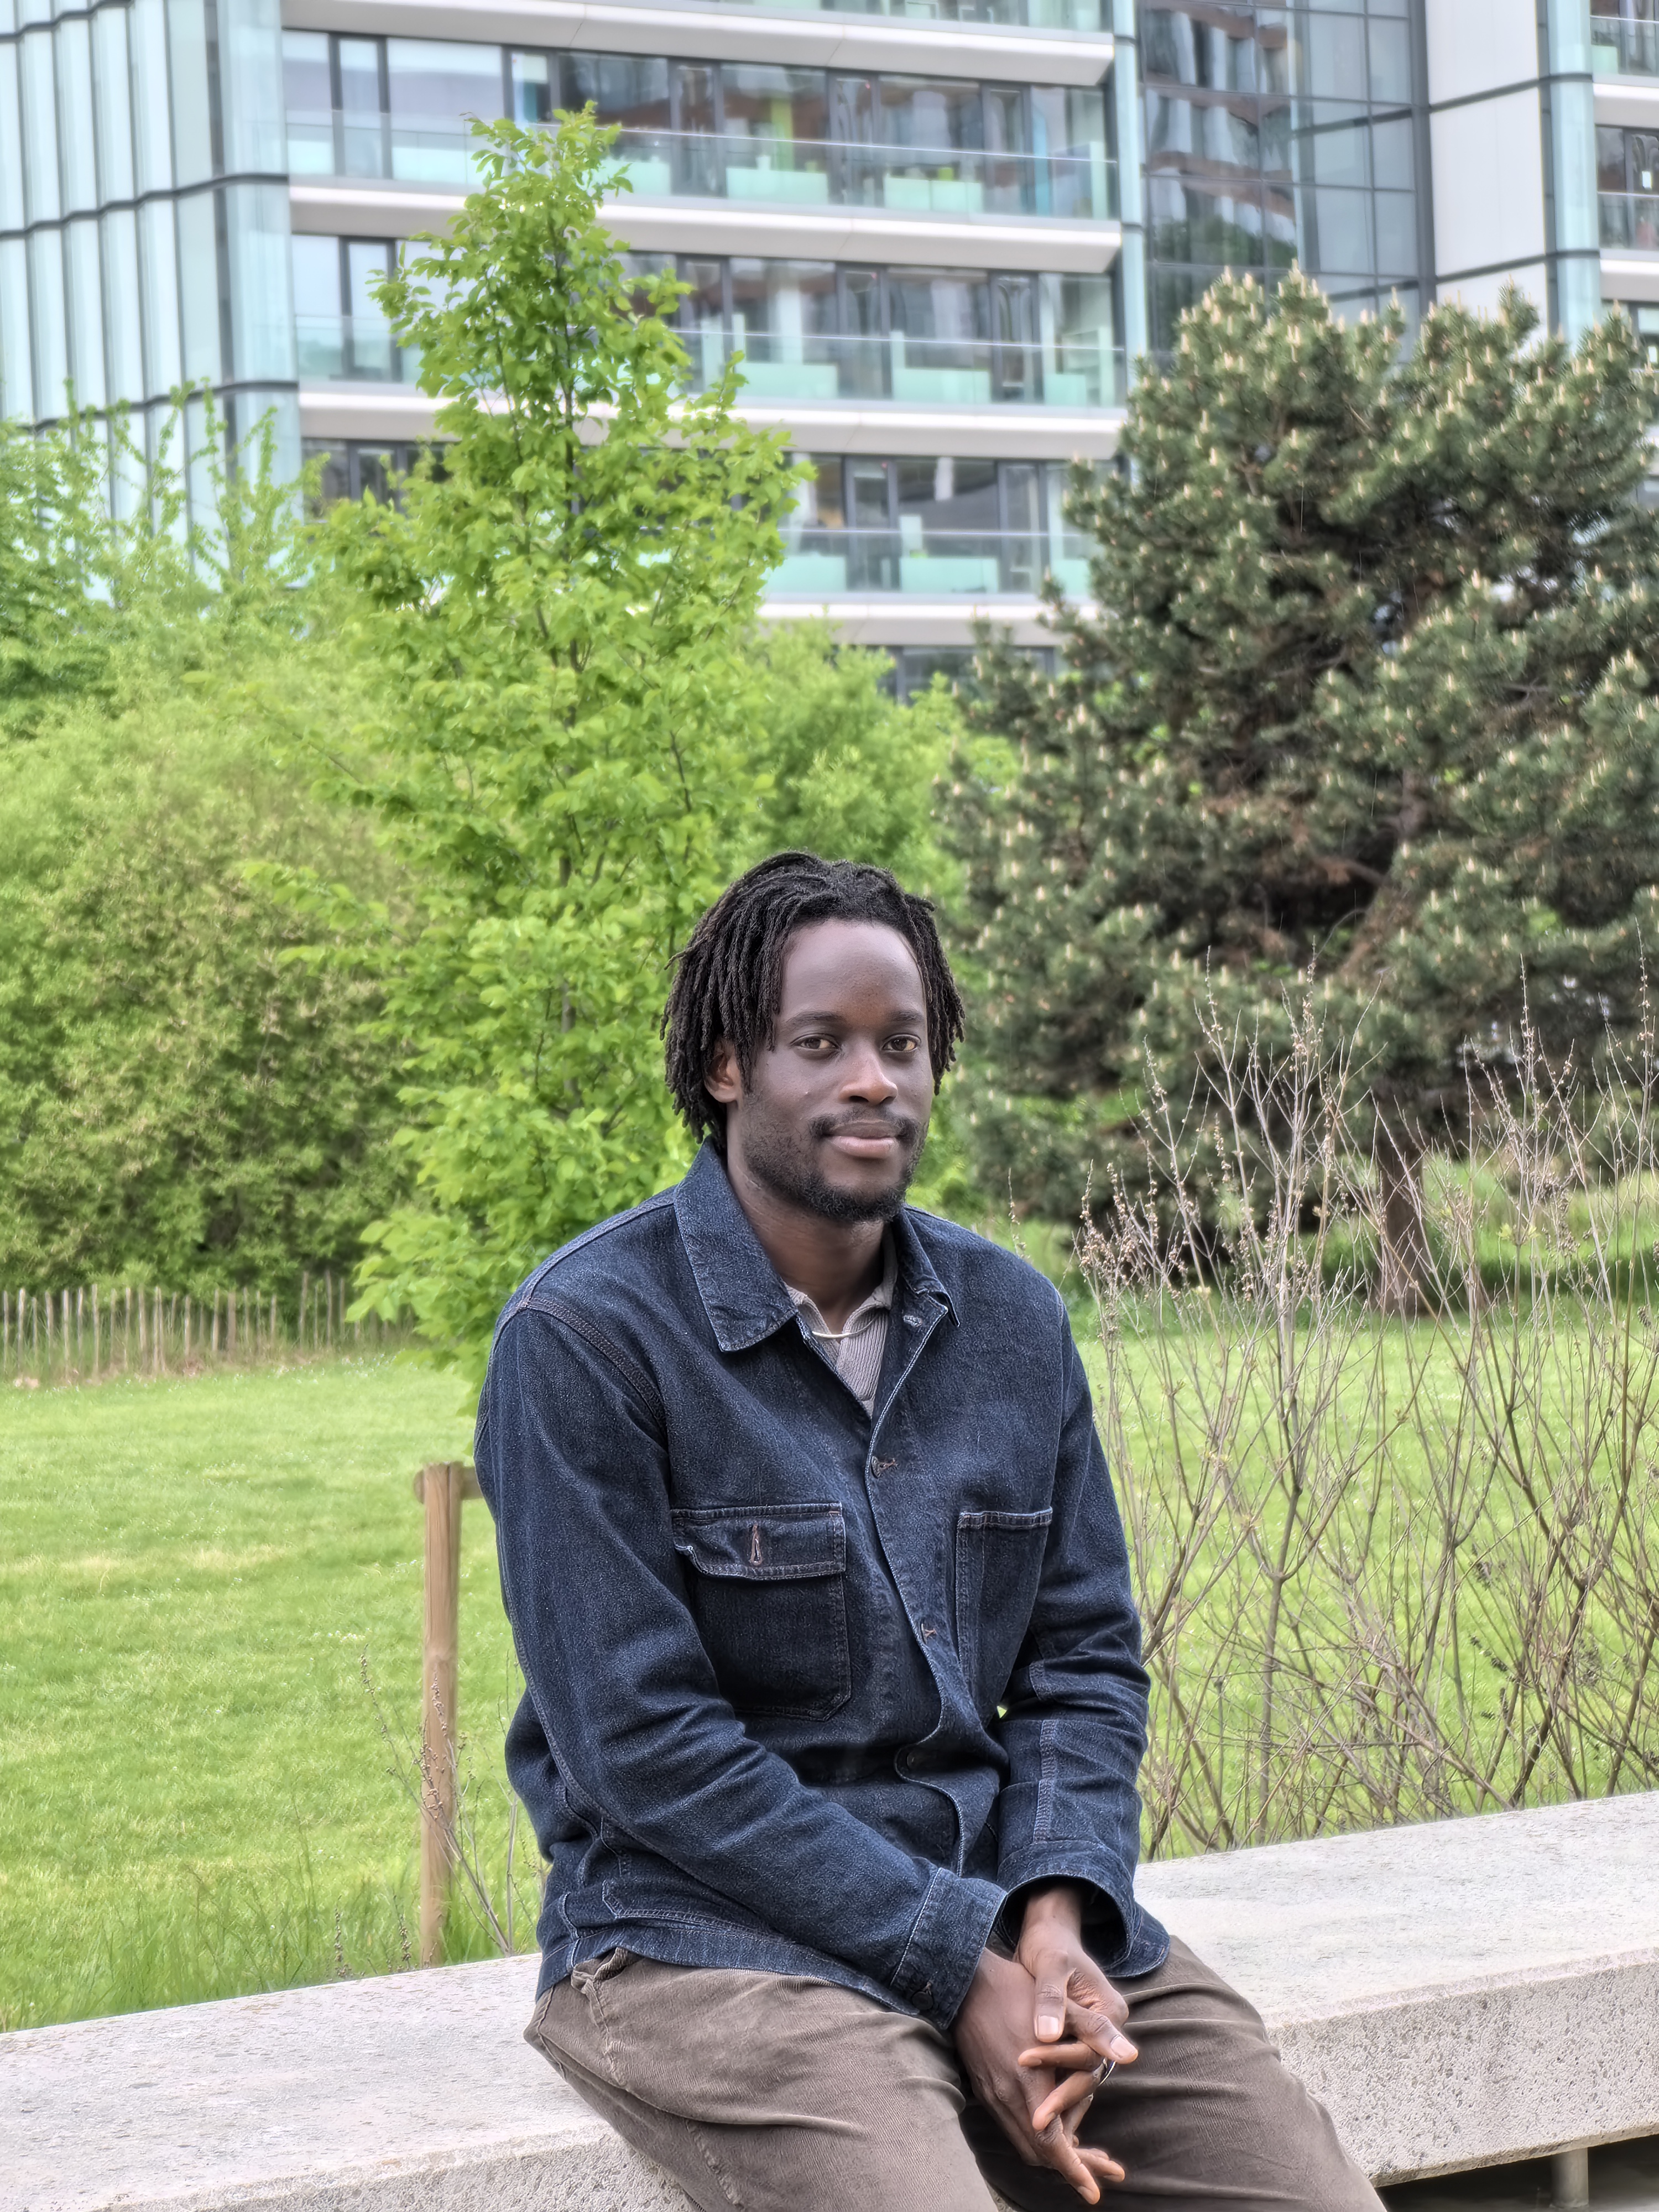
Portrait
Portrait photos of either one person or a group of people
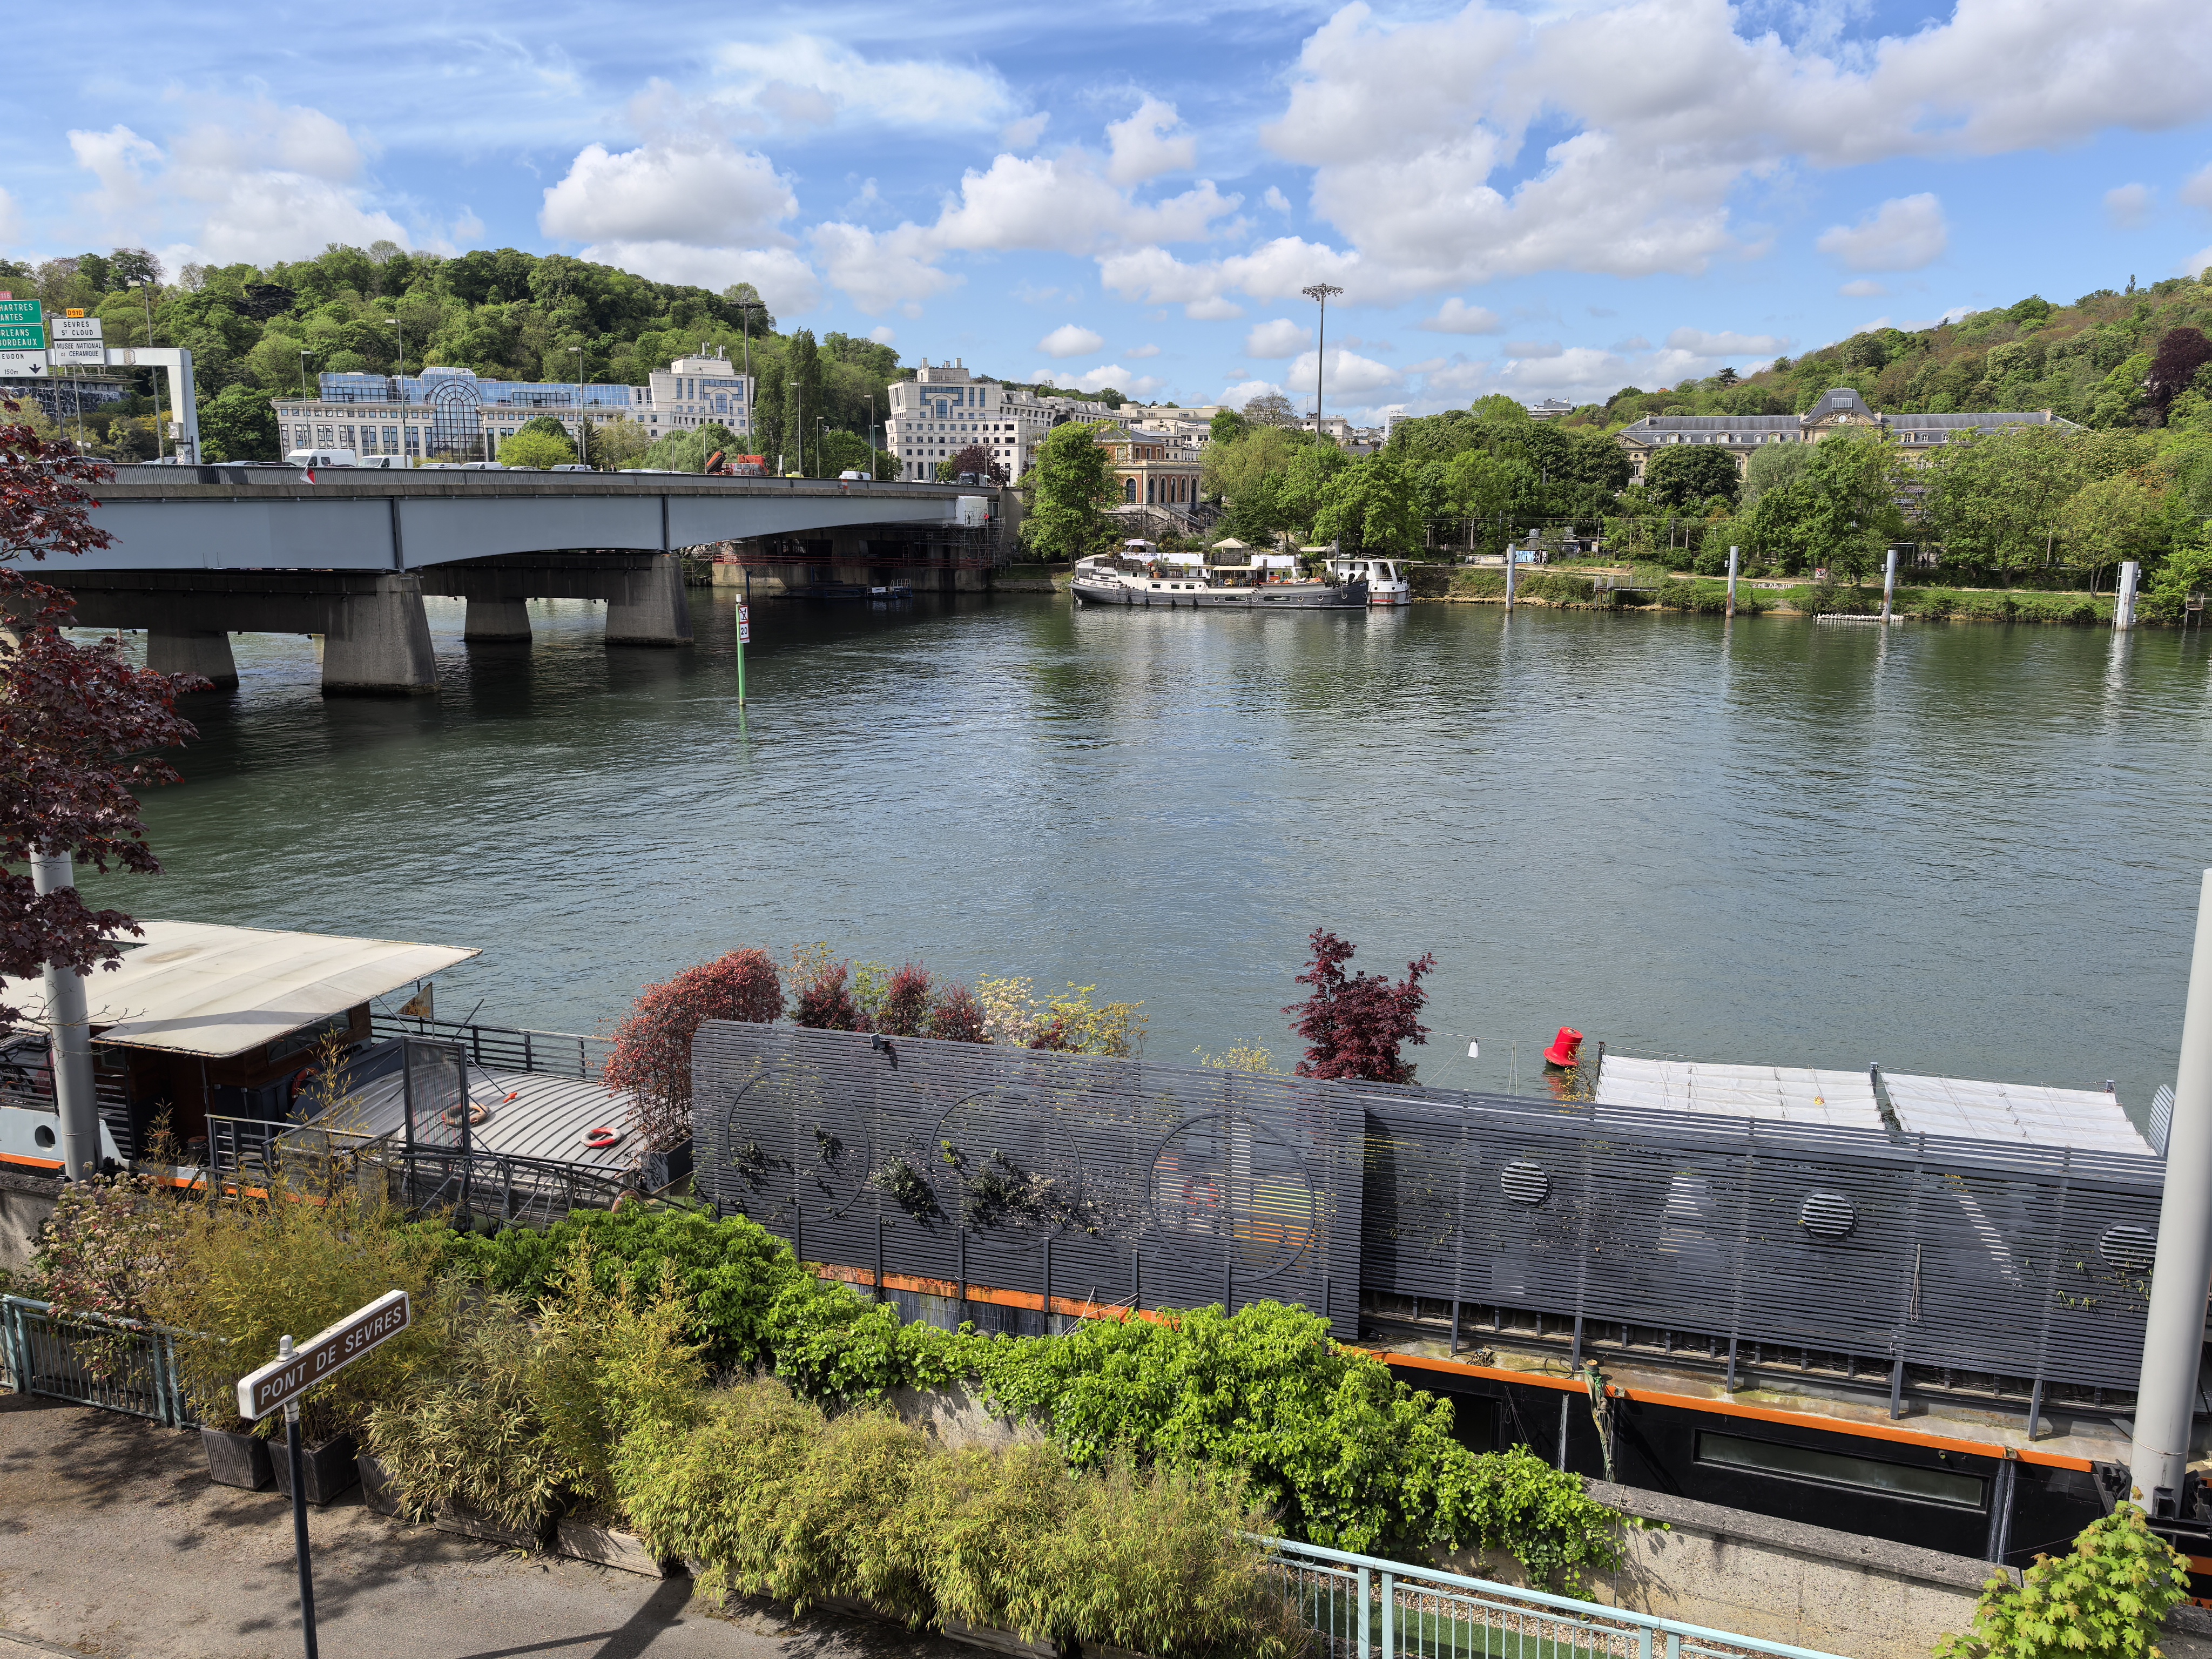
Outdoor
Photos & videos shot in bright light conditions (≥1000 lux)
Indoor
Photos & videos shot in good lighting conditions (≥100lux)
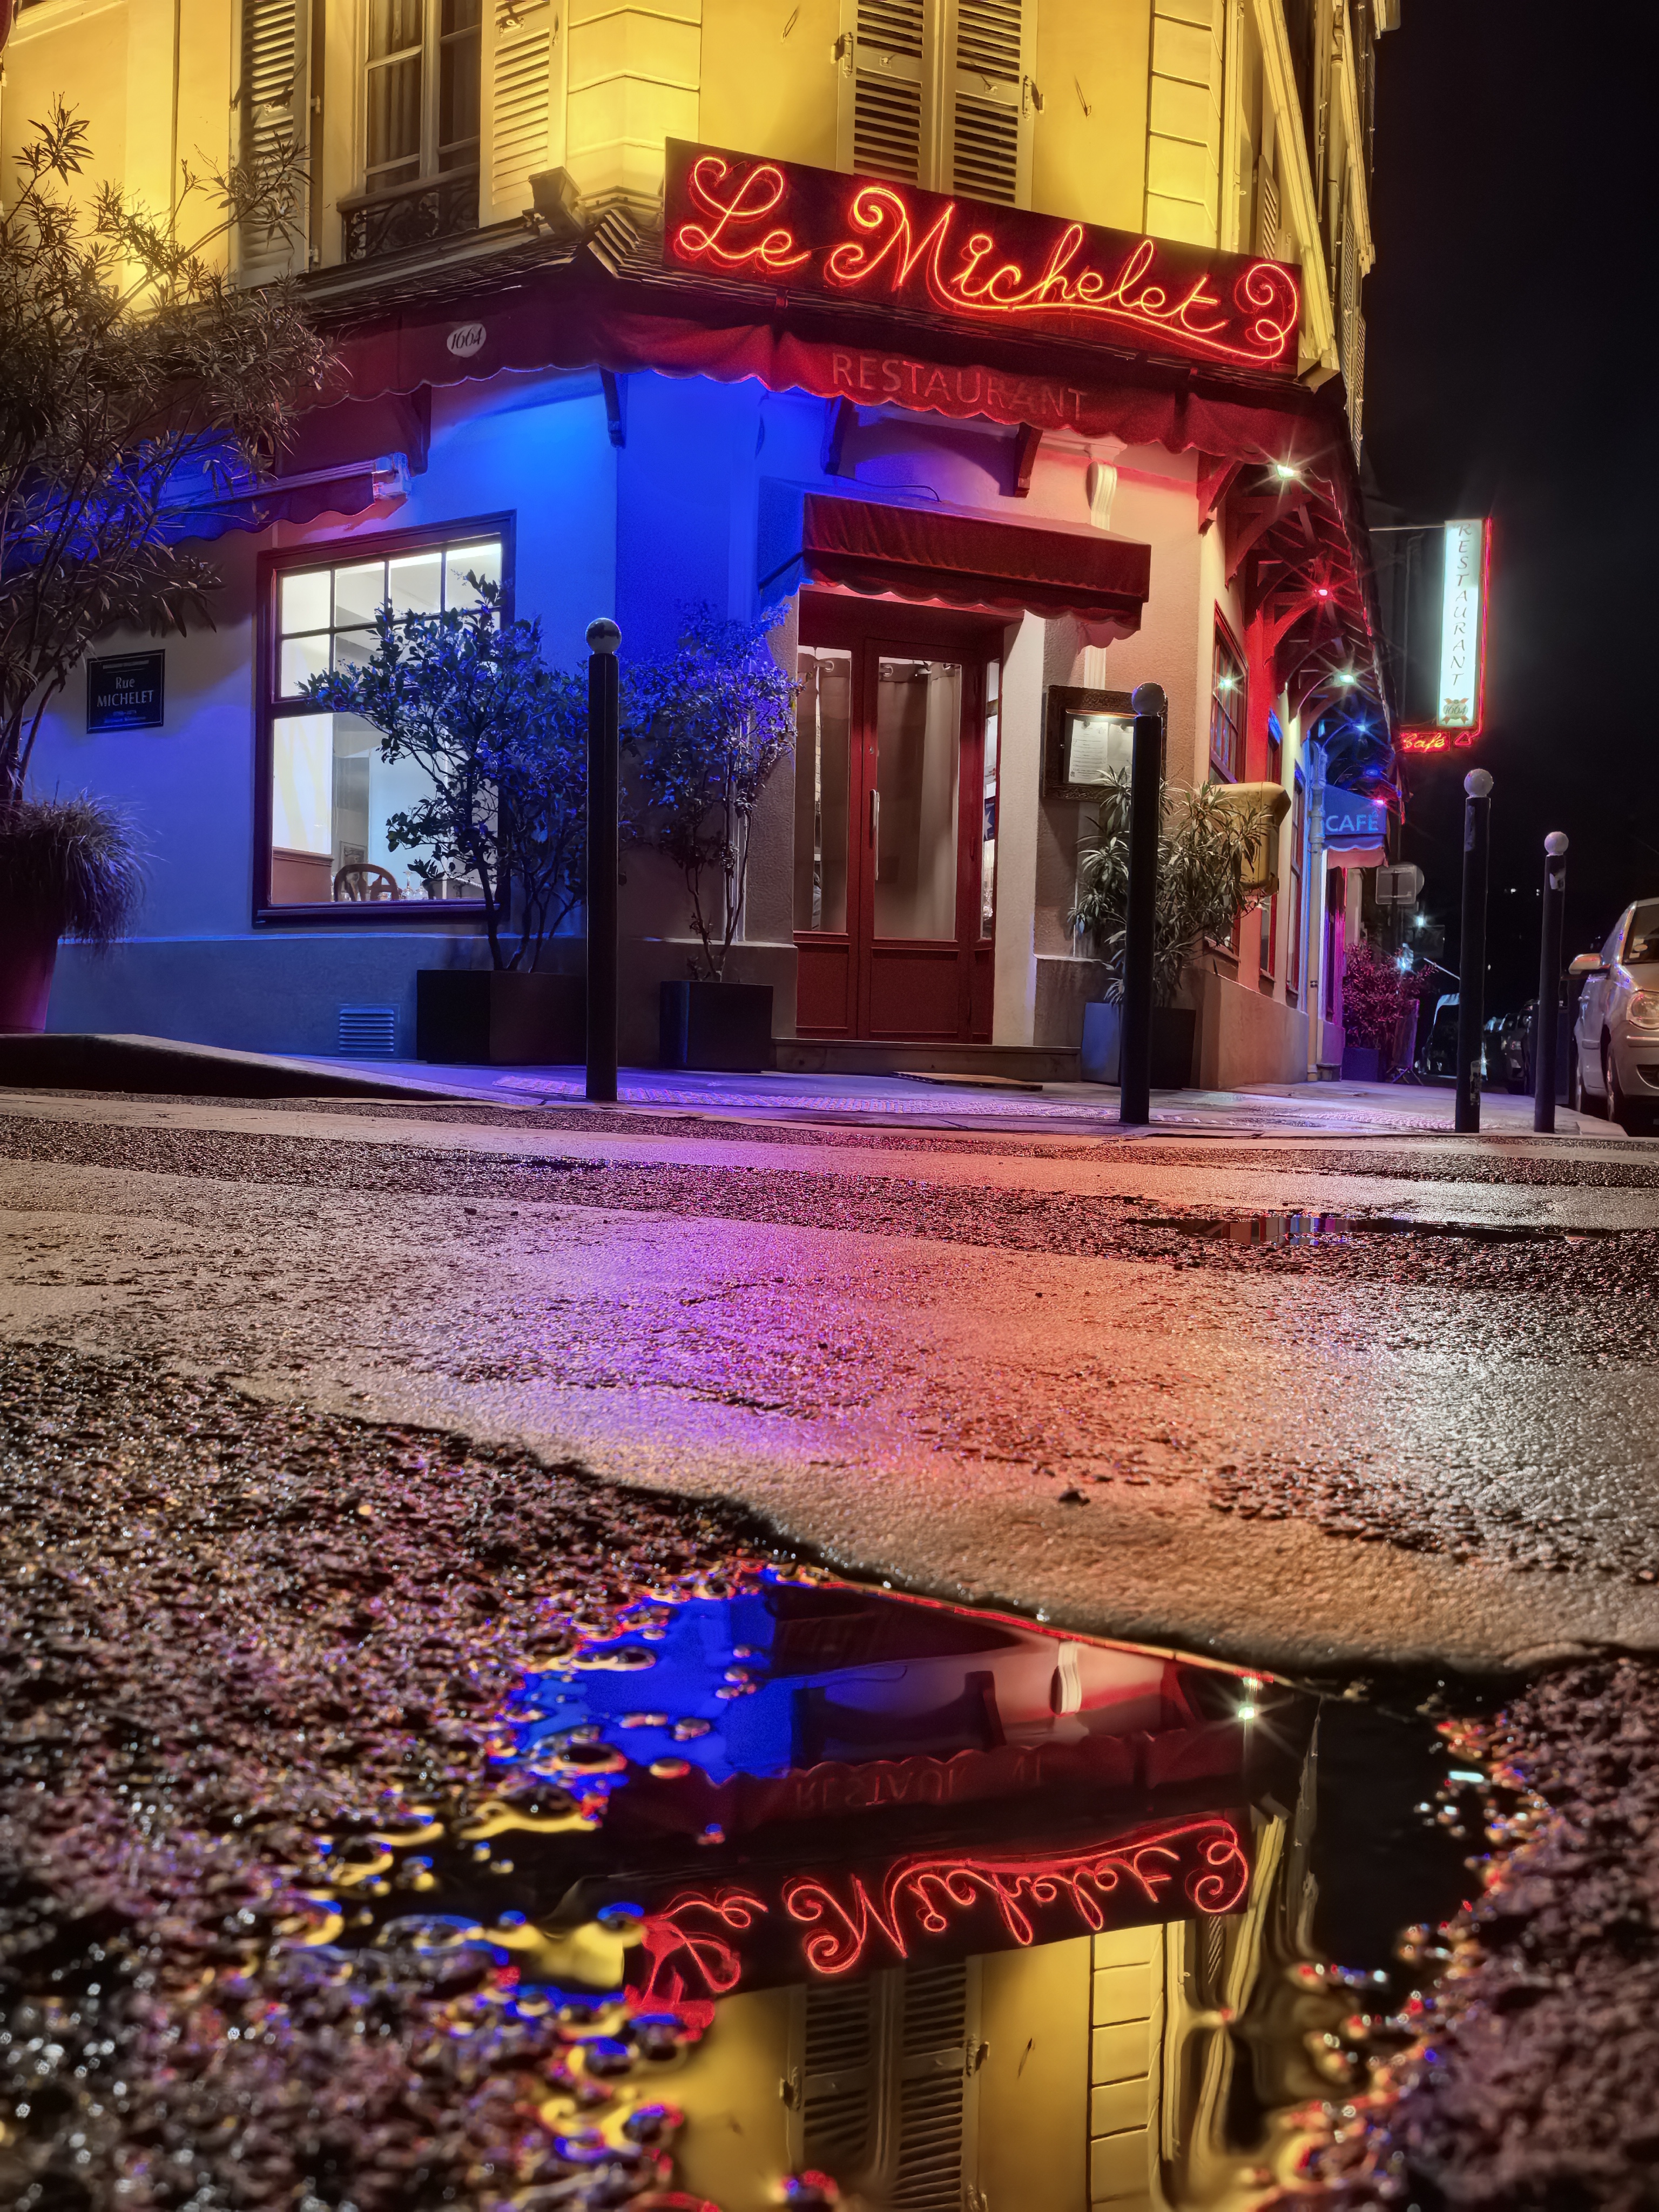
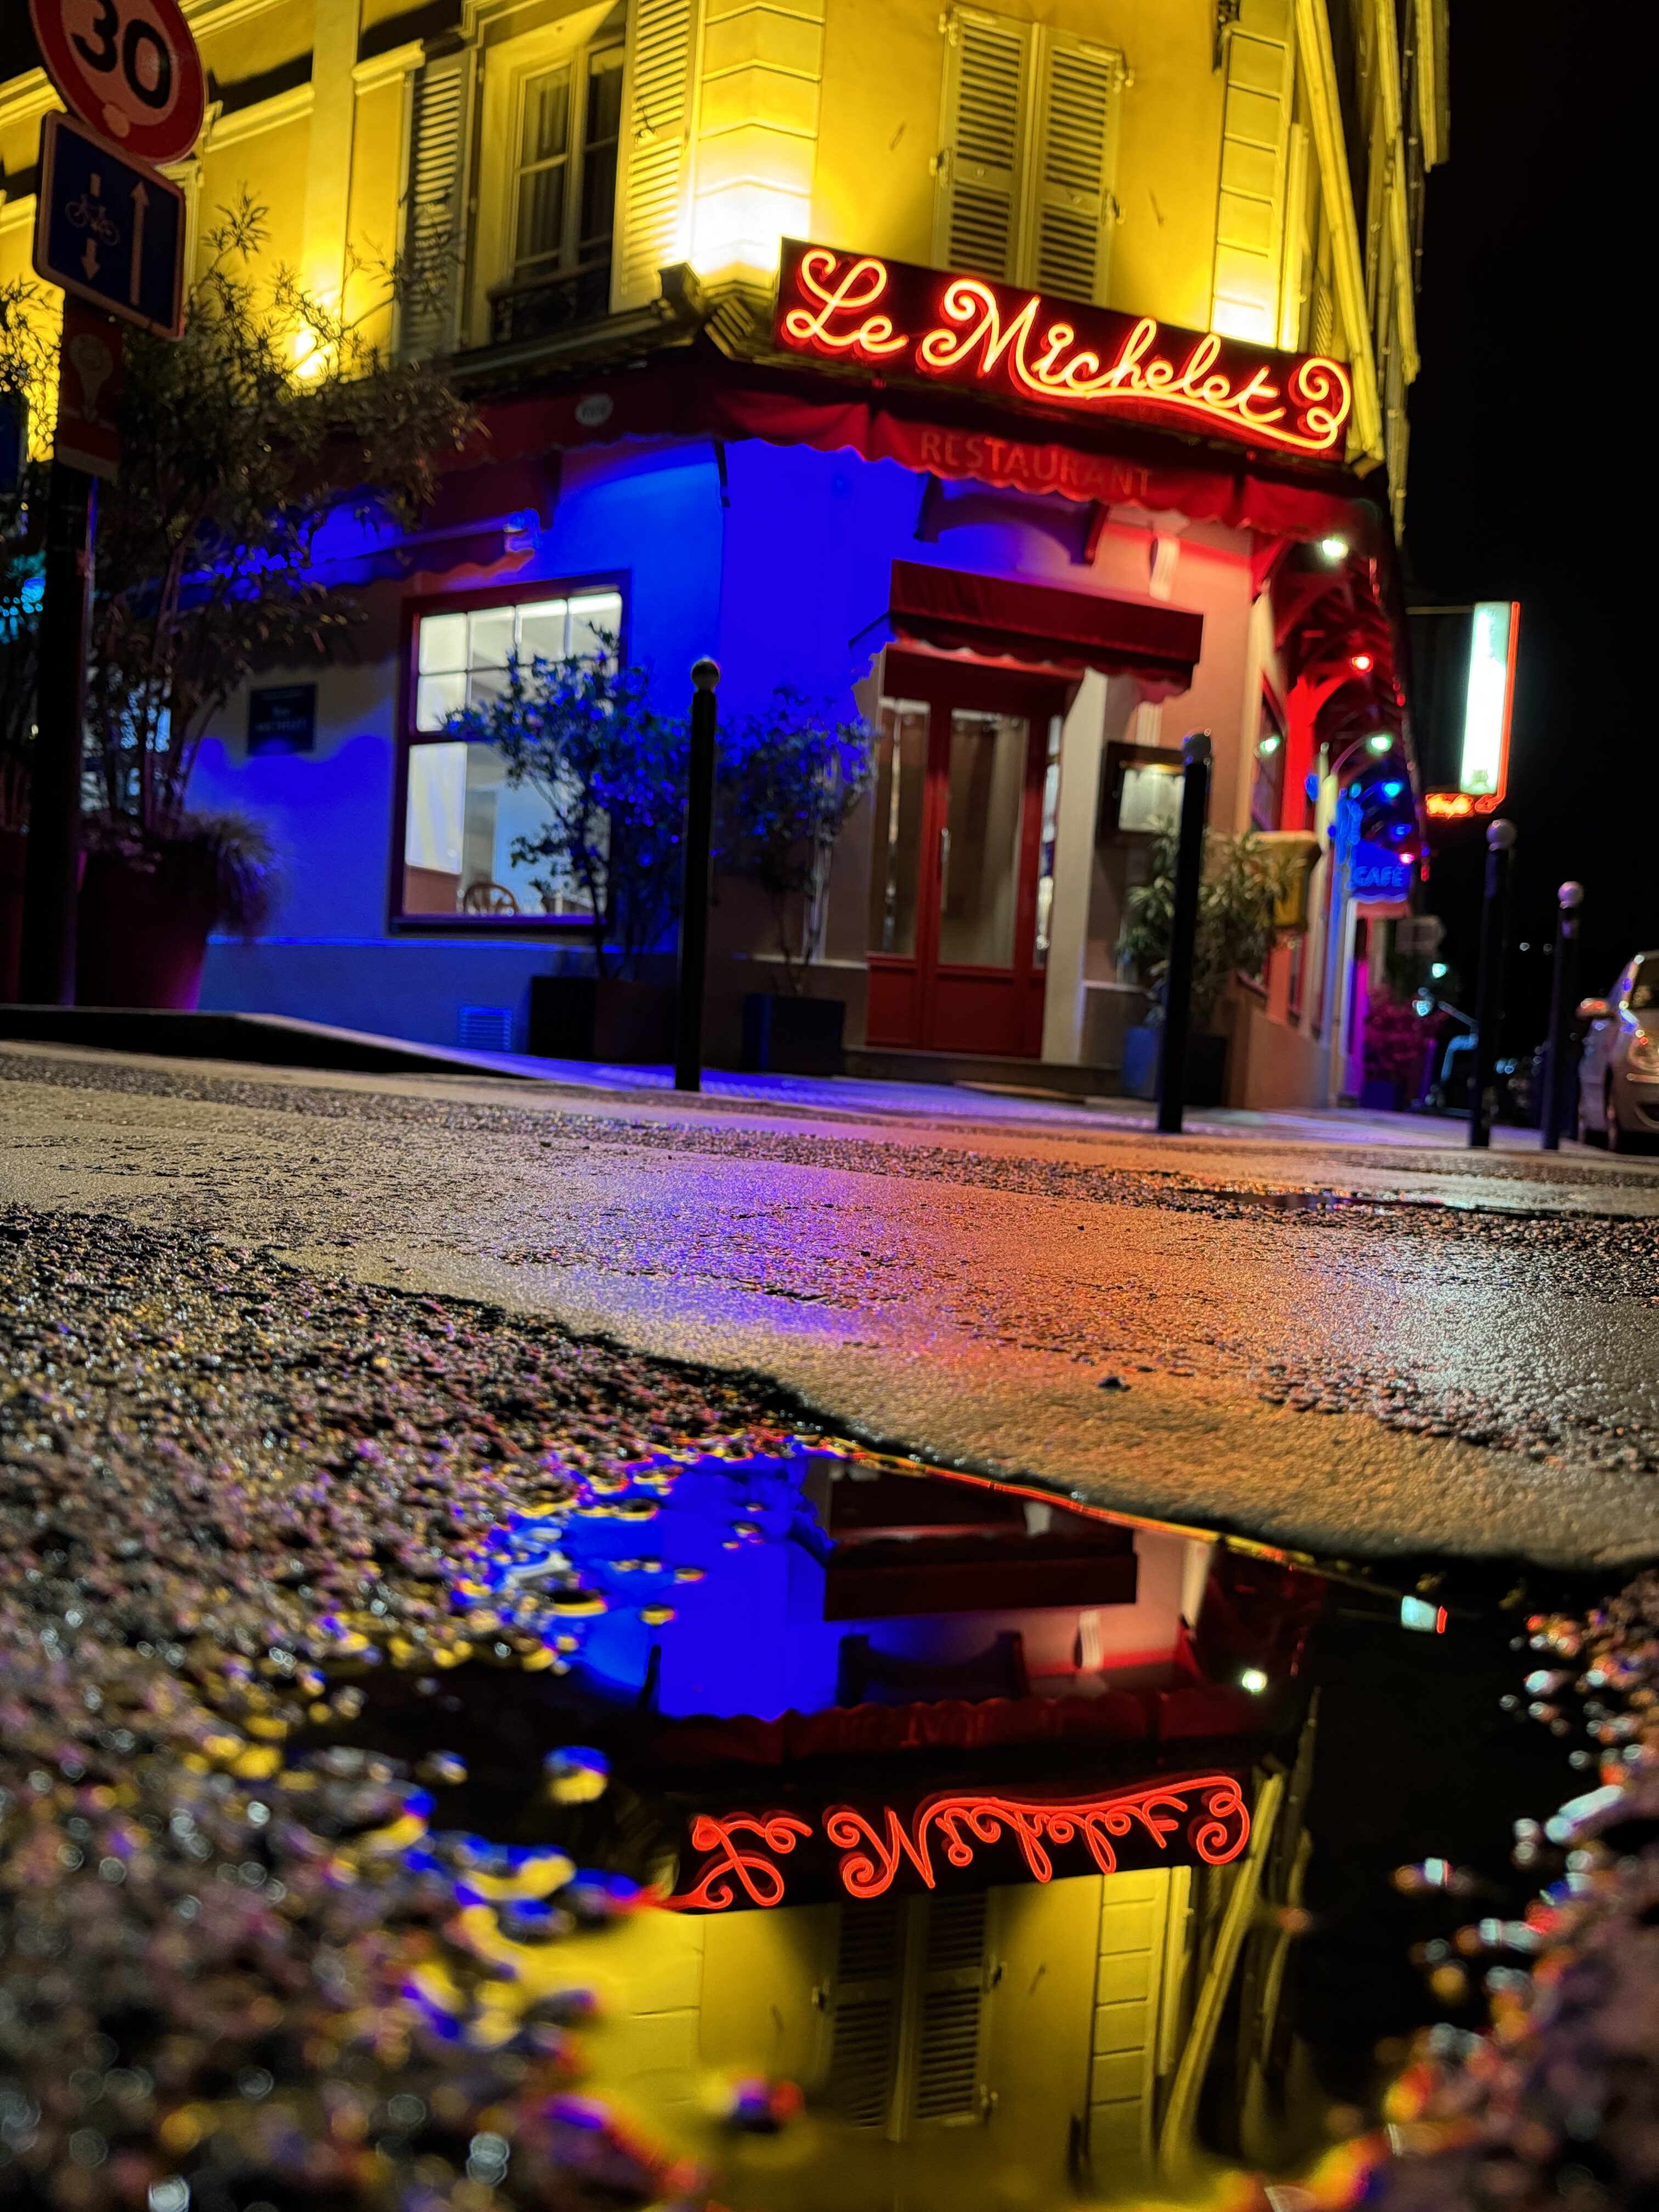
Lowlight
Photos & videos shot in low lighting conditions (<100 lux)
Zoom
Photos and videos captured using zoom (more than 1x)
Pros
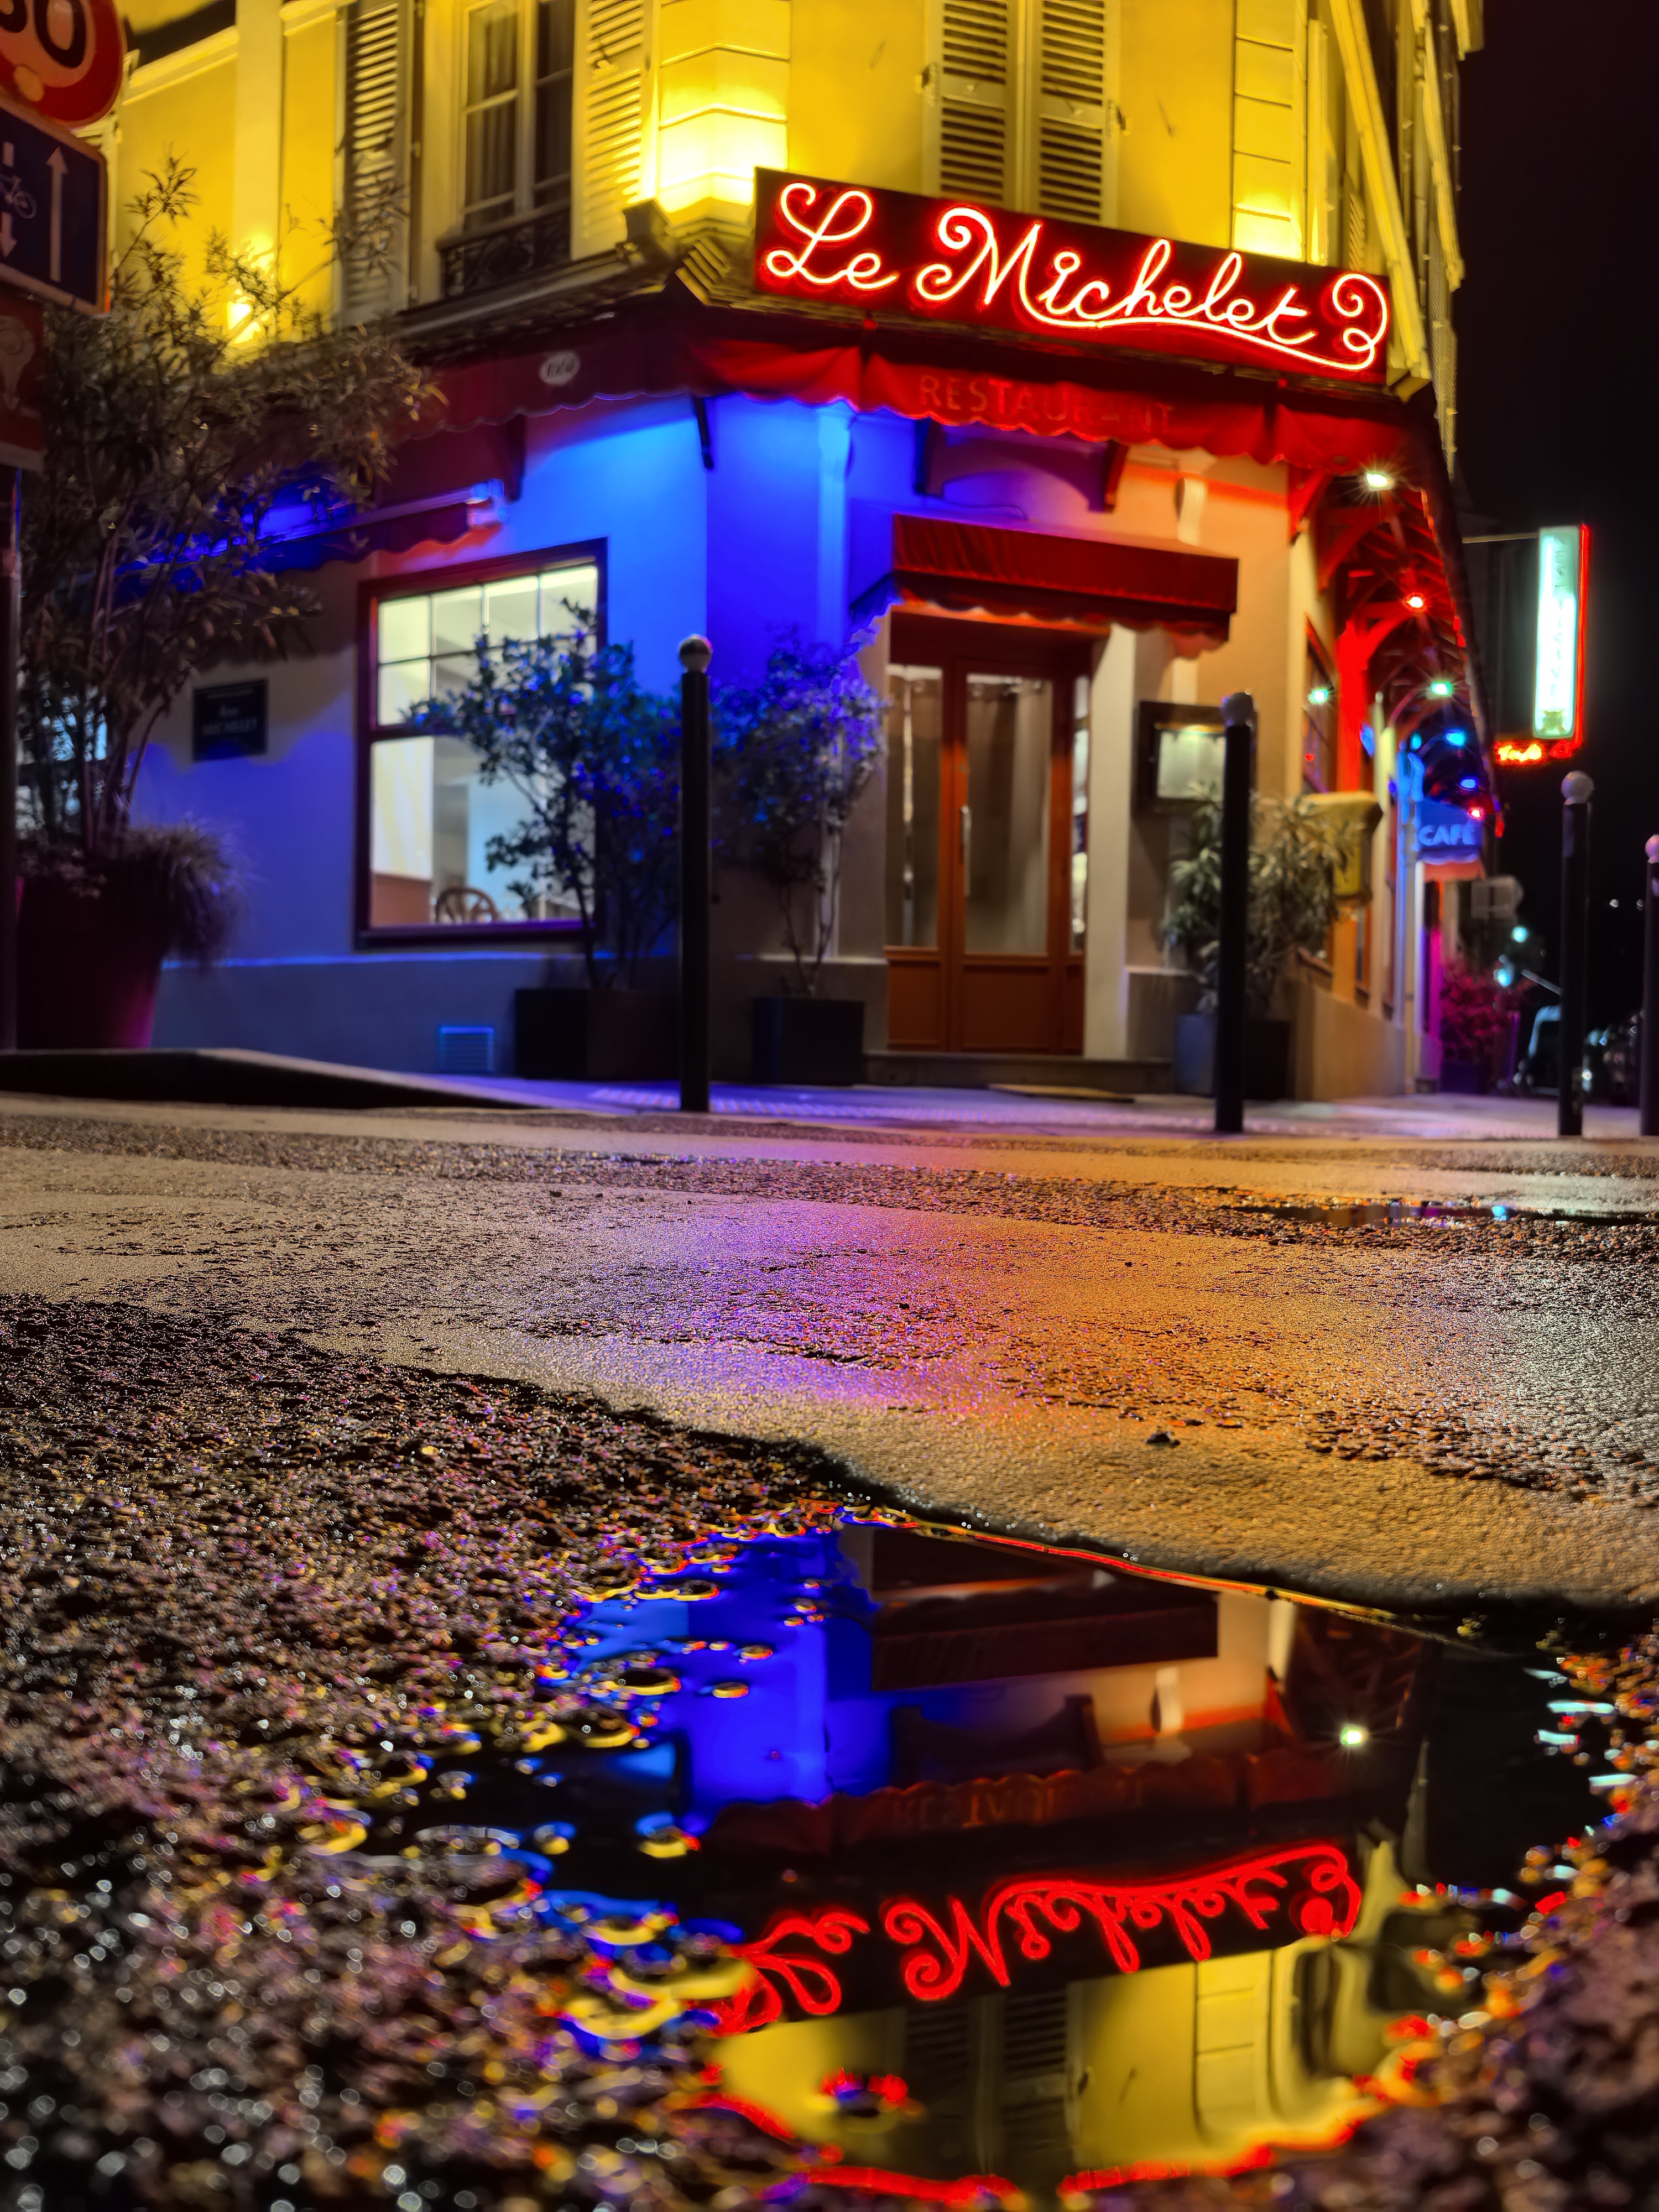
- Nicely balanced exposure and contrast across all light conditions; outstanding rendering when viewed on HDR display
- Very nice colors when viewed on HDR display
- Variable aperture allows for optimized depth of field in each scene
- Very good texture/noise trade-off across most conditions and in all zoom settings
- Natural blur in bokeh mode, smooth gradient, and accurate subject isolation
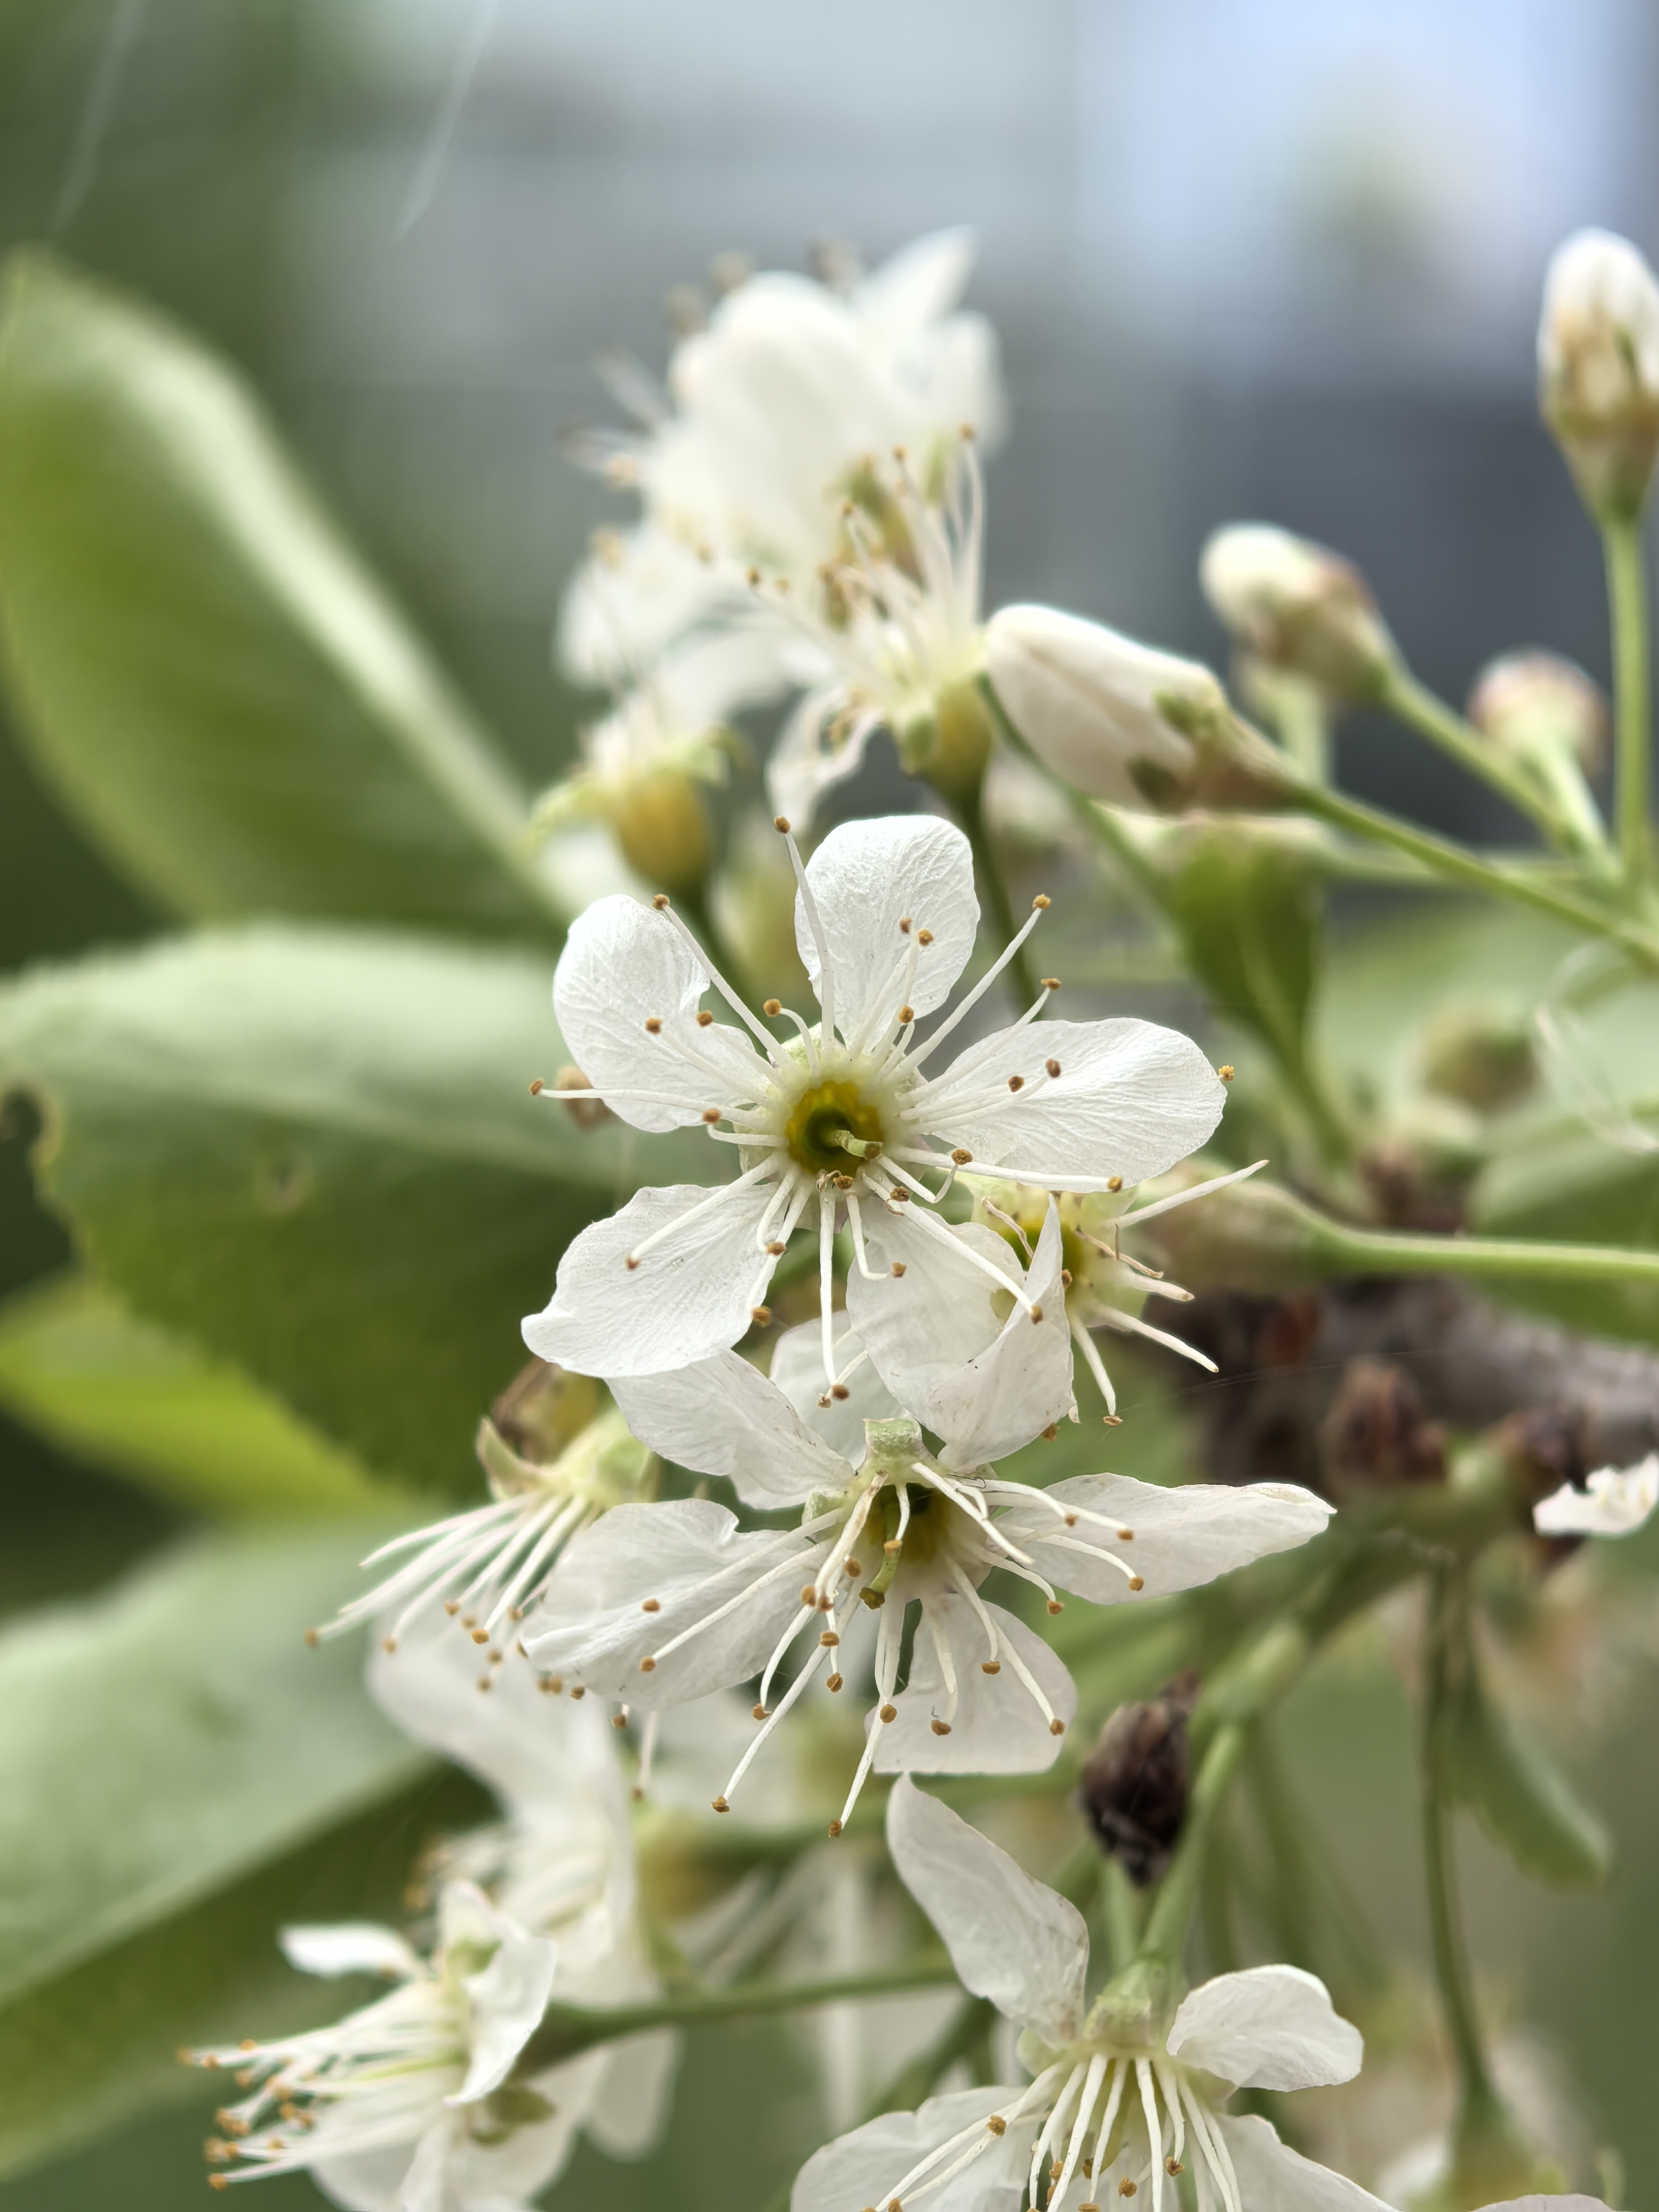
- 3.5x tele macro shots at f/2.1 offer nice perspective and good sharpness
Cons
- Local noise in video
- Ghosting in shots with moving subjects, even in bright light
- Occasional color quantization, especially in low light
- Occasional unnatural textures in low light and night shots
- Some unnatural rendering in tele zoom shots
Please note that while the text content below has been updated, the illustrations remain those from the original test. Images will be updated soon by the DXOMARK teams.
The Huawei Pura 70 Ultra delivered outstanding performances across all areas in the DXOMARK Camera tests, and now holds the second position in our smartphone camera rankings, based on the most recent evaluation of the device. Still image results were exceptional across all camera modules, resulting in top scores not only for photo but also for zoom—both wide and tele. The camera’s ability to balance detail retention and noise reduction was impressive, and images showed precise exposure and a wide dynamic range, as well as pleasant colors. Thanks to its large main camera sensor and careful tuning, the Huawei Pura 70 Ultra showed strong improvements in texture and noise compared to its predecessors. Good detail and exposure were maintained, even when shooting in low light. The device showed a particular ability to deliver images with natural skin-tone rendering and an accurate white balance even in very complex lighting conditions such as low light. The variable aperture helped provide optimal depth-of-field and good sharpness on all subjects in group shots. The autofocus was fast and reliable in static and dynamic scenes alike in most environment. The fast shutter time and response allowed for freezing motion and capturing the decisive moment.
It’s worth noting that since the initial testing (run on the previous version of the camera protocol) , the Huawei Pura 70 Ultra has received a major firmware update introducing support for ISO gain map format. This enhancement ensure accurate HDR content display across a wide range of devices and applications, including Google Chrome and HDR-capable displays, making the phone’s imaging results more widely viewable than before. This update significantly improved contrast and color rendering. However, a few regressions were observed compared to the initially tested version of the Huawei Pura 70 Ultra, such as slightly increased noise in video, some focusing issues measured on our new AF-HDR Portrait setup and a reduced texture quality at long zoom ranges. Despite these drawbacks, the overall performance of the Huawei Pura 70 Ultra still remains extremely competitive, including at the time of writing.
Video was tested on the Huawei Pura 70 Ultra in 4K/30fps mode using the HDR Vivid format. Although the Pura 70 Ultra progressed in certain aspects of video performance over the Mate 60 Pro+, the Pura 70 Ultra could not quite match the current best video devices, the Apple iPhone 16 Pro Max and the Oppo Find X8 Ultra, when it came to the most challenging low-light test scenes.
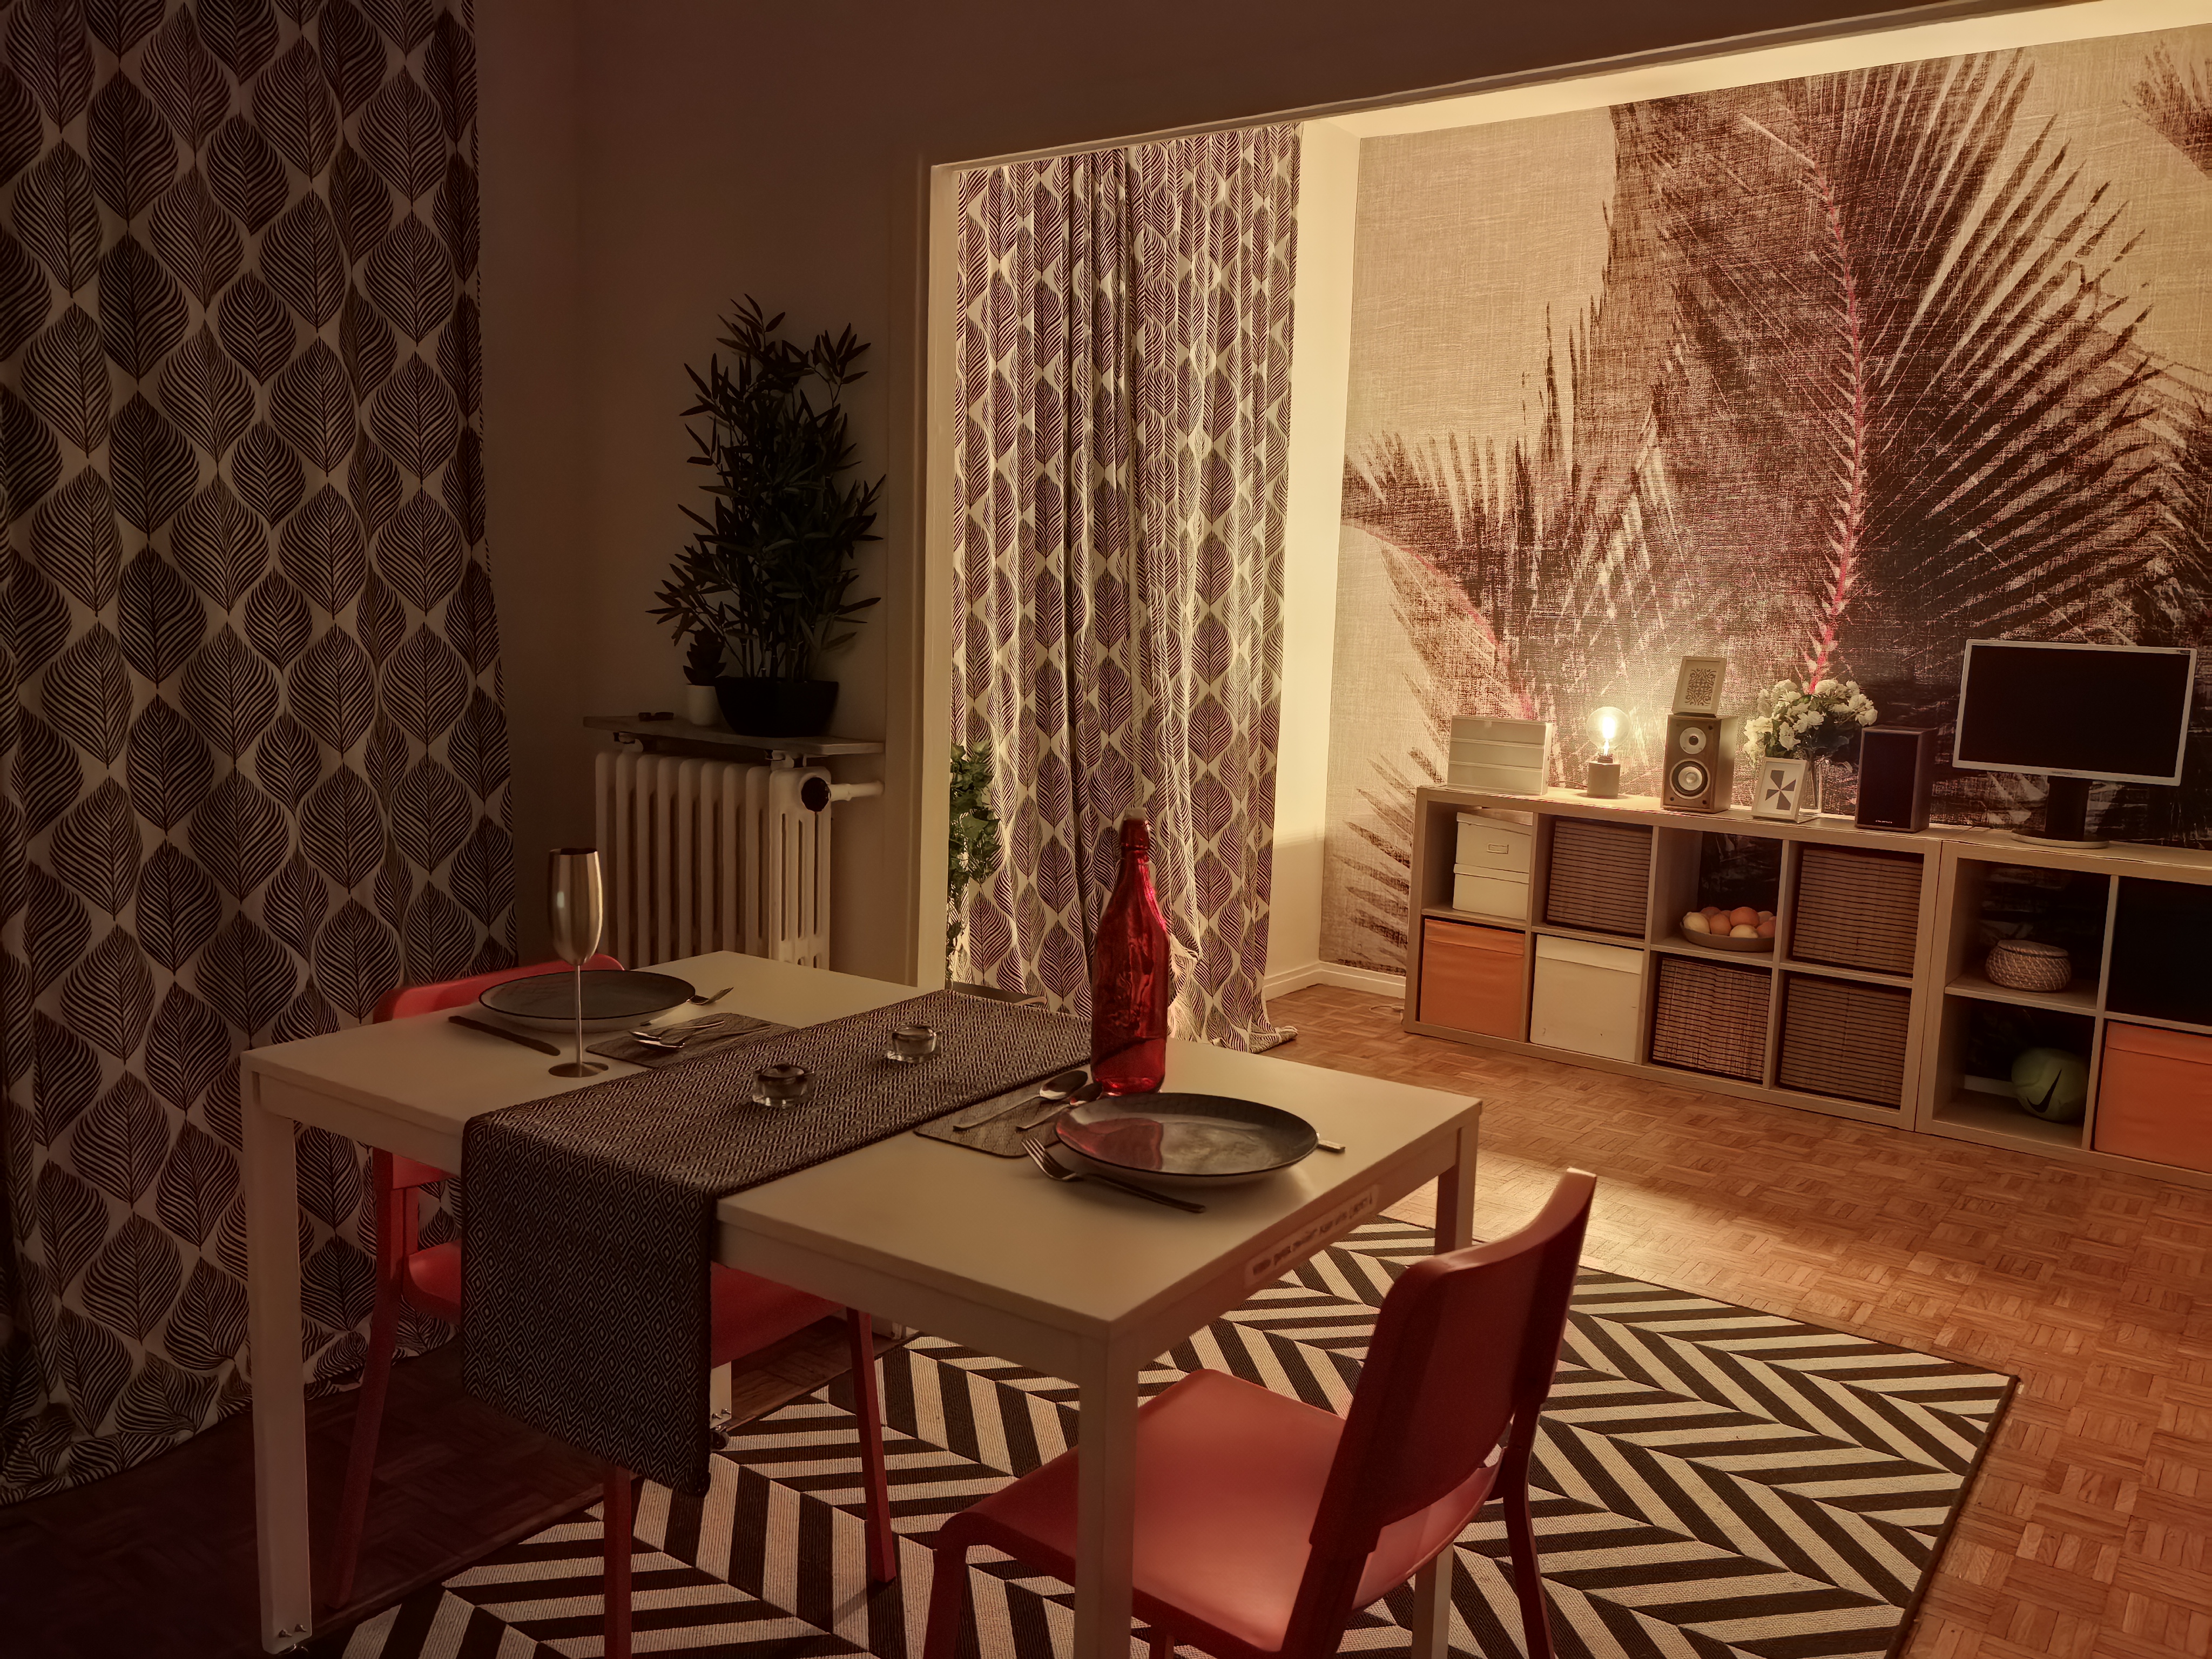
The Huawei Pura 70 Ultra delivers strong low-light camera performance across all modules, maintaining good detail, accurate exposure, and low noise levels even in challenging conditions. Thanks to its large main sensor, effective HDR processing, and advanced noise reduction, the device captures scenes with a wide dynamic range, preserving highlights and shadow details better than most competitors. Skin tones remain natural and white balance is generally accurate, even under mixed artificial lighting. Autofocus is responsive and reliable in dim conditions, and motion is well frozen thanks to short shutter times. While some noise can still appear in very dark areas, the overall low-light imaging experience is impressive and consistent, ranking among the best in its class.
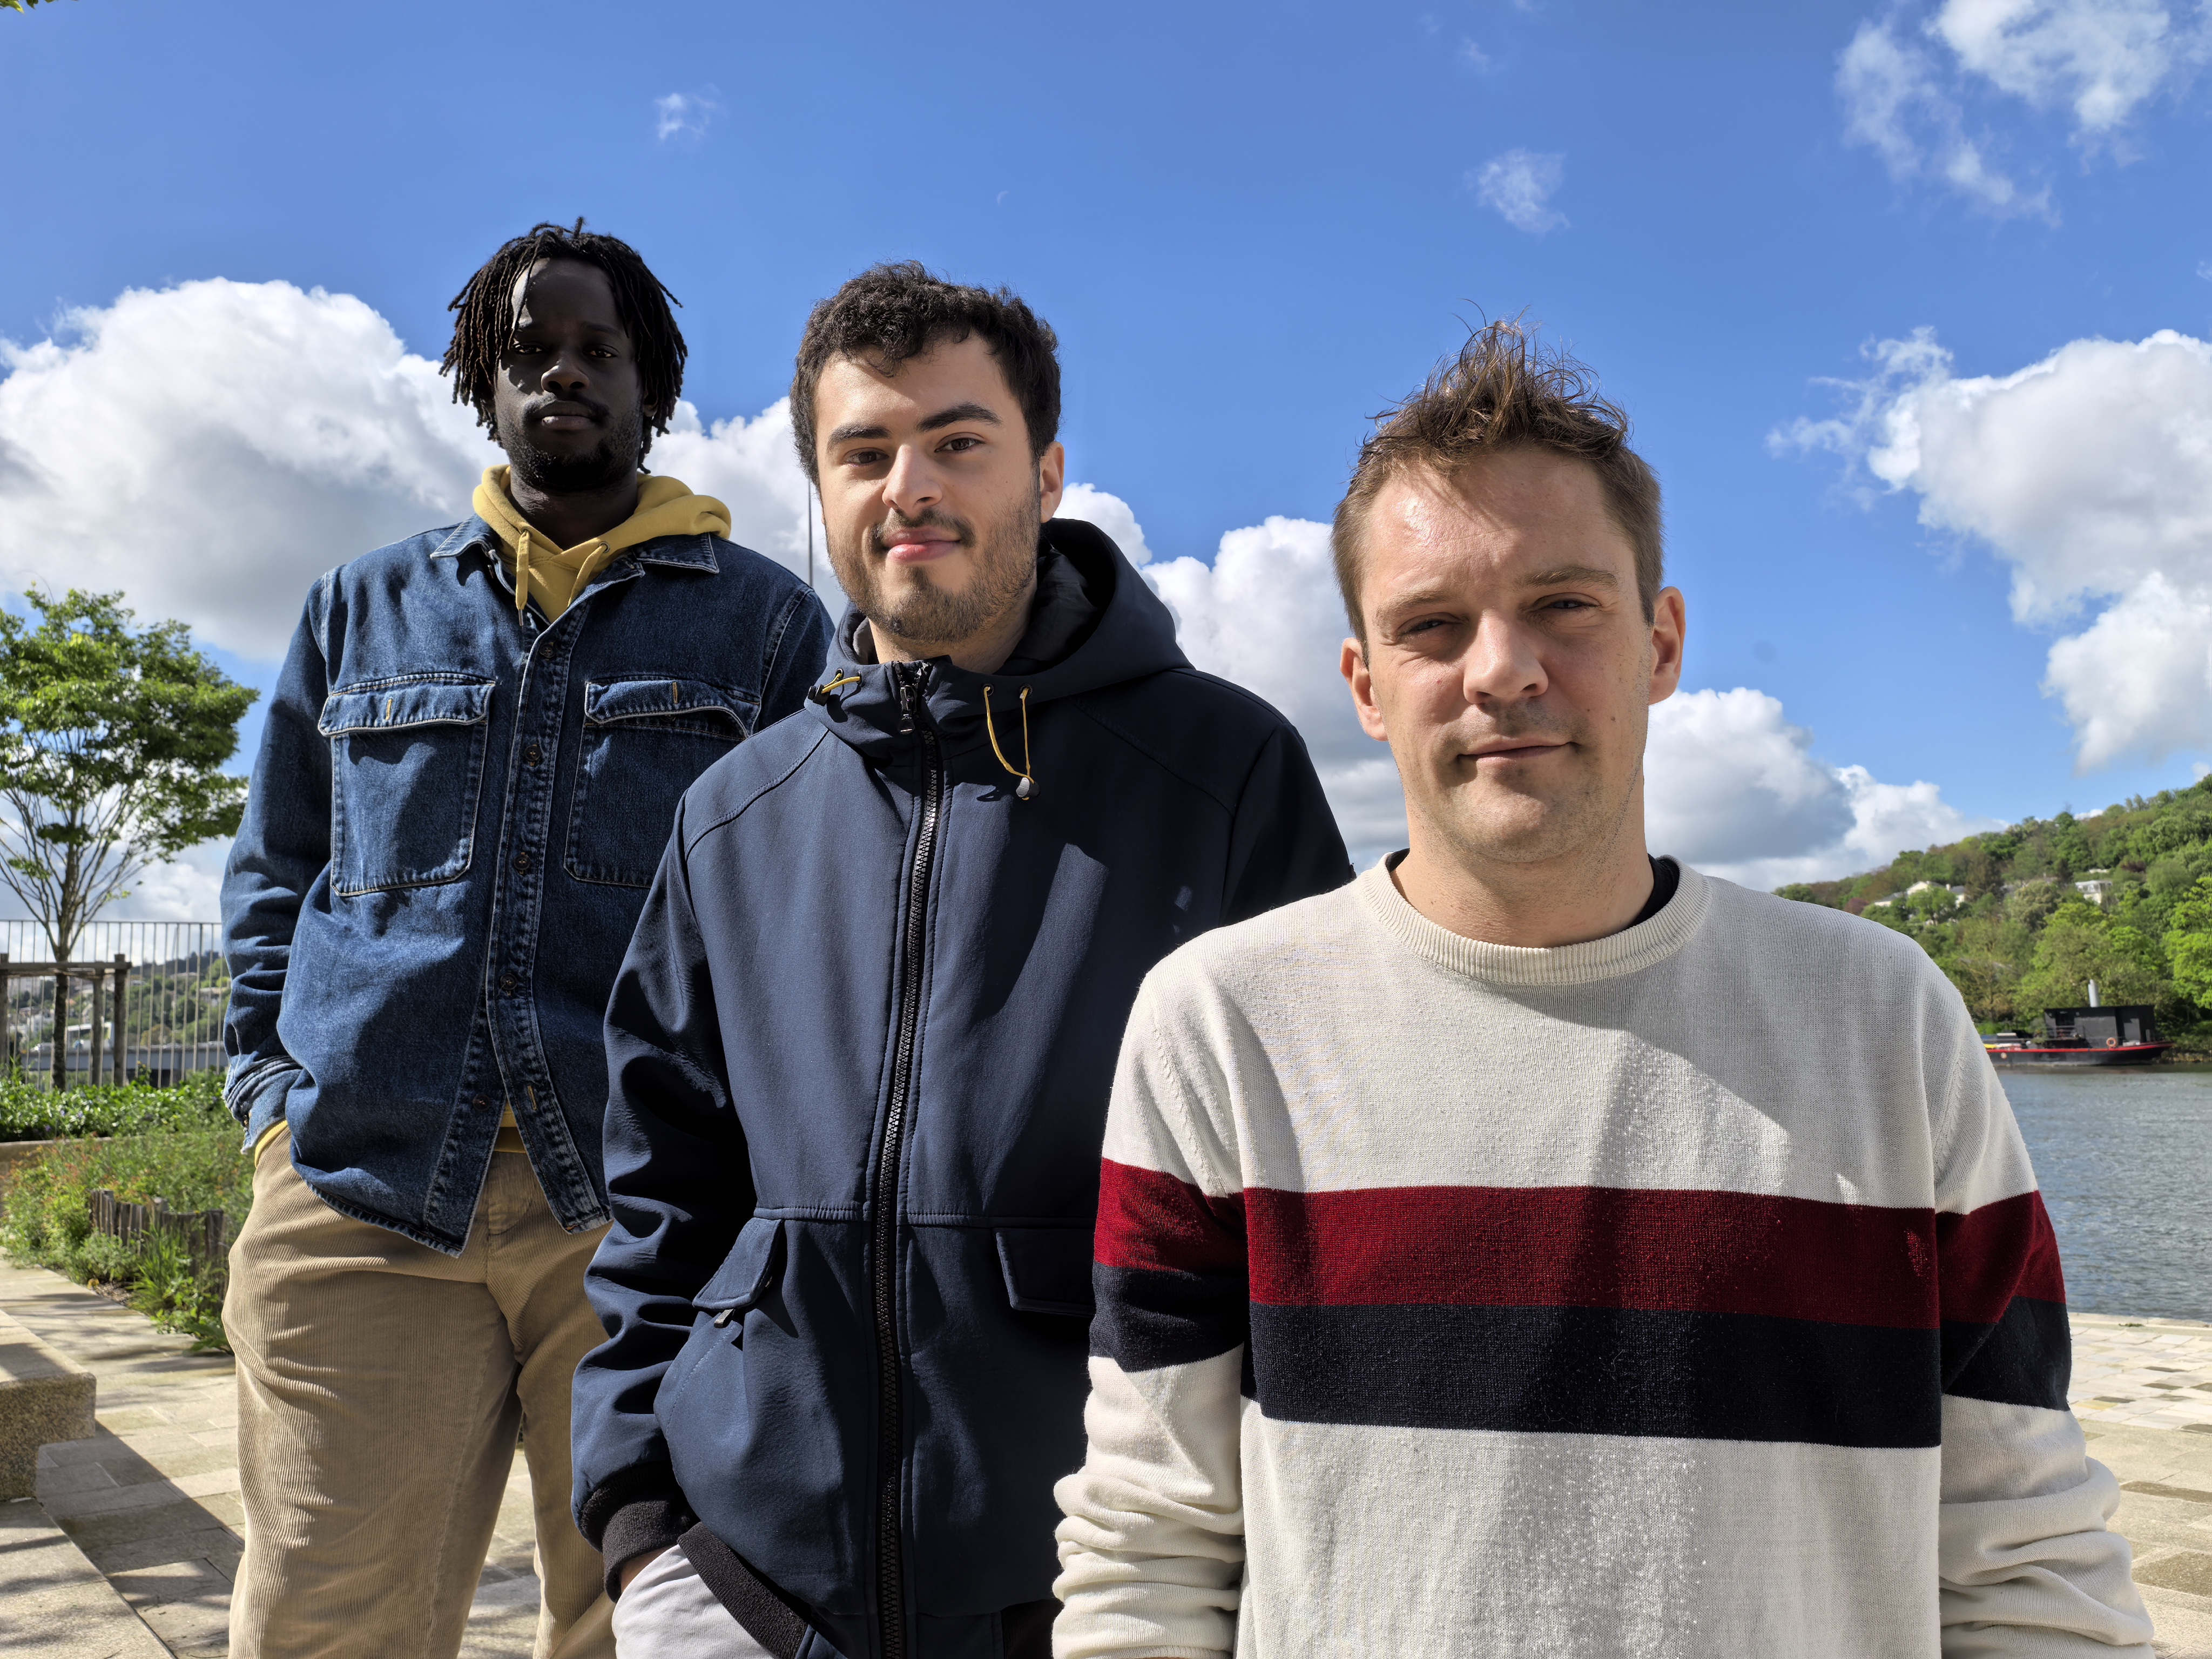
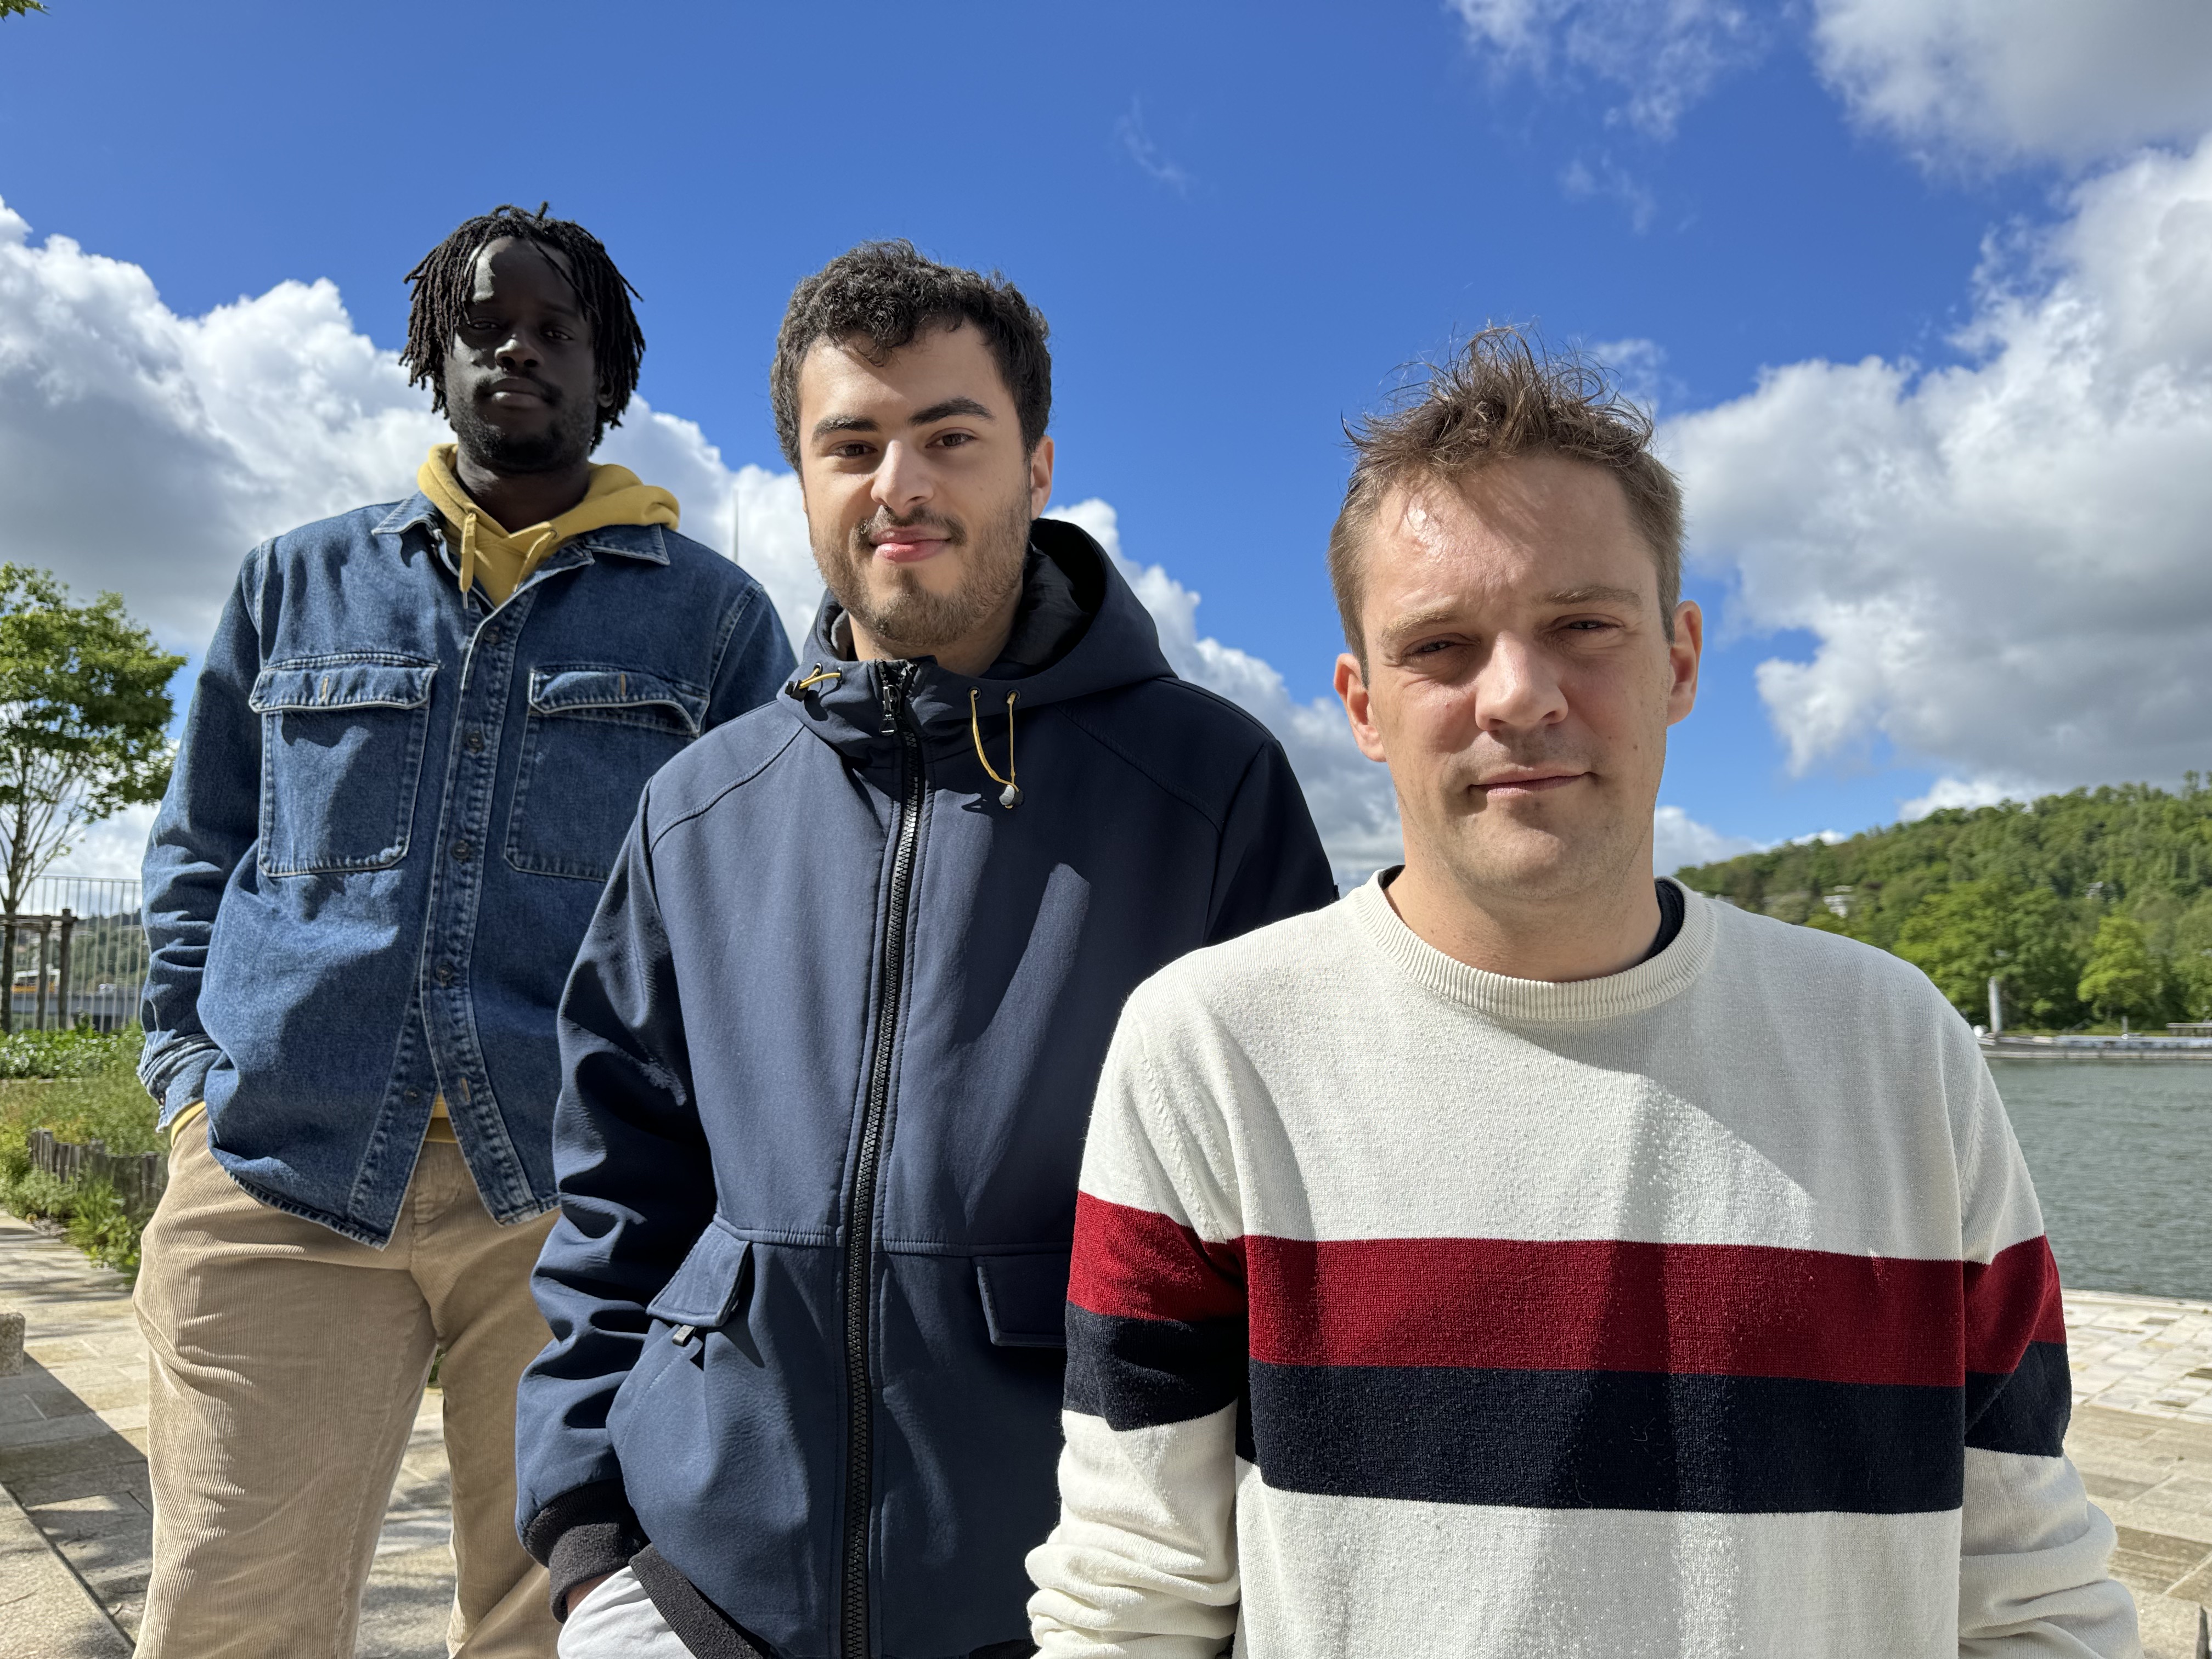
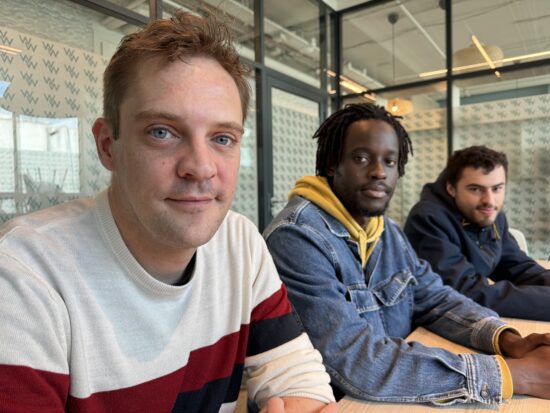
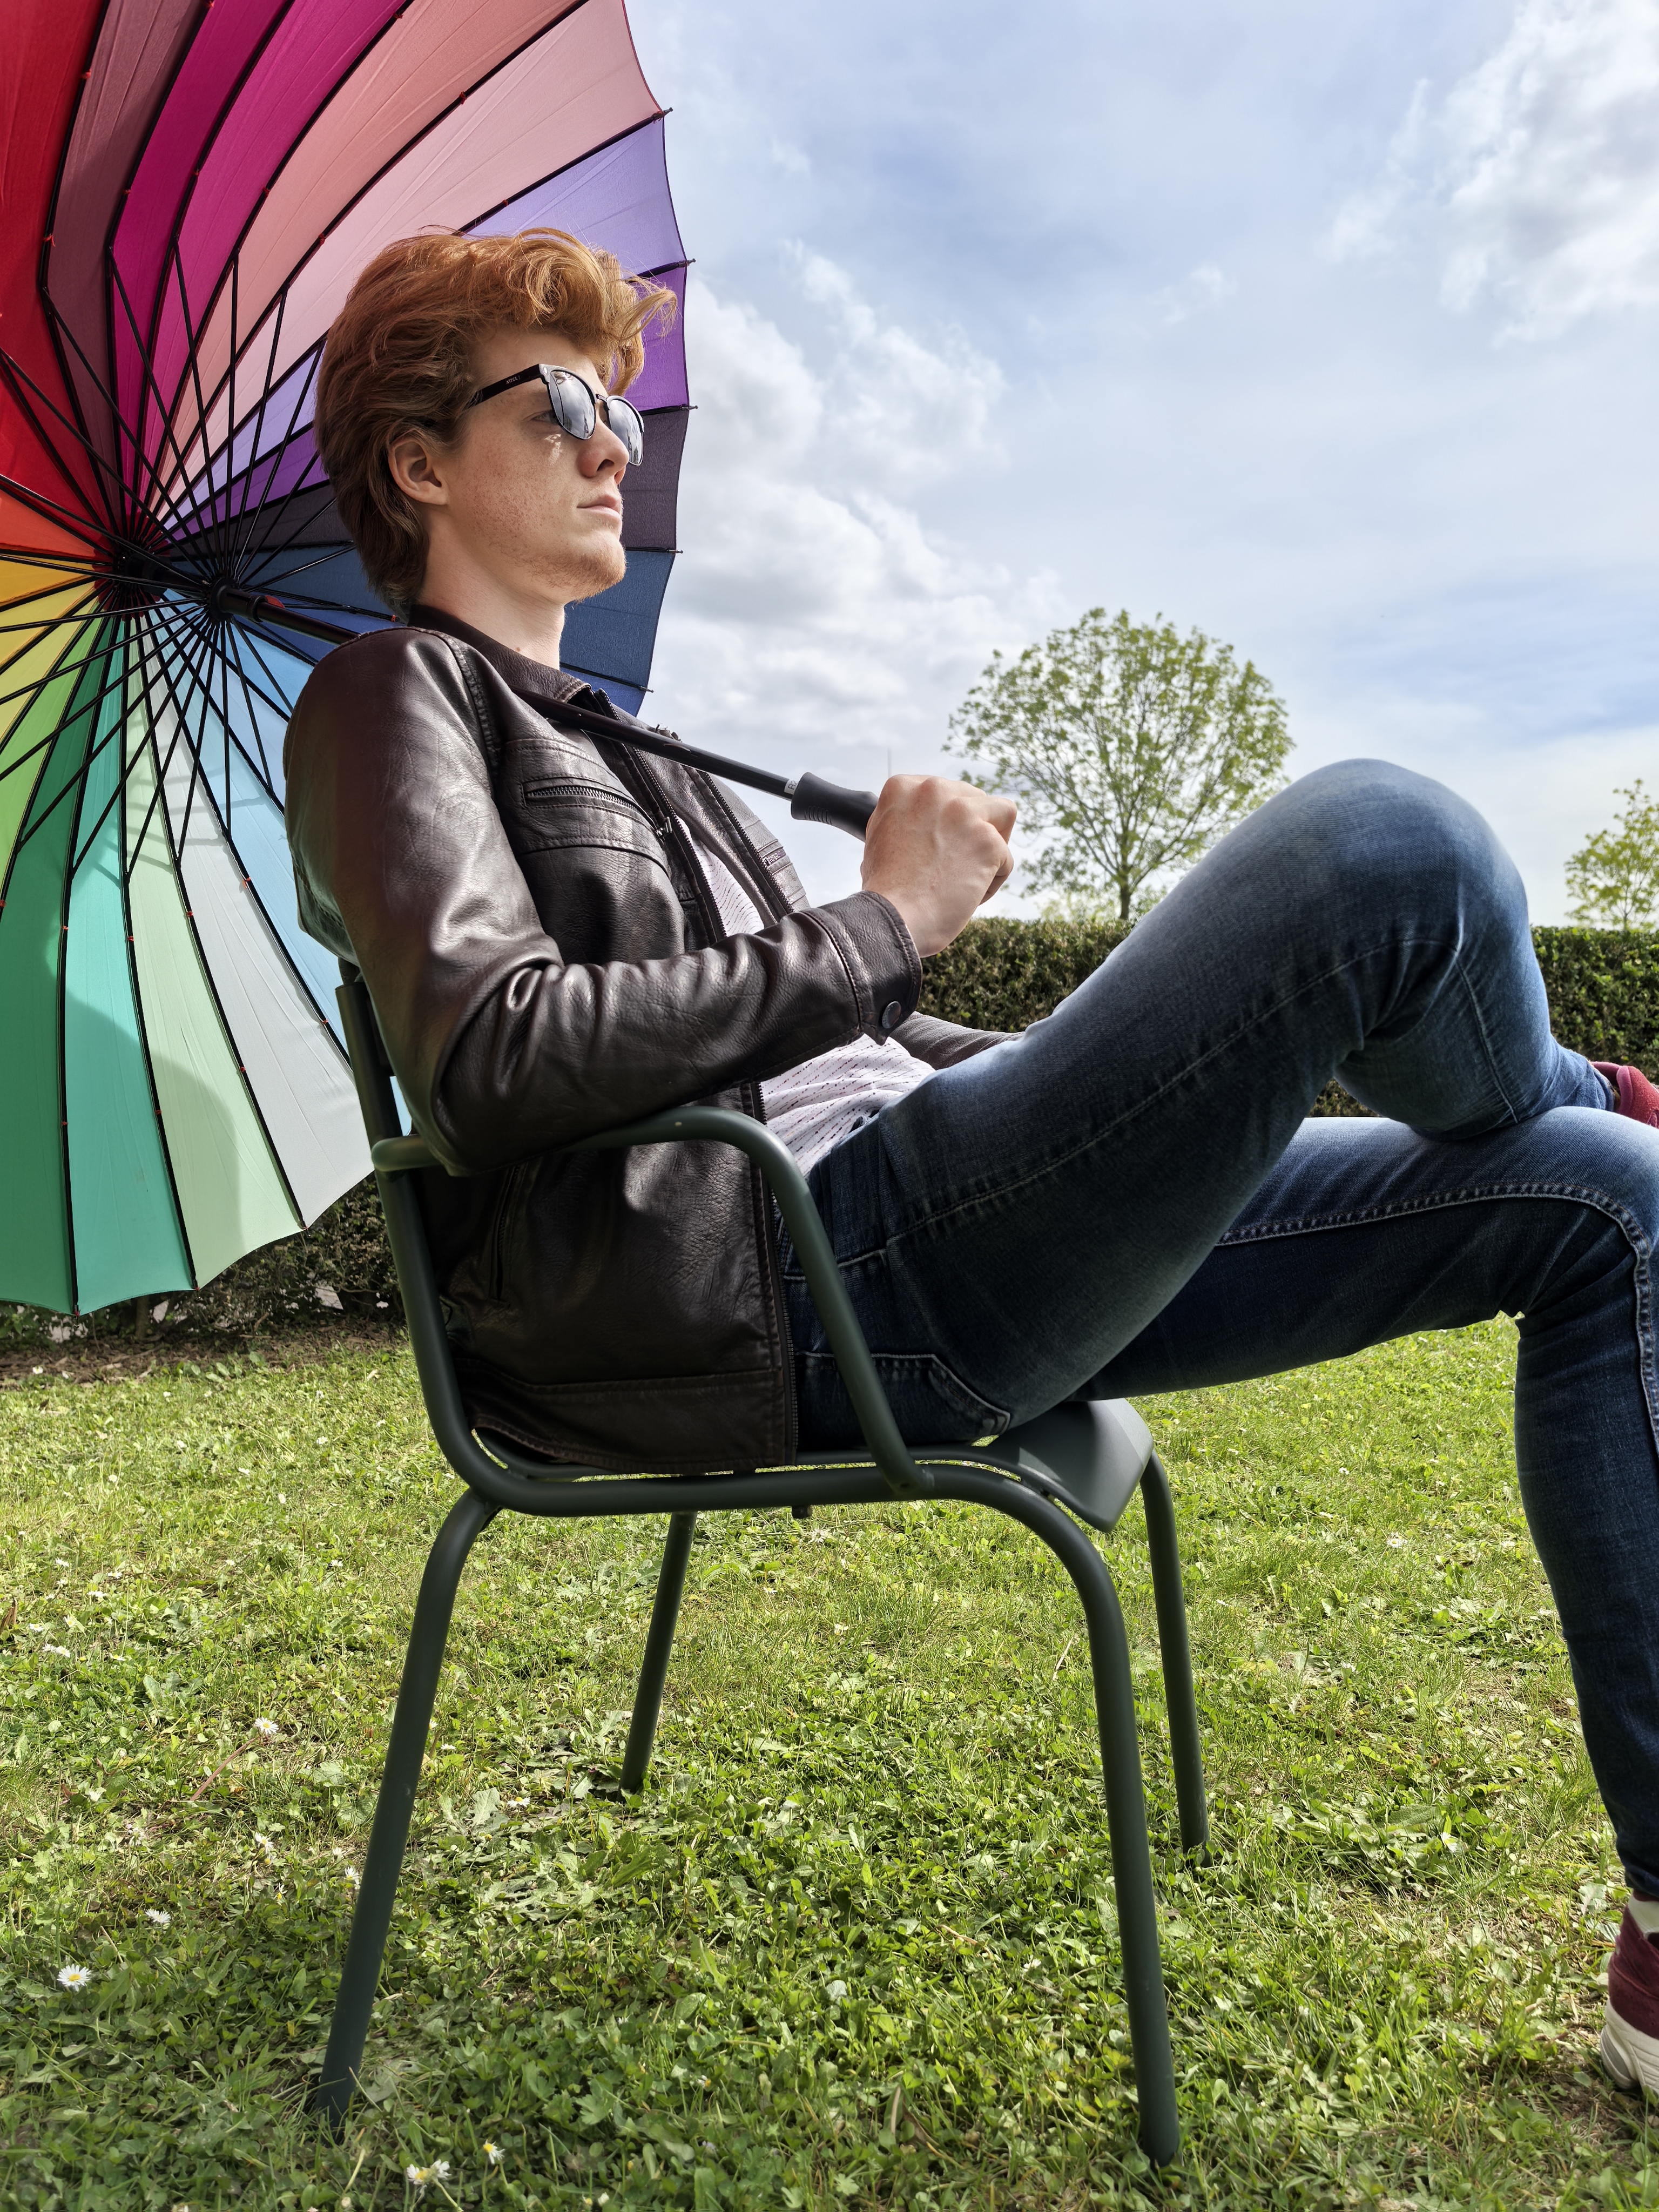
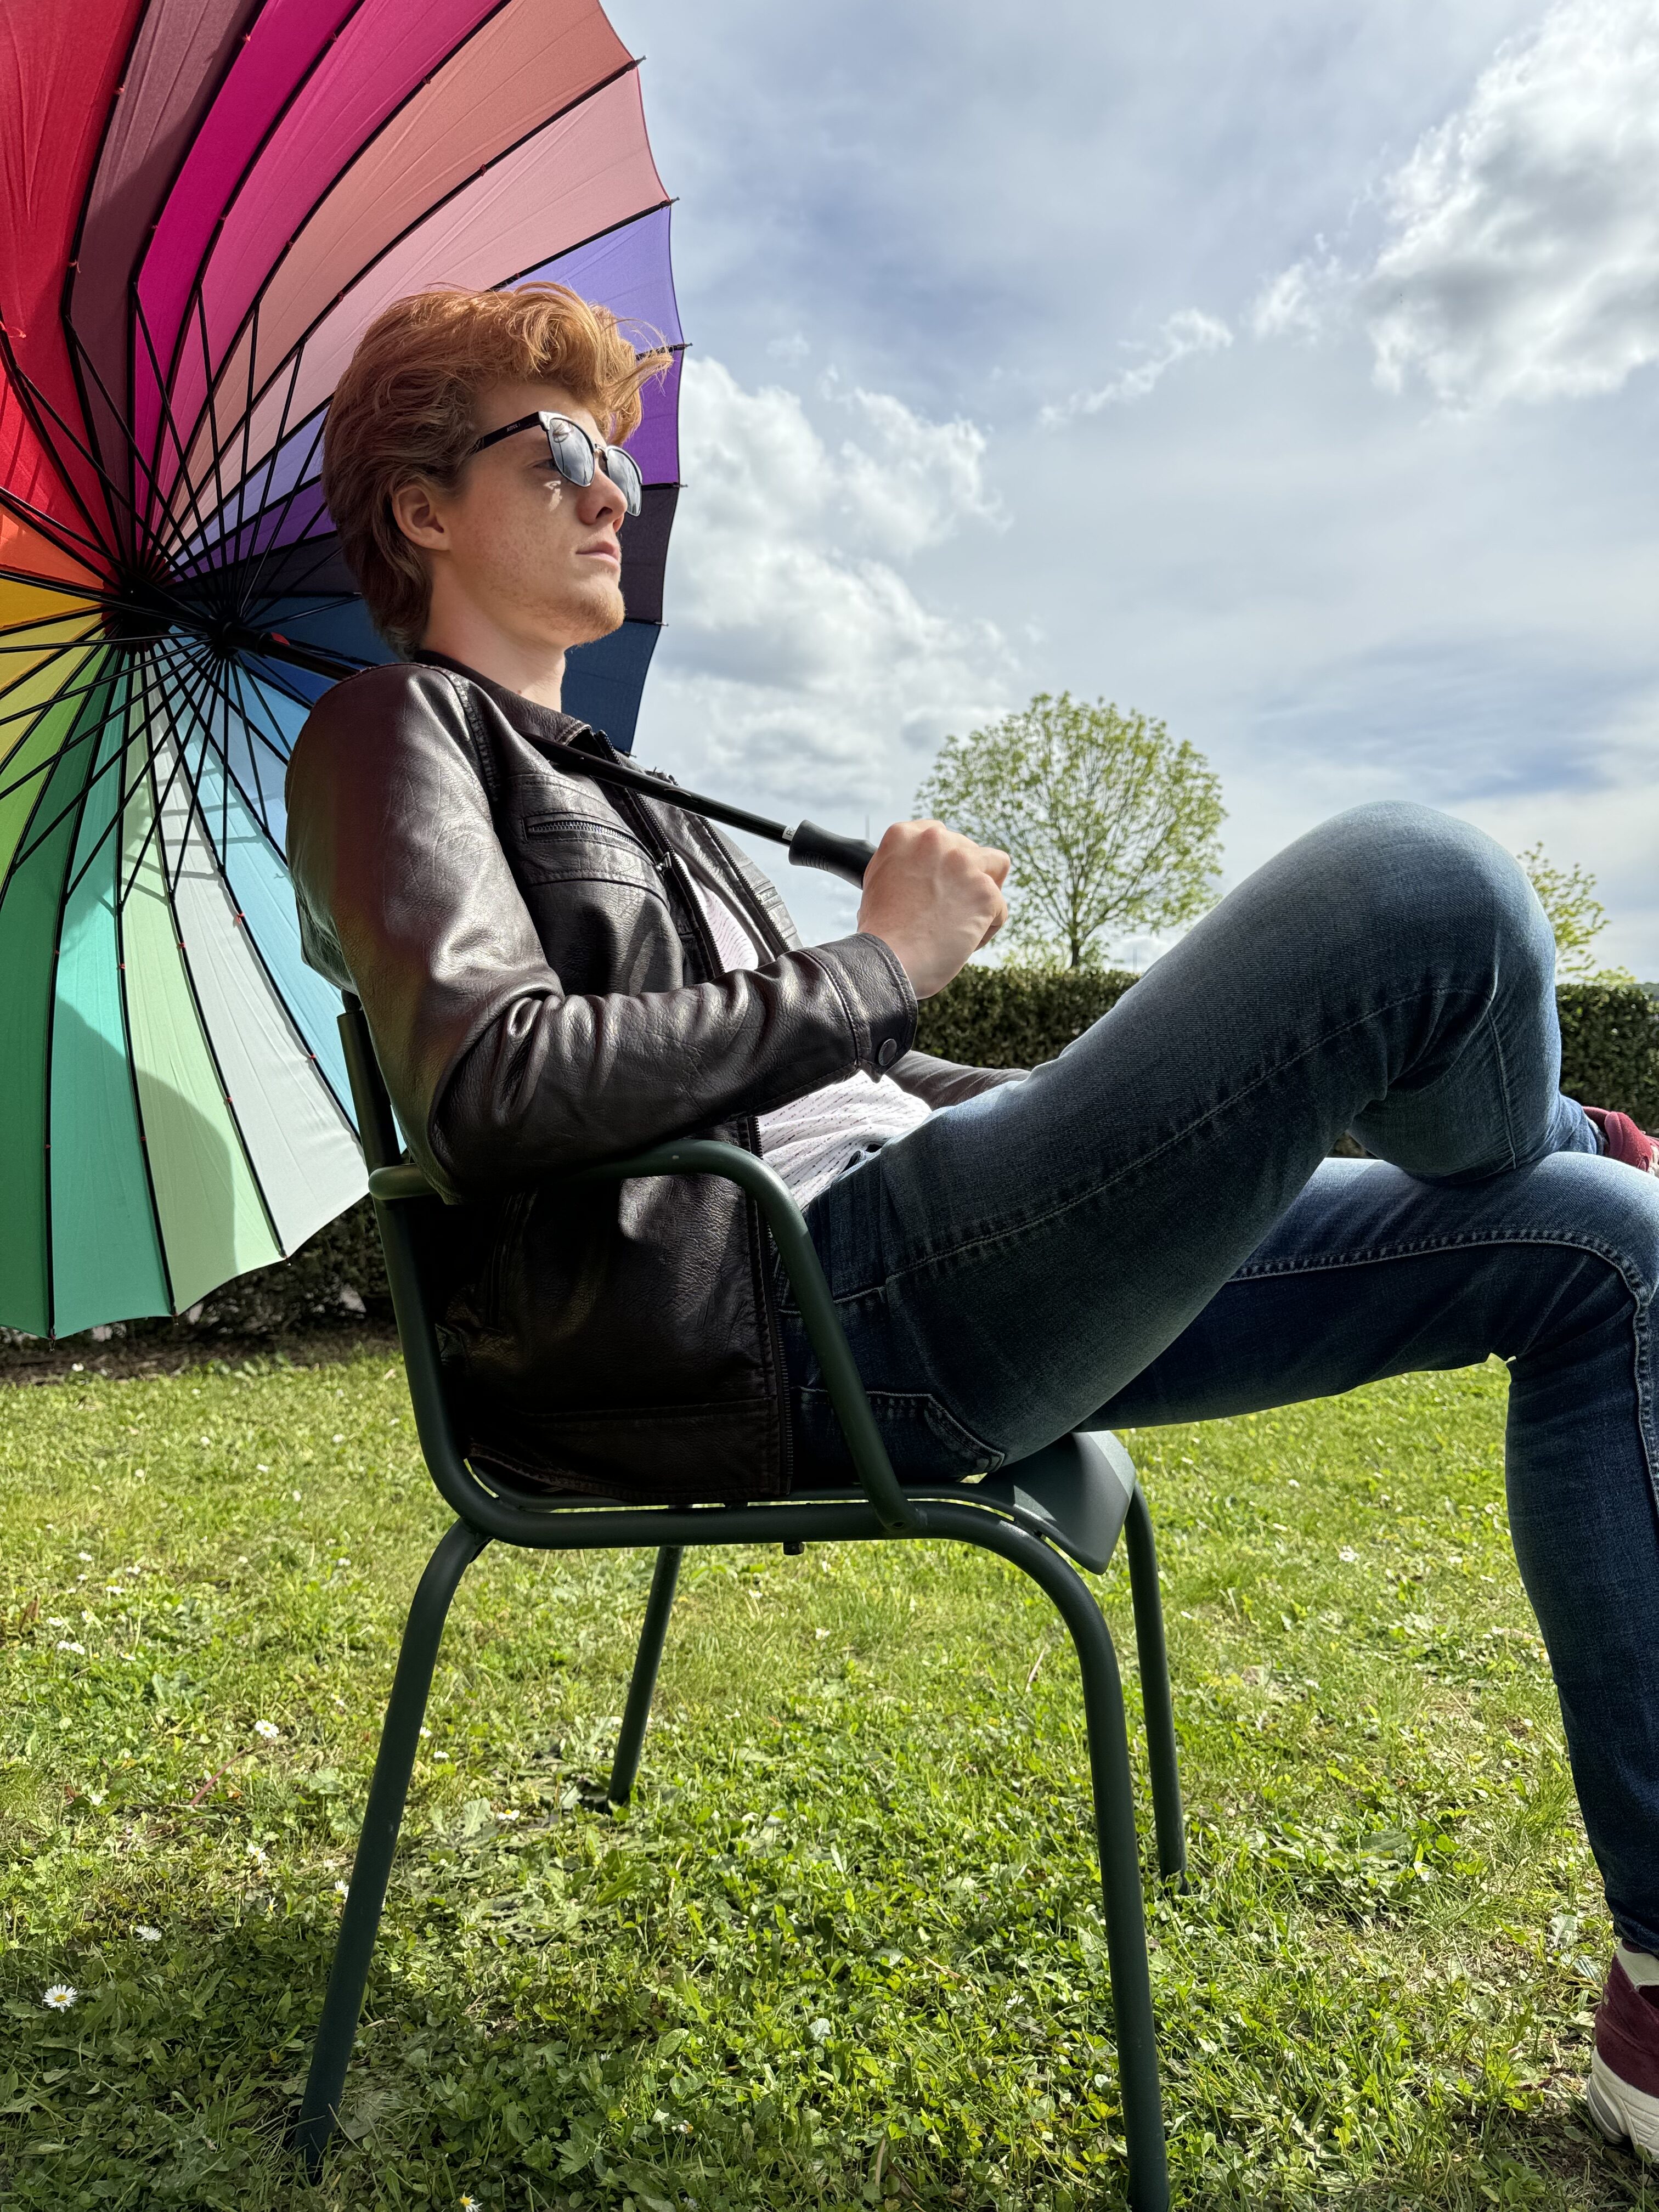
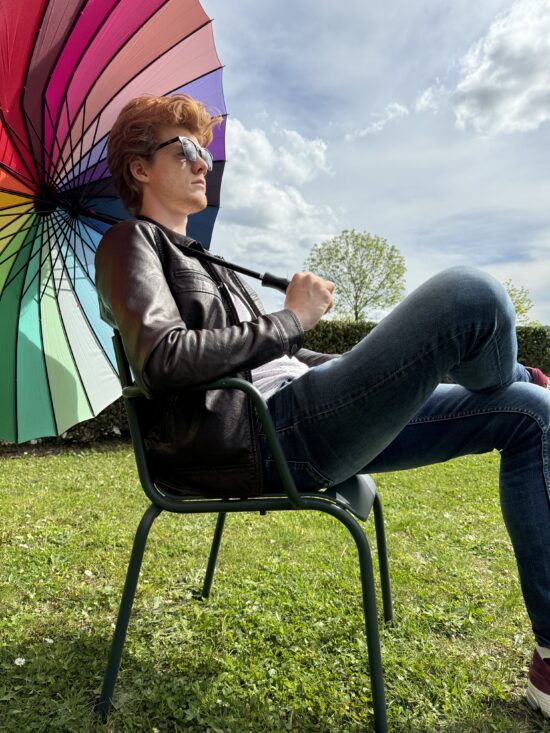
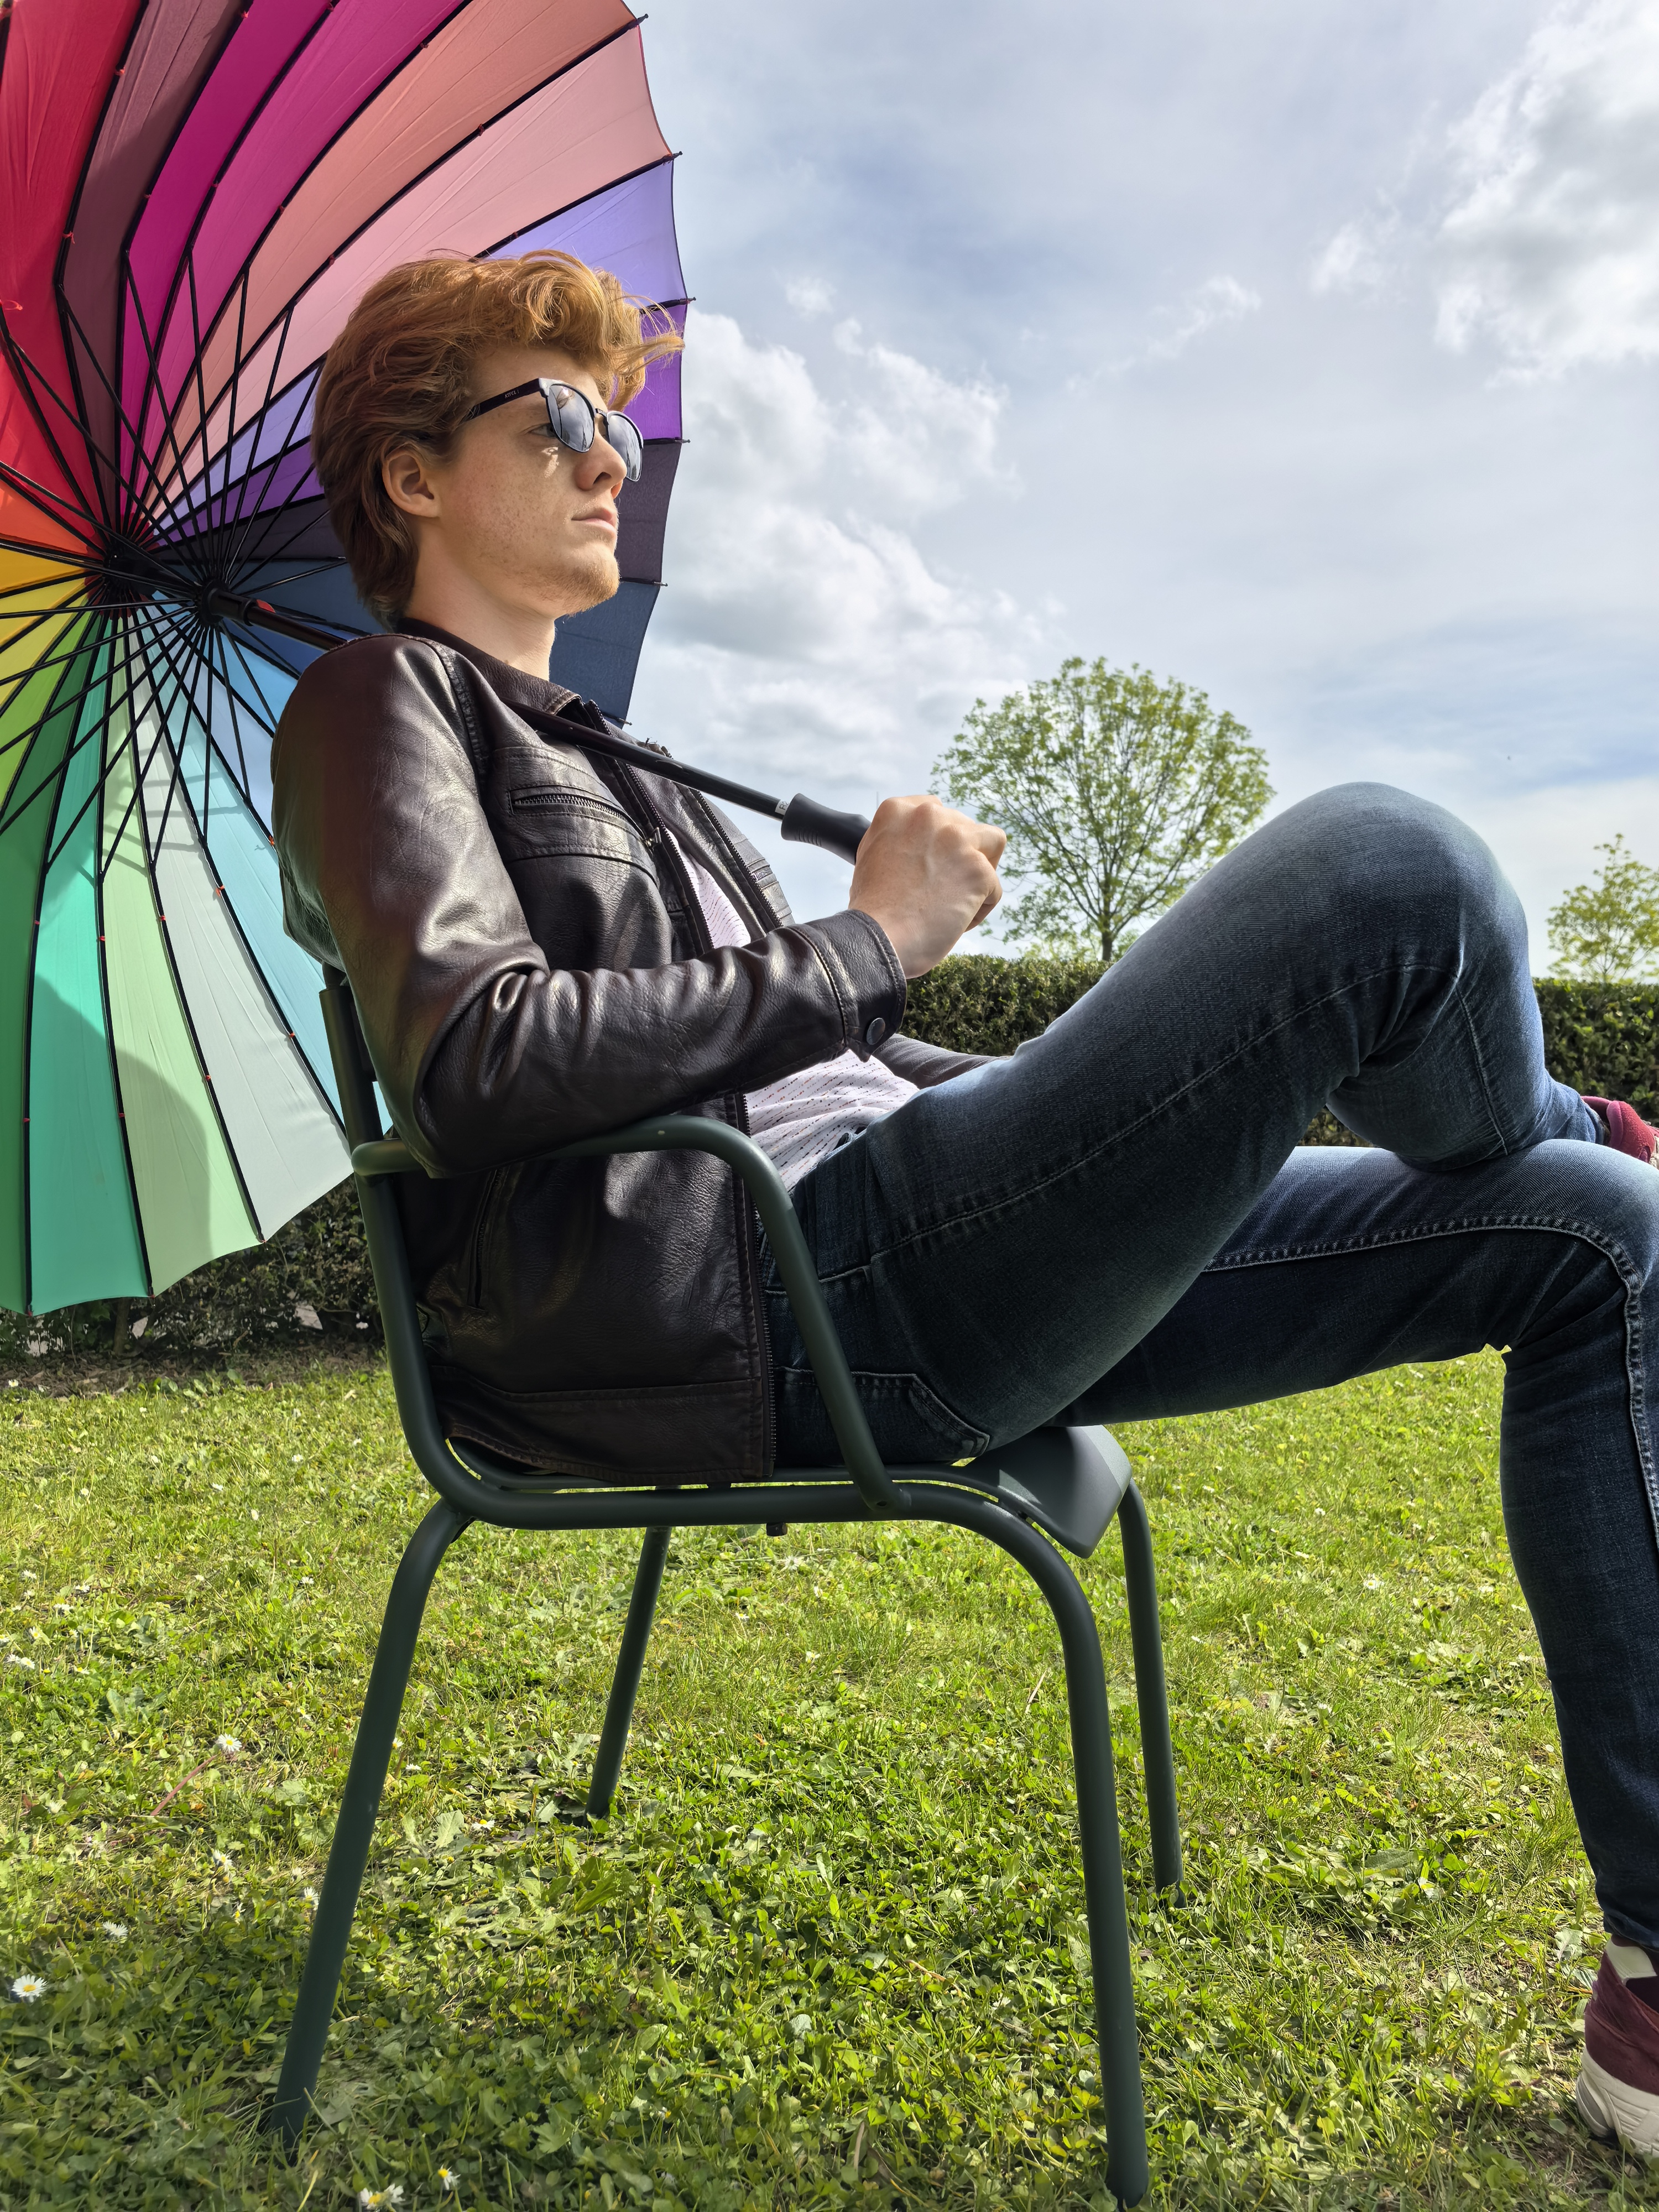
The Huawei Pura 70 Ultra offers excellent portrait photography performance across default, bokeh, and telephoto modes. In default mode, it captures subjects with natural skin tones, sharp facial details, and a pleasing balance of texture and noise, even in indoor or low-light settings. The bokeh mode produces a realistic depth-of-field effect, with well-shaped blur gradients and effective subject separation, although occasional edge artifacts can still appear in complex scenes. Thanks to the variable aperture on the main camera, depth-of-field is handled intelligently, enhancing group and single-subject portraits. At 3.5× telephoto, portraits benefit from natural perspective compression, good subject isolation, and consistent color and exposure, though fine details may appear slightly softer than at 1×. Overall, the Pura 70 Ultra delivers high-quality portrait results with aesthetic rendering and strong versatility across focal lengths.

The Huawei Pura 70 Ultra’s telephoto performance is among the best, delivering high-quality images across a wide zoom range. Its 3.5× periscope telephoto lens captures excellent detail, with natural texture rendering, well-controlled noise, and consistent exposure with the main camera, especially in bright conditions. At medium- to high-zoom levels, the device maintains good fairly sharpness and contrast, making it well-suited for portraits and distant subjects. At longer range, the level of details tend to drop and the device is not in par with the performances of top devices among its category like Xiaomi 15 Ultra and Oppo FindX8 Ultra
Test summary
About DXOMARK Camera tests: DXOMARK’s camera evaluations take place in laboratories and real-world situations using a wide variety of use-cases. The scores rely on objective tests for which the results are calculated directly using measurement software in our laboratory setups, and on perceptual tests where a sophisticated set of metrics allow a panel of image experts to compare aspects of image quality that require human judgment. Testing a smartphone involves a team of engineers and technicians for about a week. Photo and Video quality are scored separately and then combined into an overall score for comparison among the cameras in different devices. For more information about the DXOMARK Camera protocol, click here. More details on smartphone camera scores are available here. The following section gathers key elements of DXOMARK’s exhaustive tests and analyses. Full performance evaluations are available upon request. Please contact us on how to receive a full report.
Photo
Huawei Pura 70 Ultra
180
For scoring and analysis, DXOMARK engineers capture and evaluate more than 3,800 test images in controlled lab environments as well as outdoor, indoor and low-light natural scenes, using the camera’s default settings. The photo protocol is designed to take into account the main use cases and is based on typical shooting scenarios, such as portraits, landscape and zoom photography. The evaluation is performed by visually inspecting images against a reference of natural scenes, and by running objective measurements on images of charts captured in the lab under different lighting conditions from 0.1 to 10,000+ lux and color temperatures from 2,300K to 6,500K.

Main
Huawei Pura 70 Ultra
184
In photo mode, the Huawei Pura 70 Ultra delivered very strong performances only topped by Oppo Find X8 Ultra at Camera v6 launch. The combination of the large 1” image sensor and the f/1.6 – 4.0 variable aperture allowed for depth of field adjustments and creative flexibility that is pretty much unheard of in the smartphone world. In our tests, photos offered nice colors and good contrast when viewed on an HDR display. Dynamic range was wide, and good face exposure made for pleasant portrait shots. White balance was accurate, and the atmosphere of the ambient light was captured nicely. The autofocus was fast and accurate, and the camera managed a good trade-off between noise reduction and texture preservation.
Minor issues included some slight exposure and white balance instabilities, as well as an occasional ghosting effect, especially when shooting high-contrast scenes. Our testers also noticed slight noise in very low-light shots. The device also showed some regression when heavily challenged on its autofocus performances with this new version tested.
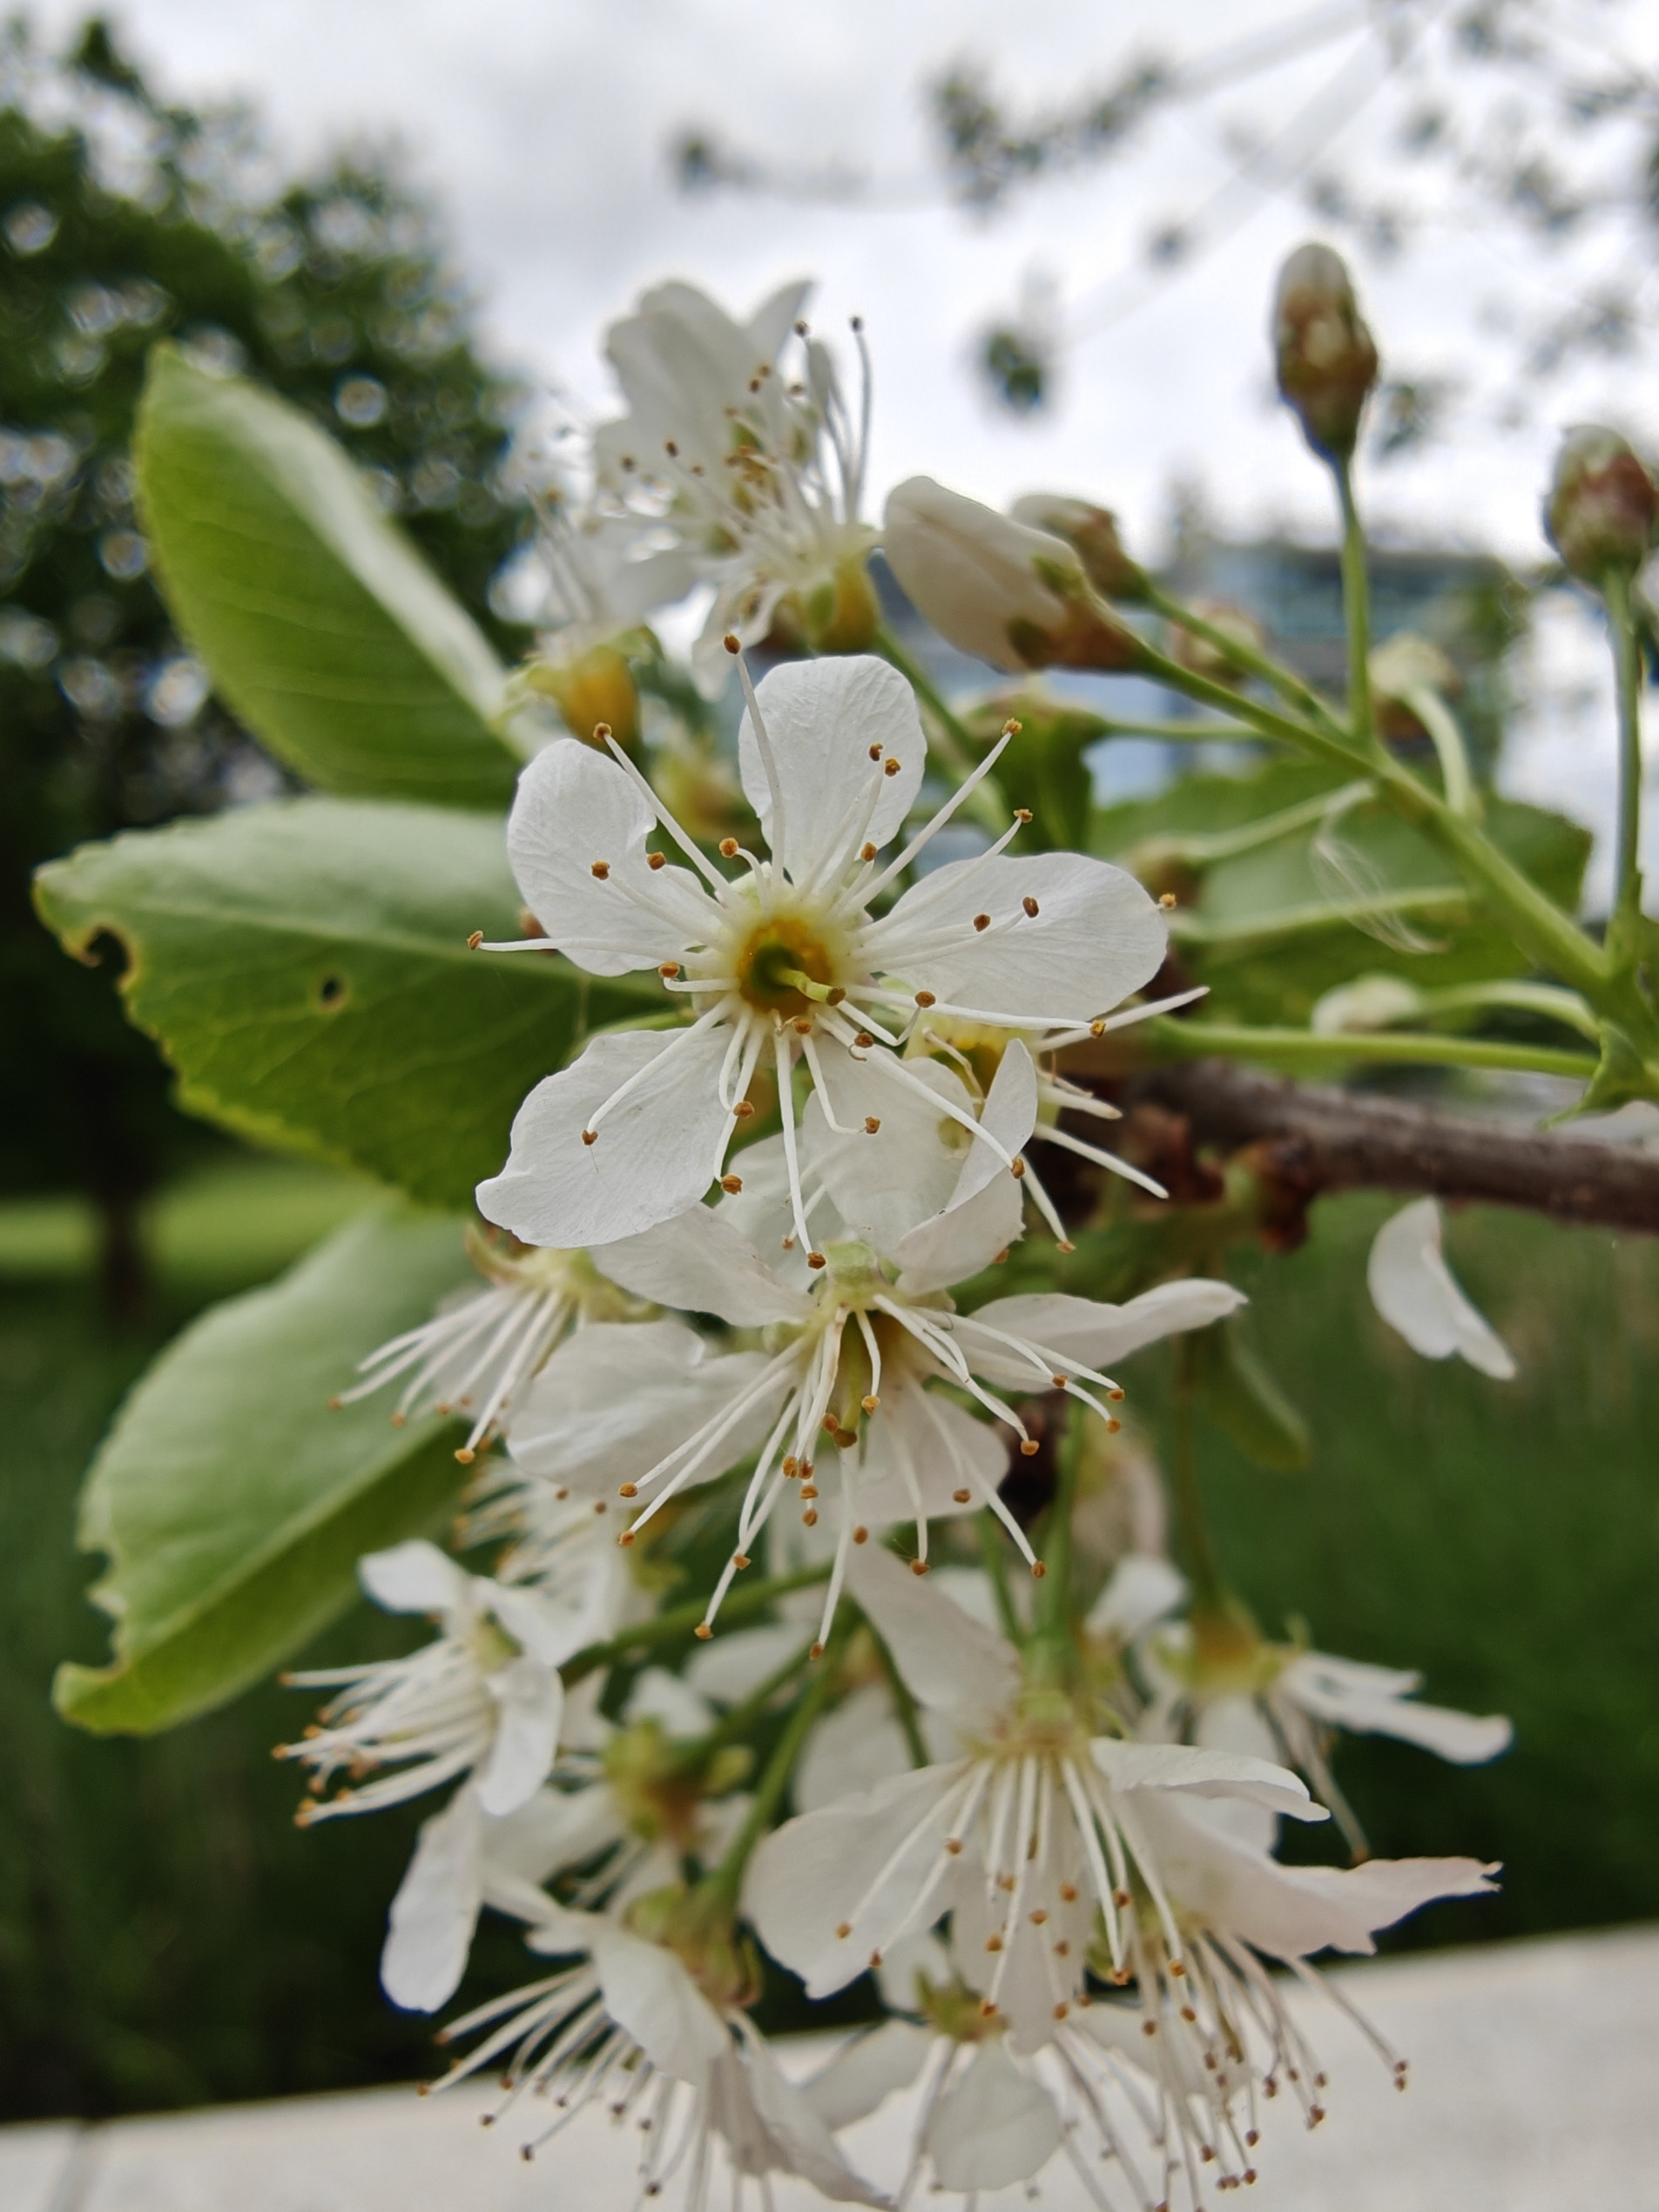
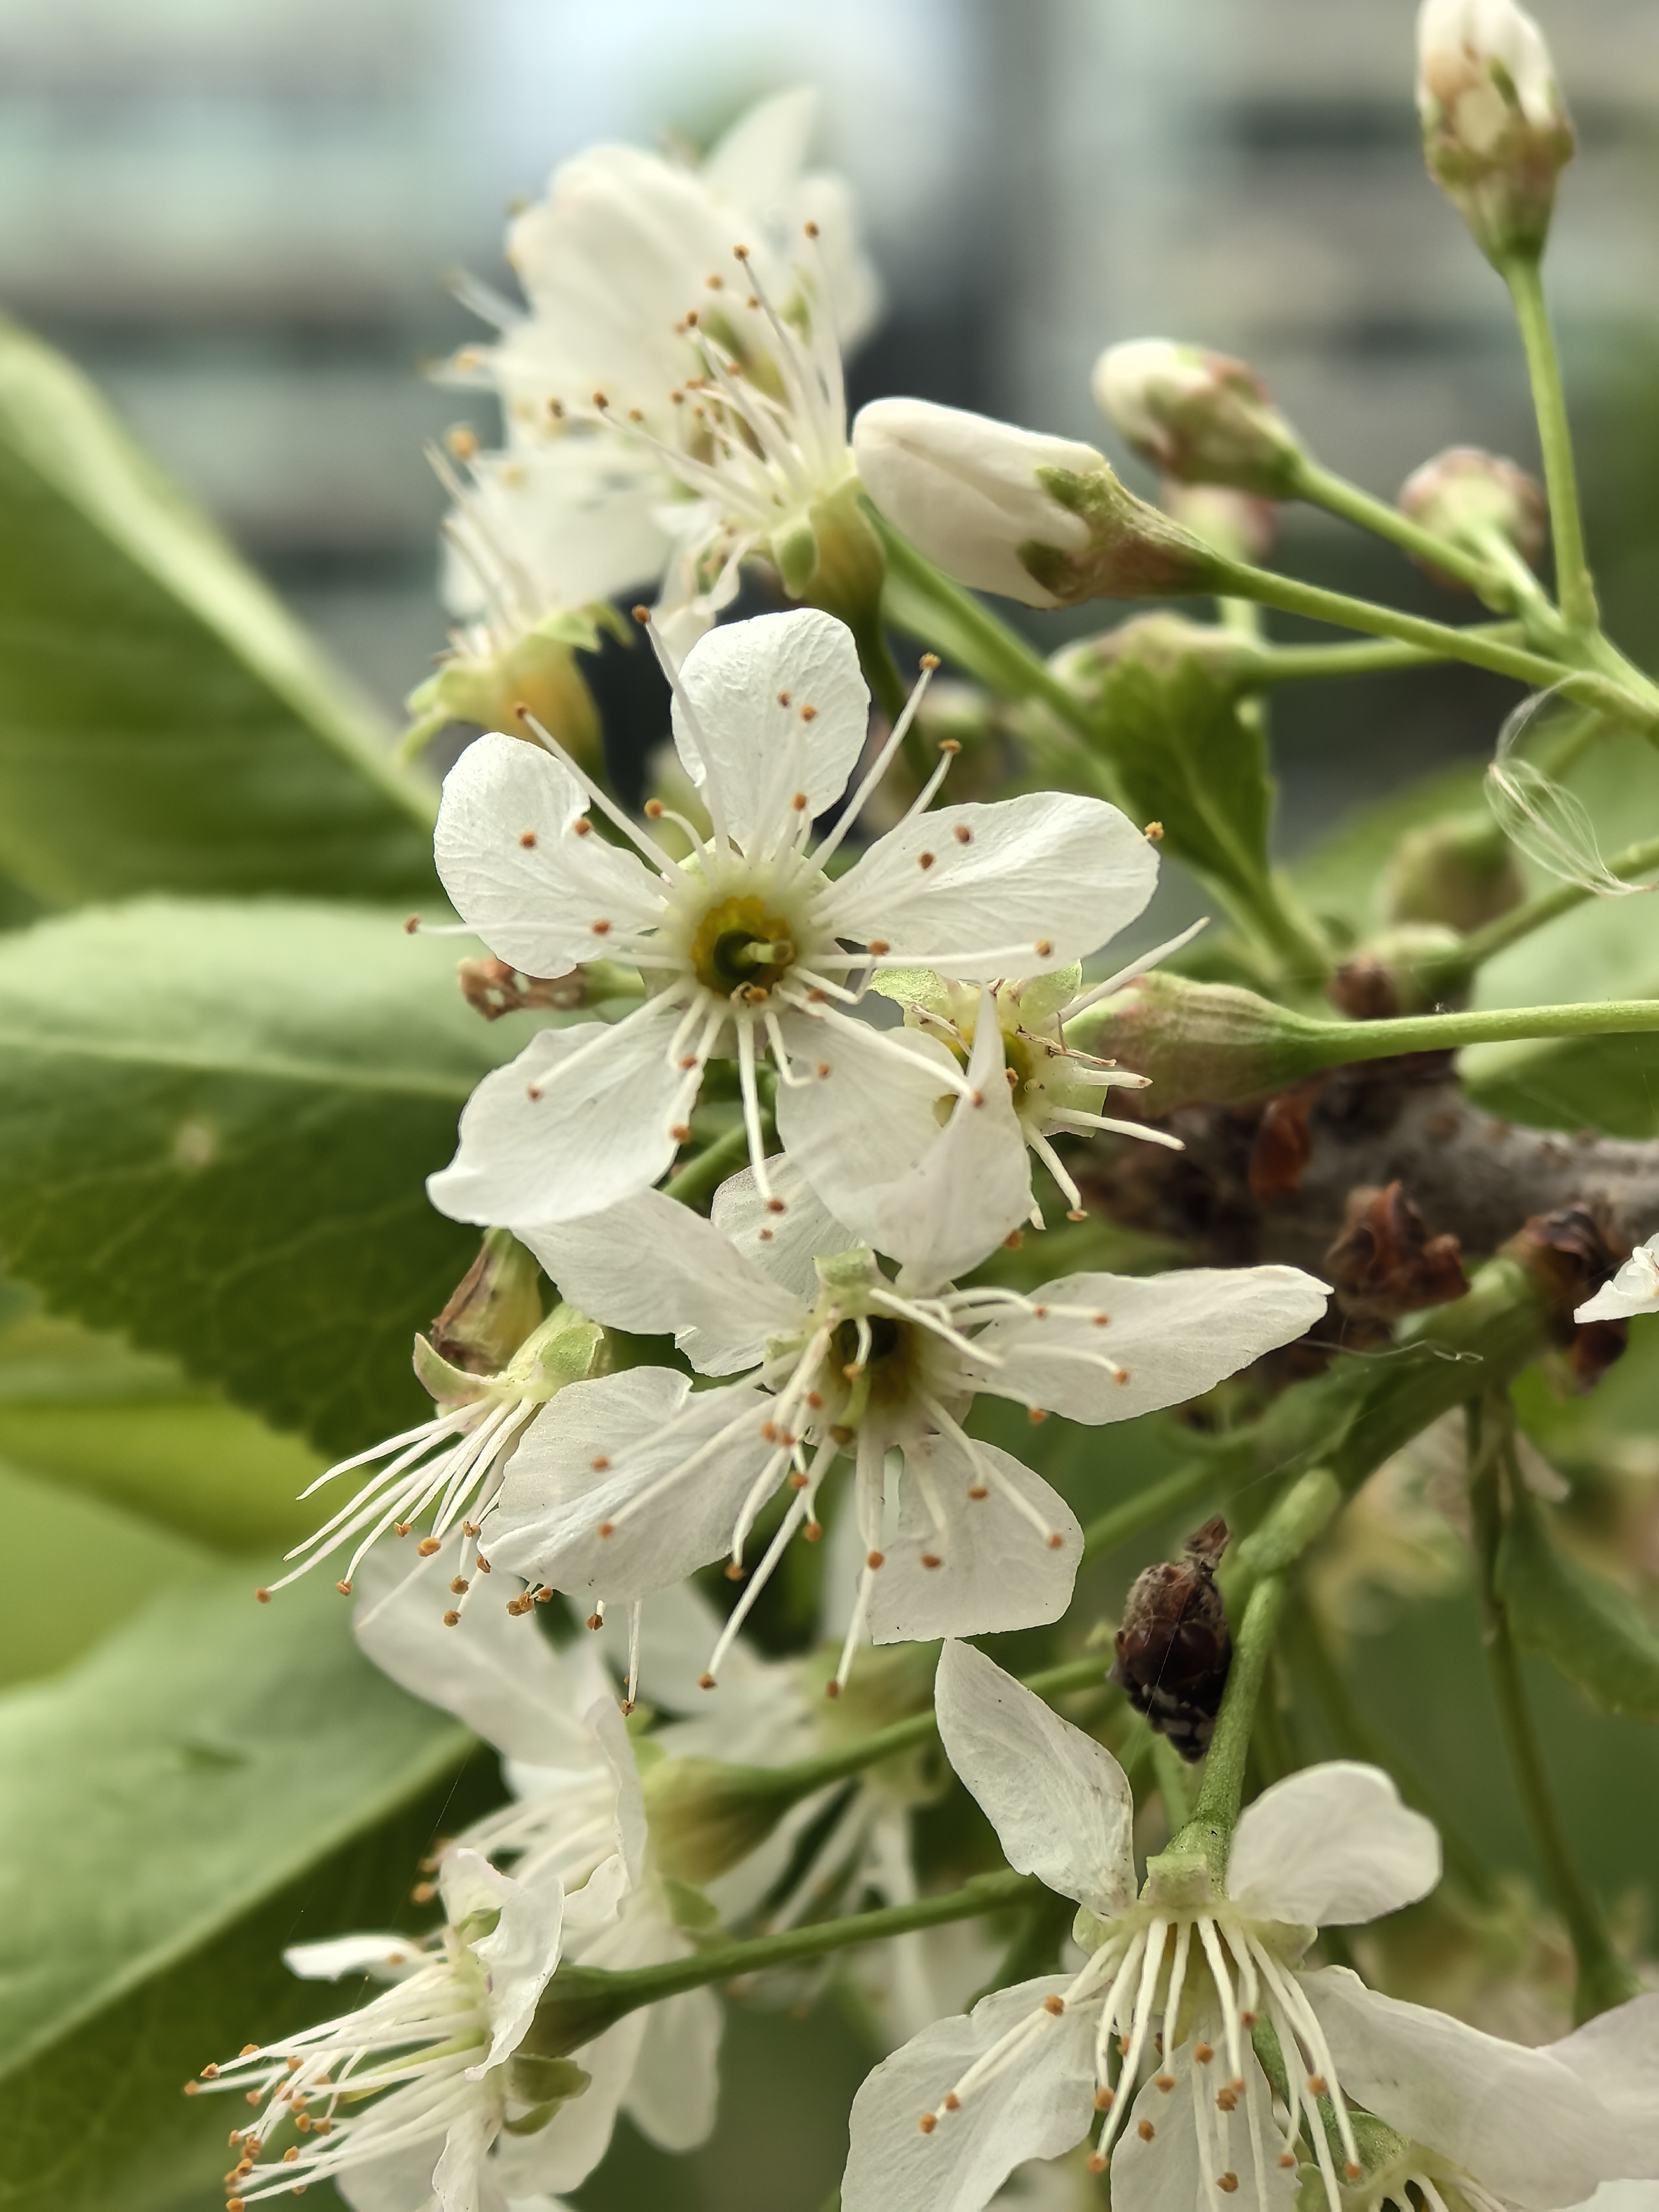
In addition, the Huawei did well when taking close-up and macro shots, thanks to the fairly wide aperture and close focus distance of the tele camera, which was used in macro mode. White balance could sometimes be slightly unstable in macro images, but other than that the pictures were detailed and pleasant, with a nice perspective compression.
Close-Up
In our tests, the Huawei Pura 70 Ultra captured very nice macro shots. The use of the 3.5x tele lens allowed for a longer shooting distance than most rivals and provided a nicely compressed perspective. Overall, macro and close-up shots were pleasant and showed good detail. Only occasionally did our testers notice a slightly unstable white balance.

Exposure
Huawei Pura 70 Ultra
134
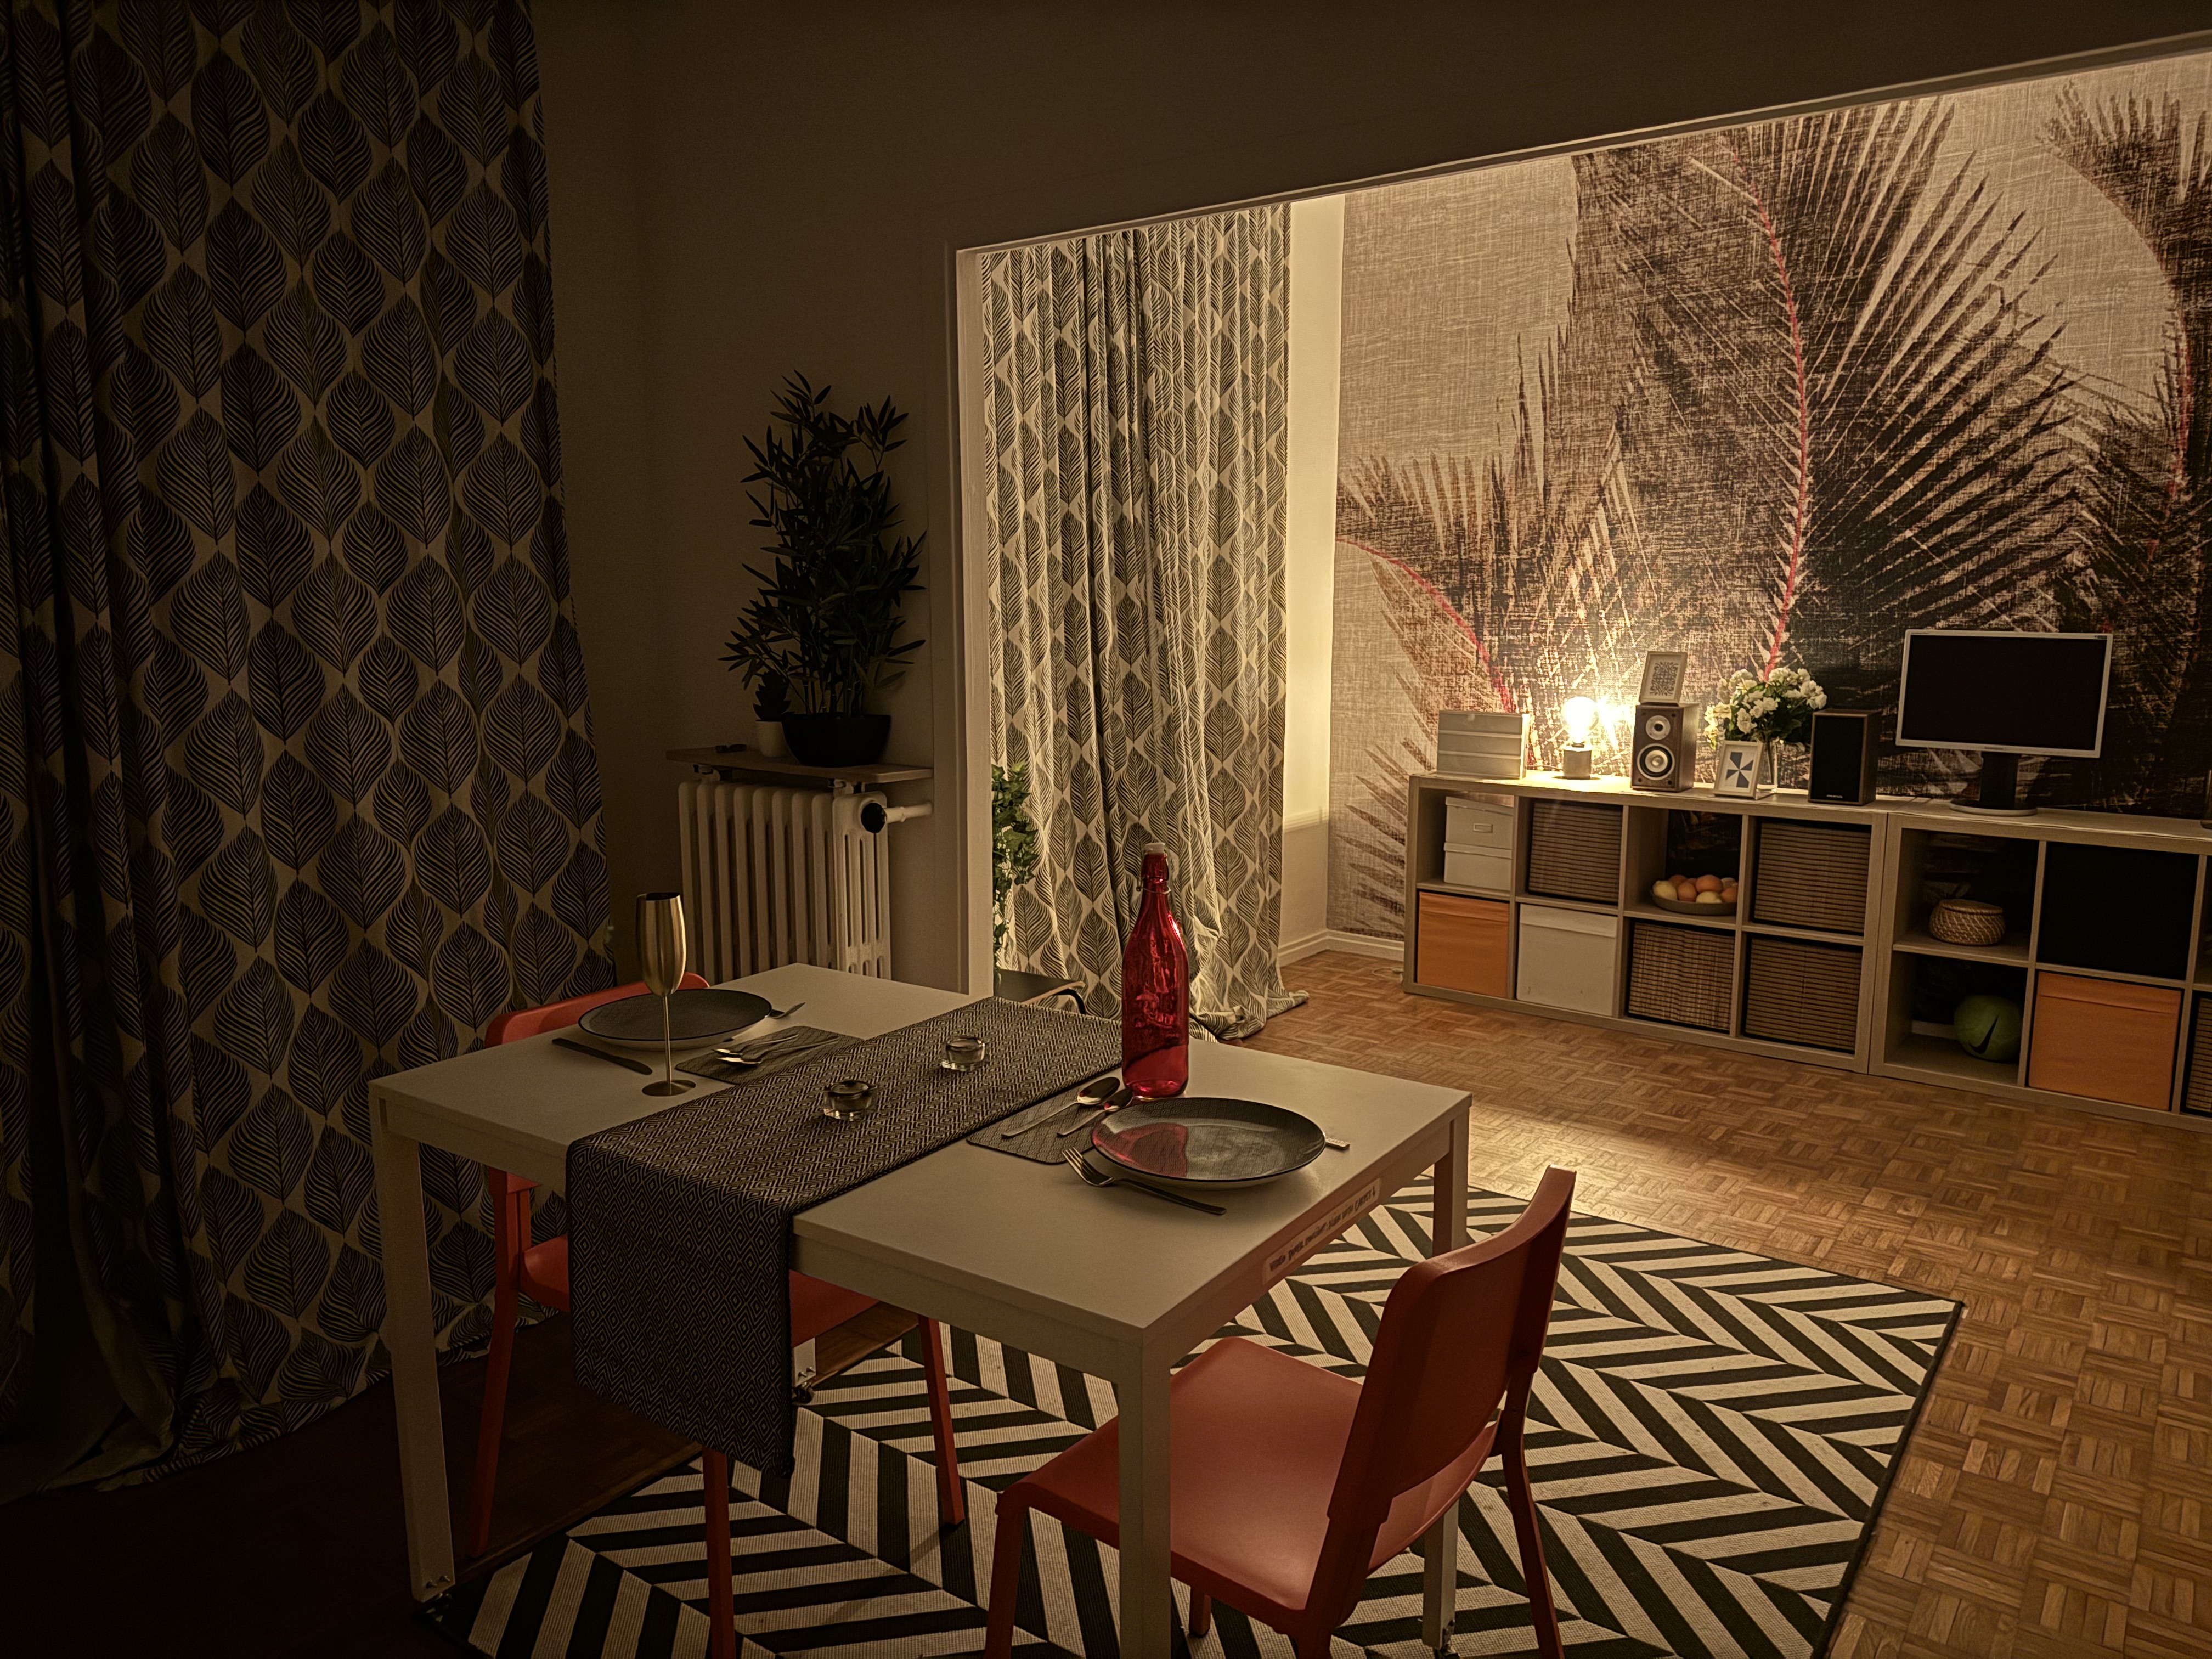
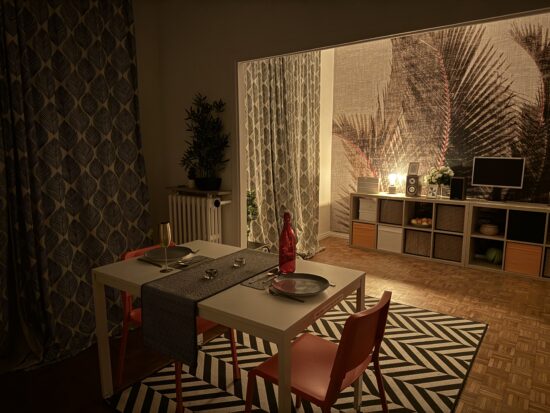
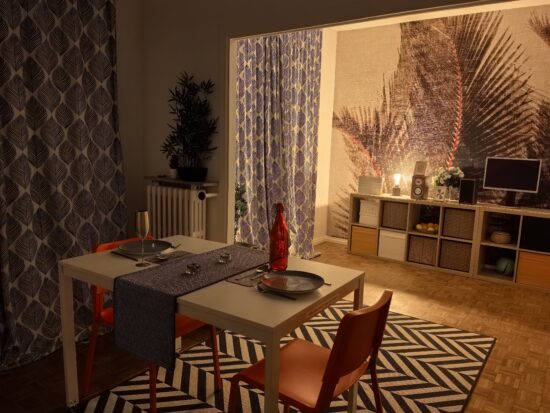
Exposure is one of the key attributes for technically good pictures. The main attribute evaluated is the brightness level of the main subject through various use cases such as landscape, portrait, or still life. Other factors evaluated are the global contrast and the ability to render the dynamic range of the scene (ability to render visible details in both bright and dark areas). When the camera provides Photo HDR format, the images are analyzed with a visualization on an HDR reference monitor, under reference conditions specified in the ISO-22028-5 standard. Repeatability is also important because it demonstrates the camera's ability to provide the same rendering when shooting several images of the same scene.
The camera managed pleasant brightness with a very wide dynamic range across all light conditions. In combination with the very good HDR format rendering, this resulted in some of the best balanced images we have seen on a smartphone. Contrast was very pleasant as well, even when shooting difficult scenes.
This said, our testers noticed some slight exposure instabilities in challenging conditions, for example, some backlit scenes. In such conditions, results could be inconsistent across a series of consecutive shots.


Color
Huawei Pura 70 Ultra
133
Color is one of the key attributes for technically good pictures. The image quality attributes analyzed are skin-tone rendering, white balance, color shading, and repeatability. For color and skin tone rendering, we penalize unnatural colors according to results gathered in various studies and consumer insights while respecting the manufacturer's choice of color signature.
Color was rendered nicely, with generally accurate white balance and only occasional color casts, resulting in the device reaching the top score in color. Skin-tone rendering was good across all types of skin tones and light conditions. The HDR format also helped improve color rendering, with nice color contrast in all scenes, but especially backlit portrait shots. On the downside, our testers observed some slight white balance instabilities in all light conditions.


Sharpness & Timing
Huawei Pura 70 Ultra
135
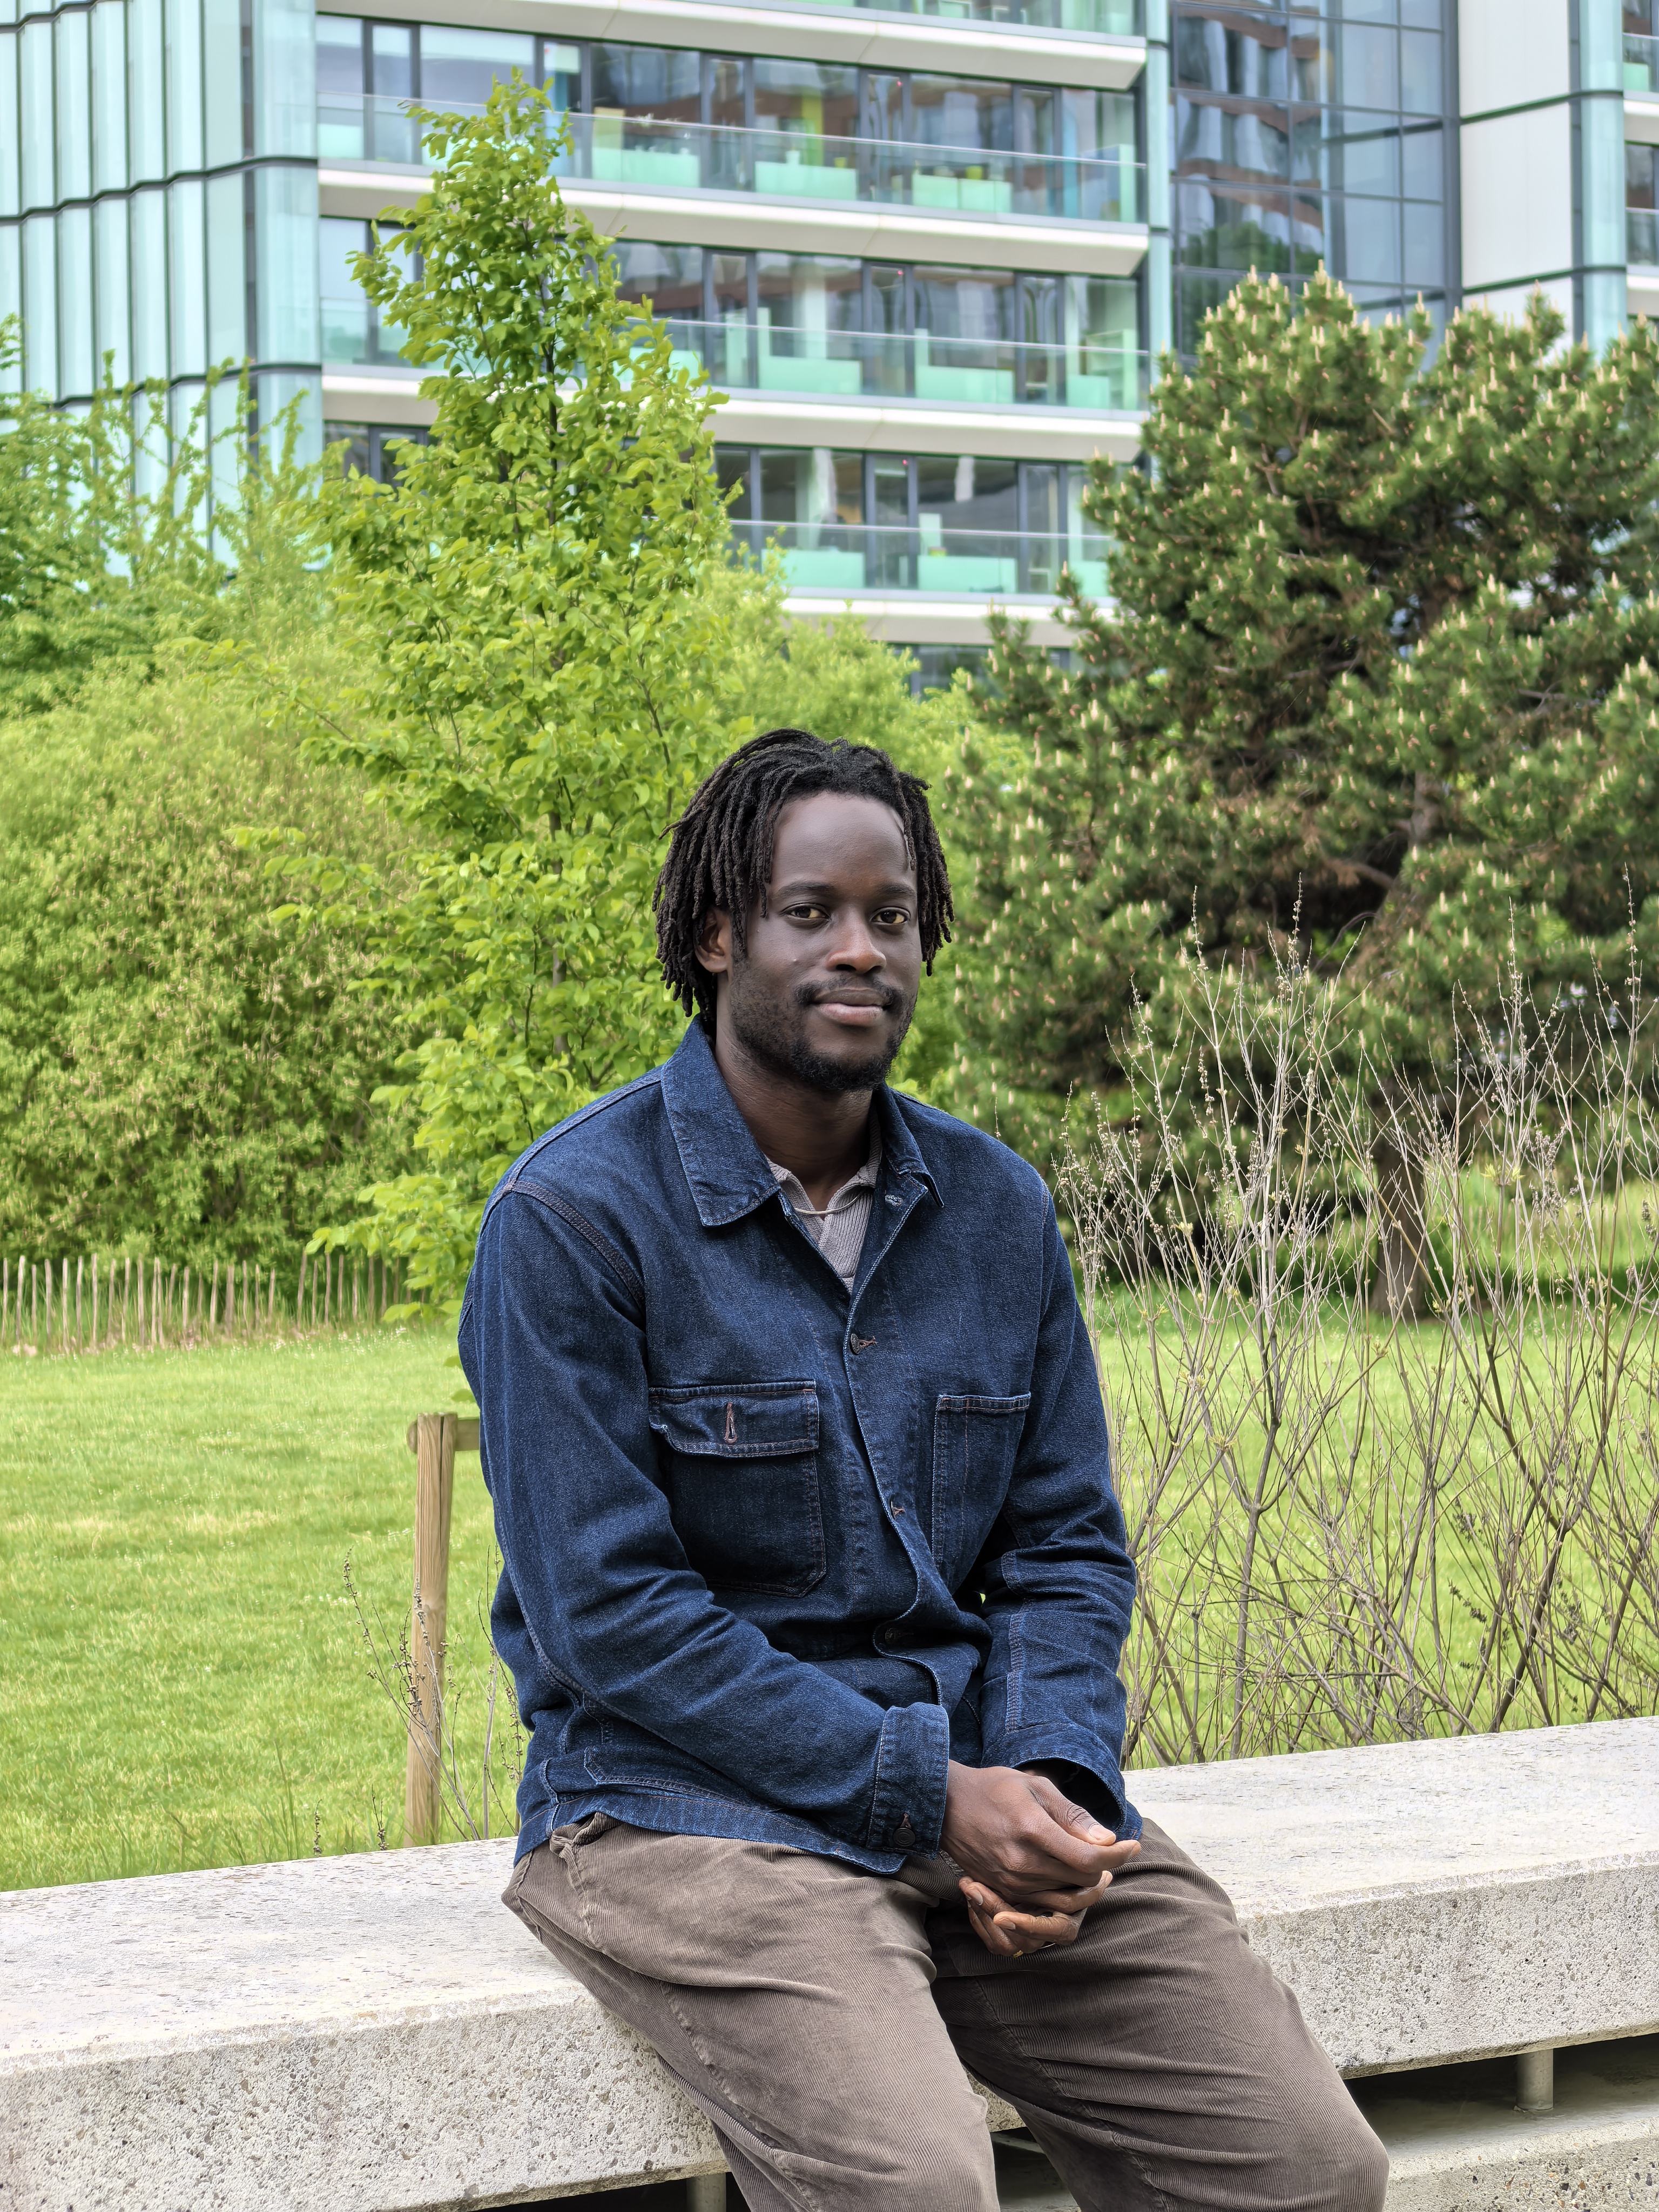
Autofocus tests concentrate on focus accuracy, focus repeatability, shooting time delay, and depth of field. Shooting delay is the difference between the time the user presses the capture button and the time the image is actually taken. It includes focusing speed and the capability of the device to capture images at the right time, what is called 'zero shutter lag' capability. Even if a shallow depth of field can be pleasant for a single subject portrait or close-up shot, it can also be a problem in some specific conditions such as group portraits; Both situations are tested. Focus accuracy is also evaluated in all the real-life images taken, from infinity to close-up objects and in low light to outdoor conditions.
In our tests, the Pura 70 Ultra autofocus was fast and accurate, allowing for sharp images and capture at the decisive moment. However, we did observe very occasional focus failures in very dim conditions on portrait scenes. The variable aperture system in combination with the large image sensor meant that the Huawei was capable of optimizing depth of field for each scene. For example, in group portraits, the Huawei produced a wider depth of field than competing devices, providing good sharpness across all subject distances. The camera was capable of picking the best aperture for all our portrait test scenes, from single subjects to larger groups.


Huawei Pura 70 Ultra 132
Texture
Texture tests analyze the level of details and the texture of subjects in the images taken in the lab as well as in real-life scenarios. For natural shots, particular attention is paid to the level of details in the bright and dark areas of the image. Objective measurements are performed on chart images taken in various lighting conditions from 0.1 to 10,000+ lux and different kinds of dynamic range conditions. The charts used are the proprietary DXOMARK chart (DMC), and the Dead Leaves chart. We also have an AI based metric for the level of details on our realistic mannequins Eugene and Diana.
In our tests, the Pura 70 Ultra captured high levels of detail and images with natural texture rendering. The excellent real-life results were confirmed by objective measurements in the lab. Texture was very fine and accurate, providing natural detail rendering on a wide range of scenes, from skin texture in portraits to distant vegetation in landscape shots. In addition, the level of captured detail remained high in low and very low light conditions. This said, our testers observed a local loss of detail in some scenes, especially in low light.


Huawei Pura 70 Ultra 129
Noise
Noise tests analyze various attributes of noise such as intensity, chromaticity, grain, structure on real-life images as well as images of charts taken in the lab. For natural images, particular attention is paid to the noise on faces, landscapes, but also on dark areas and high dynamic range conditions. Noise on moving objects is also evaluated on natural images. Objective measurements are performed on images of charts taken in various conditions from 0.1 to 10000 lux and different kinds of dynamic range conditions. The chart used is the Dead Leaves chart and the standardized measurement such as Visual Noise derived from ISO 15739.
In our tests, the Pura 70 Ultra kept image noise very well under control across all test conditions. Luminance noise was managed well, but chroma noise and color quantization could sometimes be noticeable, especially when shooting in low light.


Huawei Pura 70 Ultra 81
Artifacts
The artifacts evaluation looks at flare, lens shading, chromatic aberrations, geometrical distortion, edges ringing, halos, ghosting, quantization, unexpected color hue shifts, among others type of possible unnatural effects on photos. The more severe and the more frequent the artifact, the higher the point deduction on the score. The main artifacts observed and corresponding point loss are listed below.

Bokeh
Huawei Pura 70 Ultra
175
Bokeh is tested in one dedicated mode, usually portrait or aperture mode, and analyzed by visually inspecting all the images captured in the lab and in natural conditions. The goal is to reproduce portrait photography comparable to one taken with a DLSR and a wide aperture. The main image quality attributes paid attention to are depth estimation, artifacts, blur gradient, and the shape of the bokeh blur spotlights. Portrait image quality attributes (exposure, color, texture) are also taken into account.
When shooting in bokeh mode, the Pura 70 Ultra captured images with a generally natural blur effect, smooth blur gradient and accurate subject isolation.


Tele
Huawei Pura 70 Ultra
169
All image quality attributes are evaluated at focal lengths from approximately 40 mm to 300 mm, with particular attention paid to texture and detail. The score is derived from a number of objective measurements in the lab and perceptual analysis of real-life images.
In the telephoto category, the Huawei Pura 70 Ultra delivers excellent performance at medium zoom ranges, with good detail, natural texture rendering, and consistent color and exposure. However, at very long zoom distances, it does not perform as well as the latest flagship devices from Xiaomi and Oppo, such as the Xiaomi 15 Ultra and Oppo Find X8 Ultra. In those extreme ranges, Huawei’s images tend to show softer details and reduced contrast, along with slightly more visible noise, especially in low-light scenes. While still highly capable overall, the Pura 70 Ultra’s telephoto module falls just short of the class-leading long-range zoom quality offered by its top competitors.

Huawei Pura 70 Ultra 169
UltraWide
These tests analyze the performance of the ultra-wide camera at several focal lengths from 12 mm to 20 mm. All image quality attributes are evaluated, with particular attention paid to such artifacts as chromatic aberrations, lens softness, and distortion. Pictures below are an extract of tested scenes.
The performance in ultra-wide was almost the best we have tested so far at DXOMARK, with an excellent level of detail and very well-managed noise levels in the whole field of the 13mm ultra-wide module. Dynamic range was wide, and exposure and white balance were accurate. The color rendering was pleasant in most conditions.
Huawei Pura 70 Ultra 172Video
DXOMARK engineers capture and evaluate almost 3 hours of video in controlled lab environments and in natural low-light, indoor and outdoor scenes, using the camera’s default settings. The evaluation consists of visually inspecting natural videos taken in various conditions and running objective measurements on videos of charts recorded in the lab under different conditions from 0.1 to 10000+ lux and color temperatures from 2,300K to 6,500K.
Main
Huawei Pura 70 Ultra
186
In our video tests, the Pura 70 Ultra’s autofocus performance was excellent, with quick reactions and smooth transitions. Exposure and colors were accurate in most conditions, but our experts noticed some slight instabilities in low light. Color rendering in bright light was improved over the Mate 60 Pro+, with higher levels of saturation. However, colors still could not quite match the vibrance of the Apple iPhone 15 Pro Max.
Levels of captured detail were fairly high, and noise was well under control in bright light and when shooting indoors. However, some noise could be noticeable in low light, especially on moving elements in the scene. It is even more true with the latest version tested that showed some significant regression regarding noise management. Video stabilization was effective, with very few sharpness differences between video frames across all light conditions. Camera shake was only slightly noticeable in the recorded footage.
Exposure
Huawei Pura 70 Ultra
127
Exposure tests evaluate the brightness level of the main subject, the global contrast and the ability to render the dynamic range of the scene (ability to render visible details in both bright and dark areas). When the camera provides Video HDR format, the videos are analyzed with a visualization on an HDR reference monitor, under reference conditions specified in the metadata. Stability and temporal adaption of the exposure are also analyzed.
In video mode, target exposure was generally accurate and dynamic range was fairly wide, providing good highlight preservation in high-contrast scenes across all light levels.
Color
Huawei Pura 70 Ultra
131
Image-quality color analysis looks at color rendering, skin-tone rendering, white balance, color shading, stability of the white balance and its adaption when light is changing.
White balance was accurate in most test conditions, but some slight adaptation issues could sometimes be noticeable in very challenging scenes.
Sharpness & Timing
Huawei Pura 70 Ultra
124
For video, autofocus tests concentrate on focus accuracy, focus stability and analysis of convergence regarding speed and smoothness.
The autofocus performed particularly well in video mode, with smooth and accurate focusing, even in difficult scenes.
Texture
Huawei Pura 70 Ultra
118
Texture tests analyze the level of details and texture of the real-life videos as well as the videos of charts recorded in the lab. Natural videos recordings are visually evaluated, with particular attention paid to the level of details in the bright and areas as well as in the dark. Objective measurements are performed of images of charts taken in various conditions from 0.1 to 10000 lux. The charts used are the DXOMARK chart (DMC) and Dead Leaves chart.
Video texture measurements in the lab were high across all test conditions. This was confirmed by our results in real-life recording, with good texture across all types of subjects, including faces. However, our testers noticed some moving texture artifacts, especially when shooting video in low light.
Noise
Huawei Pura 70 Ultra
129
Noise tests analyze various attributes of noise such as intensity, chromaticity, grain, structure, temporal aspects on real-life video recording as well as videos of charts taken in the lab. Natural videos are visually evaluated, with particular attention paid to the noise in the dark areas and high dynamic range conditions. Objective measurements are performed on the videos of charts recorded in various conditions from 0.1 to 10000 lux. The chart used is the DXOMARK visual noise chart.
Video noise was generally well under control in static scenes, including our lab tests. Some noise is visible in low light, especially on moving elements in the scene. And the quality of the video in dim conditions are significantly impacted by this regression that was overserved on latest version tested.

Stabilization
Huawei Pura 70 Ultra
124
Stabilization evaluation tests the ability of the device to stabilize footage thanks to software or hardware technologies such as OIS, EIS, or any others means. The evaluation looks at residual motion, smoothness, jello artifacts and residual motion blur on walk and run use cases in various lighting conditions. The video below is an extract from one of the tested scenes.
Video stabilization did a very good job at compensating for camera motion, but it could not quite match the best-in-class devices. Artifacts, such as the jello effect or sharpness differences between frames were well under control.
Artifacts
Huawei Pura 70 Ultra
89
Artifacts are evaluated with MTF and ringing measurements on the SFR chart in the lab as well as frame-rate measurements using the LED Universal Timer. Natural videos are visually evaluated by paying particular attention to artifacts such as aliasing, quantization, blocking, and hue shift, among others. The more severe and the more frequent the artifact, the higher the point deduction from the score. The main artifacts and corresponding point loss are listed below.
UltraWide
Huawei Pura 70 Ultra
148
All image quality attributes are evaluated at focal lengths from approximately 12 mm to 30 mm, with particular attention paid to texture and smoothness of the zooming effect. The score is derived from a number of objective measurements in the lab and perceptual analysis of real-life video recordings.
Tele
Huawei Pura 70 Ultra
140
All image quality attributes are evaluated at focal lengths from approximately 50 mm to 300 mm, with particular attention paid to texture and smoothness of the zooming effect. The score is derived from a number of objective measurements in the lab and perceptual analysis of real-life video recordings.
The Huawei Pura 70 Ultra provided a very good level of detail in video zoom, even though occasionally, some camera jumps as well as exposure and color variations were visible while zooming. The Apple iPhone 16 Pro Max still offers a smoother user experience for video zoom.
Overall the smartphone delivers strong video zoom performance, particularly excelling at medium telephoto ranges thanks to its 3.5× periscope telephoto lens. The camera produces sharp, detailed footage with consistent color accuracy and exposure, ensuring natural-looking distant subjects. Autofocus is fast and dependable even in dim lighting, and effective stabilization keeps handheld shots smooth across zoom levels. However, at longer zoom distances, you may notice slight softness and increased noise, especially under challenging lighting conditions, an area where flagship rivals like Oppo and Xiaomi tend to perform better. Overall, the Pura 70 Ultra offers versatile and high-quality video zoom, with real-world performance that’s impressive, though not quite on par with the very top long-range video zoom phones.