We put the Lenovo ThinkPad T14 Gen4 through our rigorous DXOMARK Laptop test suite to measure its performance in sound, camera, and display. In this review, we will break down how it fared in a variety of tests and several common use cases.
Overview
Key specifications include (as given by the manufacturer):
- Physical specs: 1.79 x 22.7x 31.8 cm, 1.32 kg
- Display: 14-inch, IPS OLED Up to 14″ WUXGA (1920 x 1200), IPS, anti-glare, touchscreen
- Audio:2 speakers, 2 microphones
- Webcam: 1080p; 5 MP RGB+IR
Scoring
Use-case and feature subscores included in the calculations of the global score
 Lenovo ThinkPad T14 Gen 4

90
camera
66
Apple MacBook Pro 14" (M3 Pro, 2023)
Best: Apple MacBook Pro 14" (M3 Pro, 2023) (93)
44
Lenovo ThinkPad X9 Aura
Best: Lenovo ThinkPad X9 Aura (56)
50
Microsoft Surface Laptop 13-inch
Best: Microsoft Surface Laptop 13-inch (79)
68
Apple MacBook Pro 14" (M2 Pro, 2023)
Best: Apple MacBook Pro 14" (M2 Pro, 2023) (83)
140
display
78
Apple MacBook Pro 14" (M3 Pro, 2023)
Best: Apple MacBook Pro 14" (M3 Pro, 2023) (84)
66
Apple MacBook Pro 14" (M3 Pro, 2023)
Best: Apple MacBook Pro 14" (M3 Pro, 2023) (95)
76
Honor MagicBook View 14 (2022)
Best: Honor MagicBook View 14 (2022) (84)
115
audio
113
Apple MacBook Pro 14" (M2 Pro, 2023)
Best: Apple MacBook Pro 14" (M2 Pro, 2023) (149)
122
Acer Swift Go 14
Best: Acer Swift Go 14 (133)
135
Asus Zenbook 14X OLED (2023)
Best: Asus Zenbook 14X OLED (2023) (153)
Pros
- Camera has generally accurate target exposure
- Well-managed, undisturbing display reflections during video calls
- Pleasant sound signature in audio-capture and voice intelligibility
- In Music & Video, display shows good brightness range, with maximum brightness that is higher-than-advertised on HDR content (600 nits vs 500 advertised)
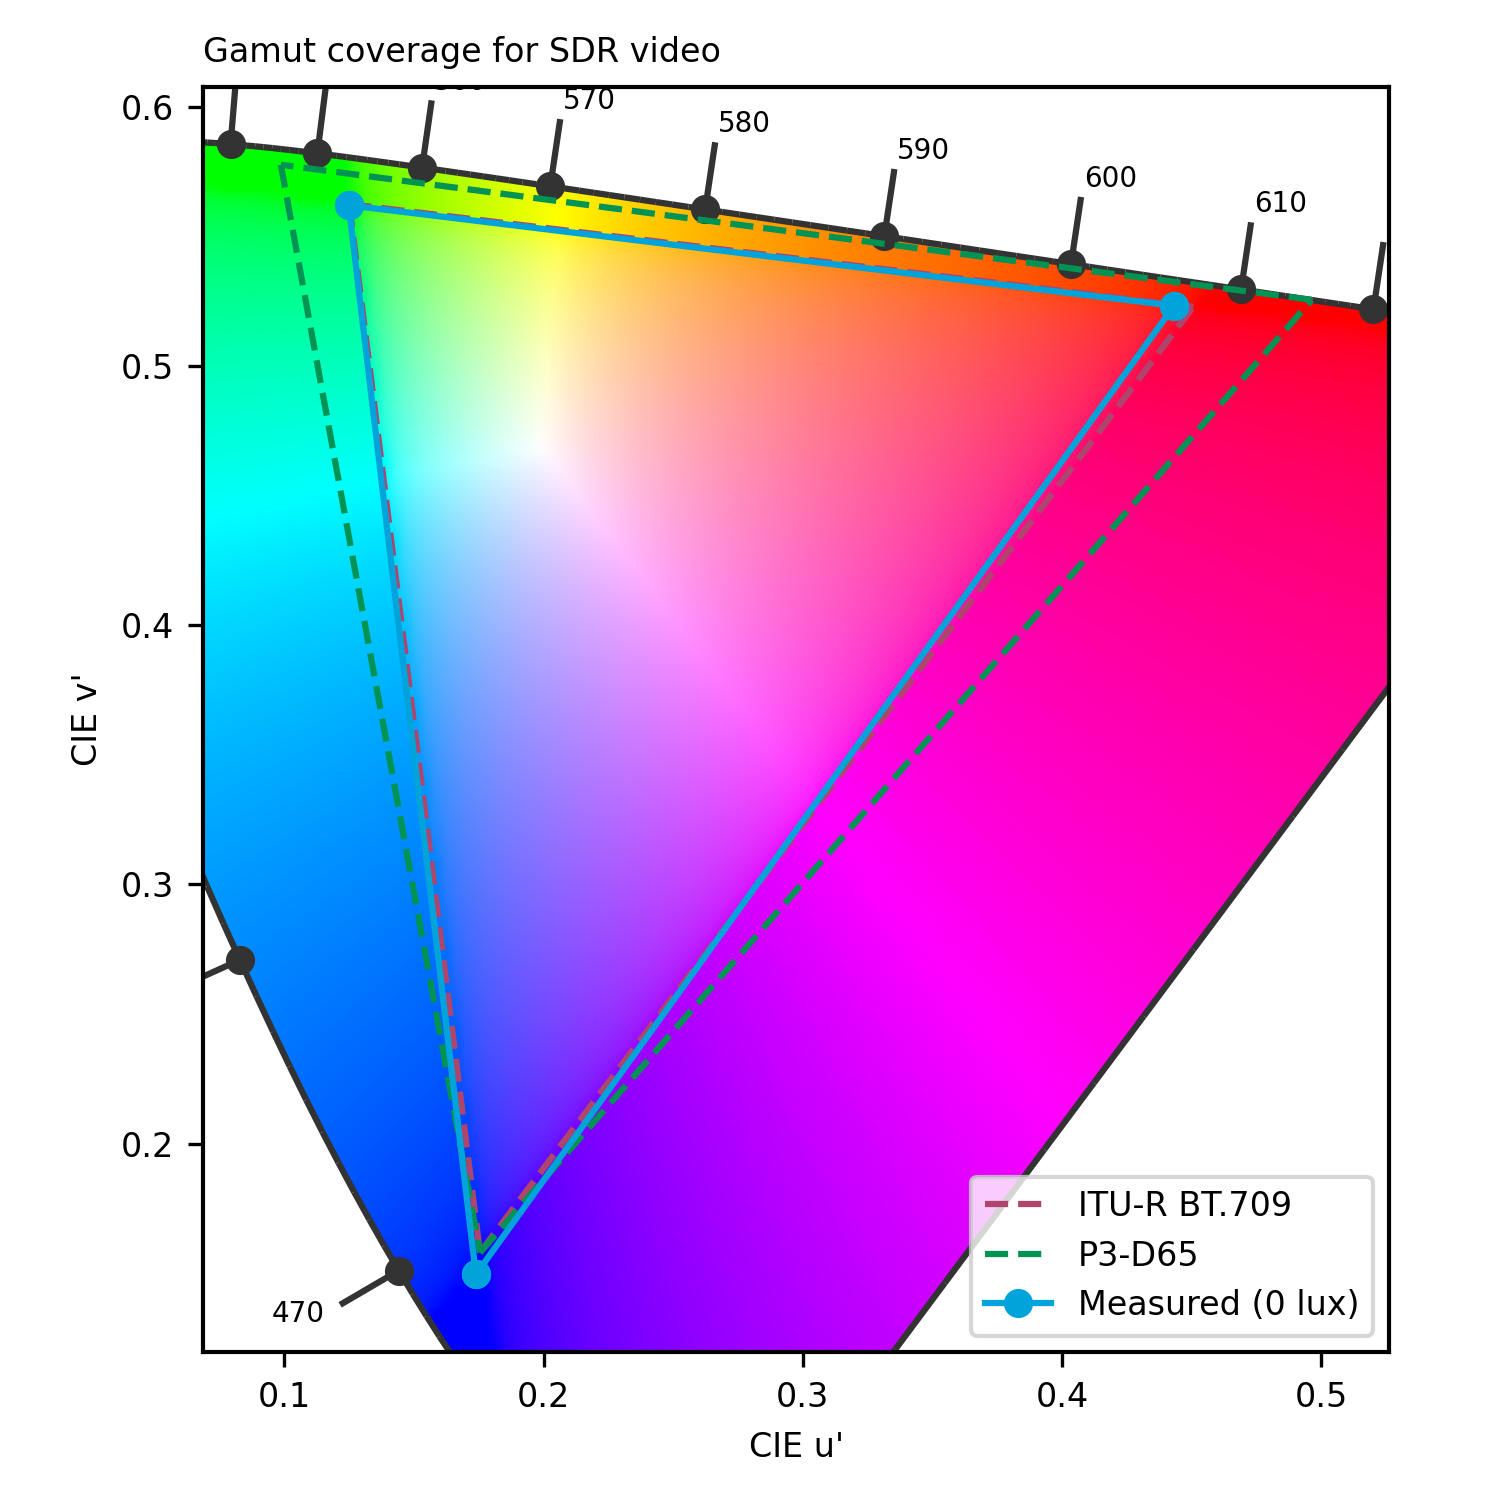
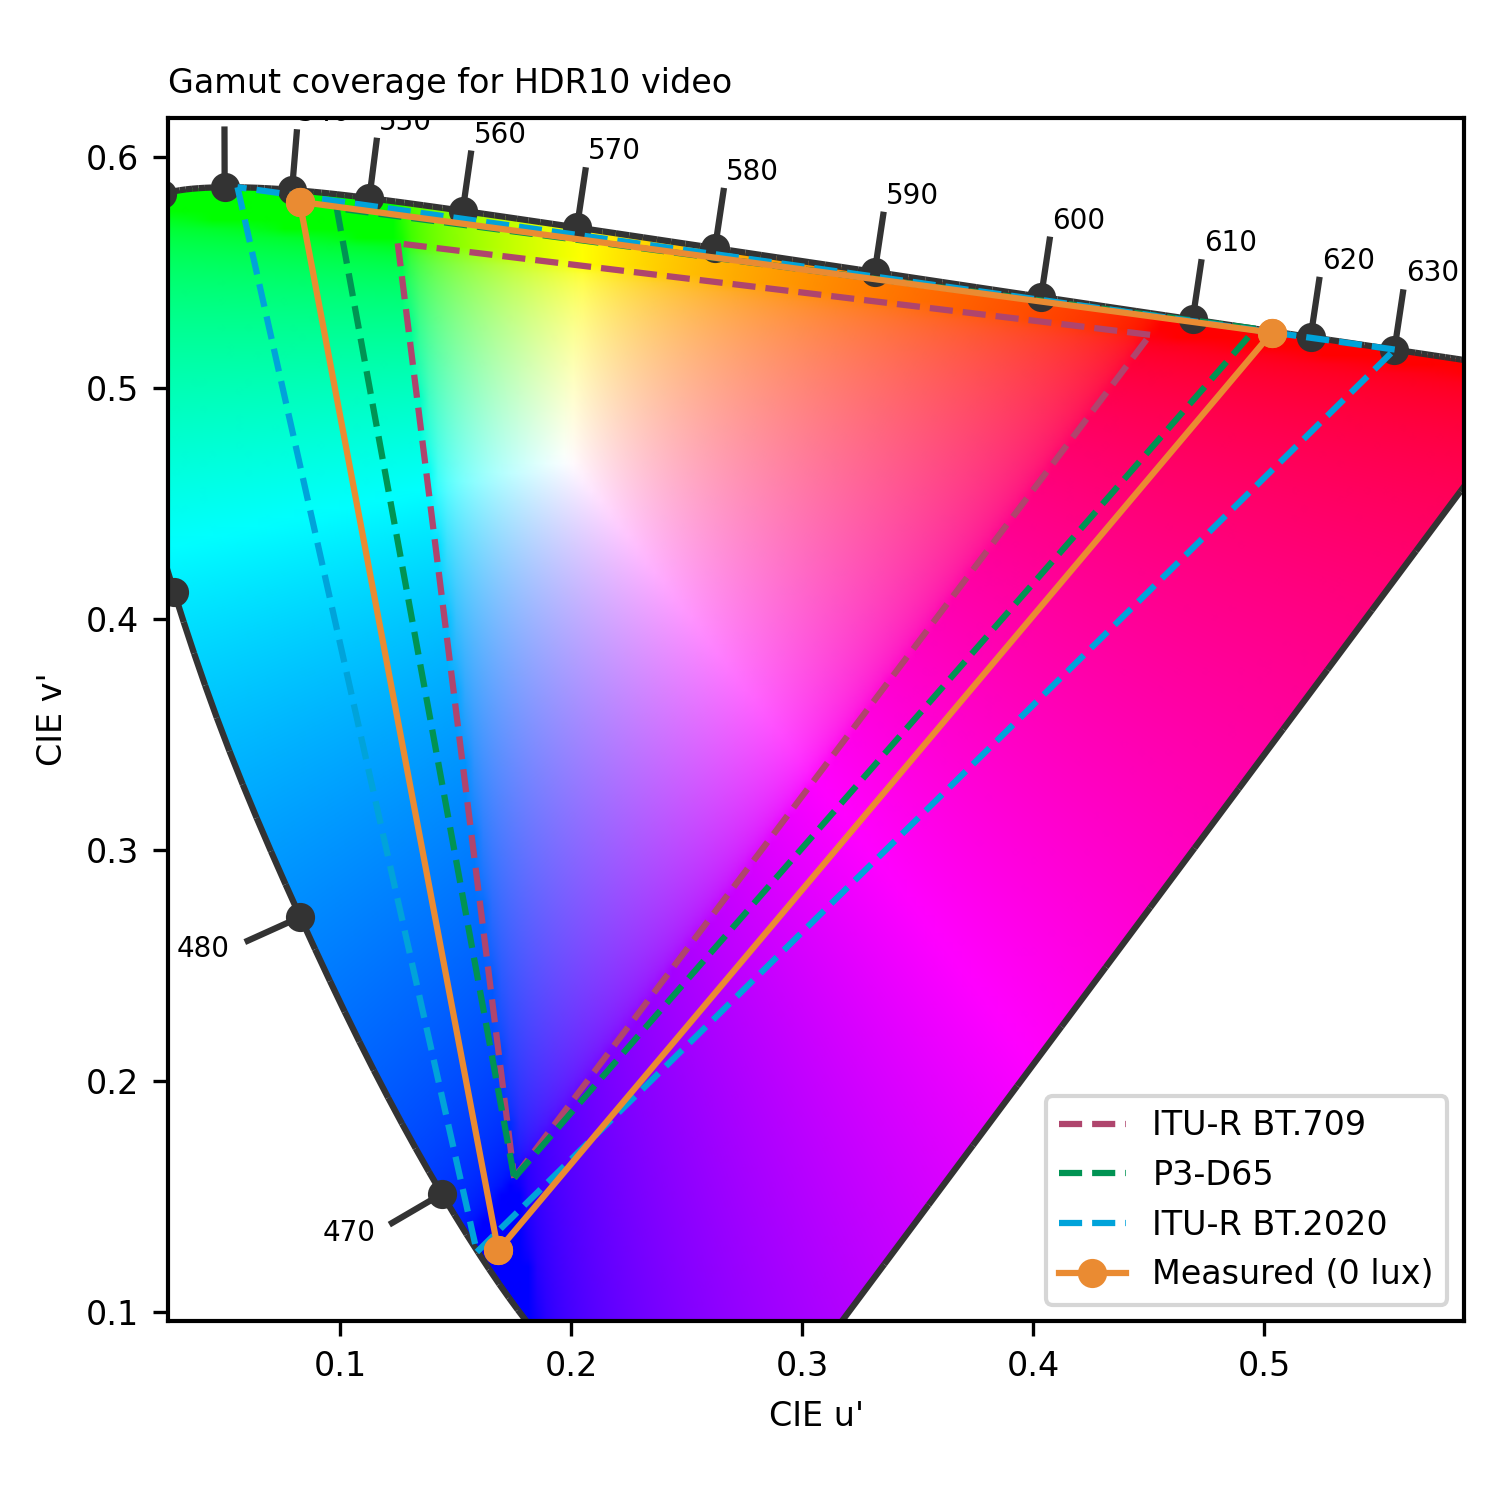
- Good display color performance in both SDR and HDR
Cons
- In Video Call, strong exposure instabilities sometimes visible in high dynamic scenes, and limited dynamic range
- Limited management of audio in duplex situations
- In music and video, EOTF in HDR has similar highlight clipping as seen on other windows laptops, and black level is limited by panel technology
- Unpleasant sound signature for Music & Video
The T14 provided a good and homogeneous display experience, ensuring good readability and faithful rendering of both SDR and HDR content. Its built-in microphones offered a very satisfying experience, delivering pleasant timbre and good intelligibility (although its handling of duplex calls was not optimal). On the downside, the playback experience was unsatisfactory due to poor timbre from the built-in speakers. The laptop’s camera performance was adequate, but can be limited in difficult lighting conditions.
Test summary
About DXOMARK Laptop tests: For scoring and analysis in our laptop reviews, DXOMARK engineers perform a variety of objective tests and undertake more than 20 hours of perceptual evaluations under controlled lab conditions and real-life scenarios.
(For more details about the Laptop protocol, click here.)
The following section gathers key elements of our exhaustive tests and analyses performed in DXOMARK laboratories. Detailed performance evaluations under the form of reports are available upon request. Do not hesitate to contact us.
Lenovo ThinkPad T14 Gen4 overall & use-cases scores
Video Call
123
Lenovo ThinkPad T14 Gen 4
144
Apple MacBook Pro 14" (M2 Pro, 2023)
Apple MacBook Pro 14" (M2 Pro, 2023)
About DXOMARK Laptop tests
DXOMARK's Video call use case is a score that evaluates how a device handles video calls and videoconferencing in multiple conditions. This score focuses on the camera performance and the capture and playback rendering of voices. Read more about how we test the use cases of Video call score here.
During video calls, the camera’s target exposure was generally accurate, but strong exposure instabilities were sometimes visible in high dynamic scenes. Dynamic range was limited, and color rendering was sometimes inaccurate. The built-in microphones provided a pleasant sound signature and great voice intelligibility, but two people speaking at the same time may not be able to hear each other.
Camera
90
Lenovo ThinkPad T14 Gen 4
135
Apple MacBook Pro 14" (M3 Pro, 2023)
Apple MacBook Pro 14" (M3 Pro, 2023)
Camera texture acutance on Deadleaves with illuminance levels
This graph shows the evolution of texture acutance with the level of lux measured on a Deadleaves chart.
The following graphs show the objective measurements performed in our camera labs:
Camera visual noise evolution with illuminance levels
This graph shows the evolution of spatial visual noise with the level of lux. Spatial visual noise is measured on the visual noise chart in the video noise setup. DXOMARK visual noise measurement is derived from ISO15739 standard.
Target exposure on face with illuminance levels
These measurements take place on a setup combining realistic mannequins and a backlit panel simulating high dynamic range conditions. This graph shows the evolution of lightness measured on the forehead of the realistic mannequin with the level of lux, for multiple lighting conditions. The lightness is measured in L*. Delta EV specifies the difference of luminance in stops between the face and the light panel simulating HDR conditions.
Target exposure on face with illuminance levels in HDR conditions
These measurements take place on a setup combining realistic mannequins and a backlit panel simulating high dynamic range conditions. This graph shows the evolution of lightness measured on the forehead of the realistic mannequin with the level of lux, for multiple lighting conditions. The lightness is measured in L*. Delta EV specifies the difference of luminance in stops between the face and the light panel simulating HDR conditions.
Audio
122
Lenovo ThinkPad T14 Gen 4
144
Apple MacBook Pro 14" (M2 Pro, 2023)
Apple MacBook Pro 14" (M2 Pro, 2023)
Audio capture scores comparison
The following graphs show the frequency response, distortion and directivity in capture, recorded in our semi-anechoic room:
Audio capture frequency response
A 1/12 octave frequency response graph, which measures the volume of each frequency captured by the laptop when recording an objective test signal at 1 meter in an anechoic environment.
Audio capture Total Harmonic Distortion + Noise
This graph shows the Total Harmonic Distortion and Noise over the hearable frequency range. It represents the distortion and noise of the device capturing our test signal.
Audio capture directivity
Directivity graph of the laptop microphone(s) when capturing test signals using the camera app. It represents the acoustic energy (in dB) over the angle of incidence of the sound source (normalized to the angle 0°, in front of the device).
About DXOMARK Laptop tests
DXOMARK's Music and Video use-case score evaluates the capability of a device to reproduce multimedia usages such as videos, movies and music playback in indoor conditions. This score focuses on the display performance and audio-playback rendering. Read more about how we test this use case here.
The T14 Gen’s display has a higher-than-average brightness range (600 nits vs 500 advertised) and provided a wide HDR color gamut. It had good color performance in SDR, even though blues were slightly desaturated. It handled reflections well. The darkness of blacks (especially for SDR content) was limited by the panel technology; and as with other tested Windows laptops, highlights in HDR content were clipped and disturbing at high display brightness. The built-in speakers have a limited frequency range, and their sound signature was unpleasant.
The following chart presents the display subscores for the multimedia use case:
Display scores comparison
The following graphs show the objective measurements performed in our display lab:
Display gamut coverage for video contents
The primary colors are measured both in HDR10 and SDR. The extracted color gamut shows the extent of the color area that the device can render. To respect the artistic intent, the measured gamut should match the master color space of each video.
Display reflectance measurement (SCI)
Measurements above show the reflection of the device within the visible spectrum range (400 nm to 700 nm). It includes both diffuse and specular reflection.
Display reflectance profile
Display brightness uniformity
0.15
cd/m²
0.108
cd/m²
0.117
cd/m²
0.176
cd/m²
0.13
cd/m²
0.139
cd/m²
0.201
cd/m²
0.157
cd/m²
0.17
cd/m²
 Distribution of brightness (min)
423.9
cd/m²
423.7
cd/m²
426.6
cd/m²
408.1
cd/m²
411
cd/m²
416.7
cd/m²
405.4
cd/m²
407.3
cd/m²
414.4
cd/m²
Distribution of brightness (max)
This illustration shows the brightness measured on nine zones of the display for minimum brightness (left) and maximum brightness (right) for SDR content.
Display SDR EOTF measurement
This graph represents the rendering of contrast (gray levels) for SDR video content, measured in the dark. We expect to be close to the 2.2 or 2.4 gamma references.
Display peak brightness for video contents
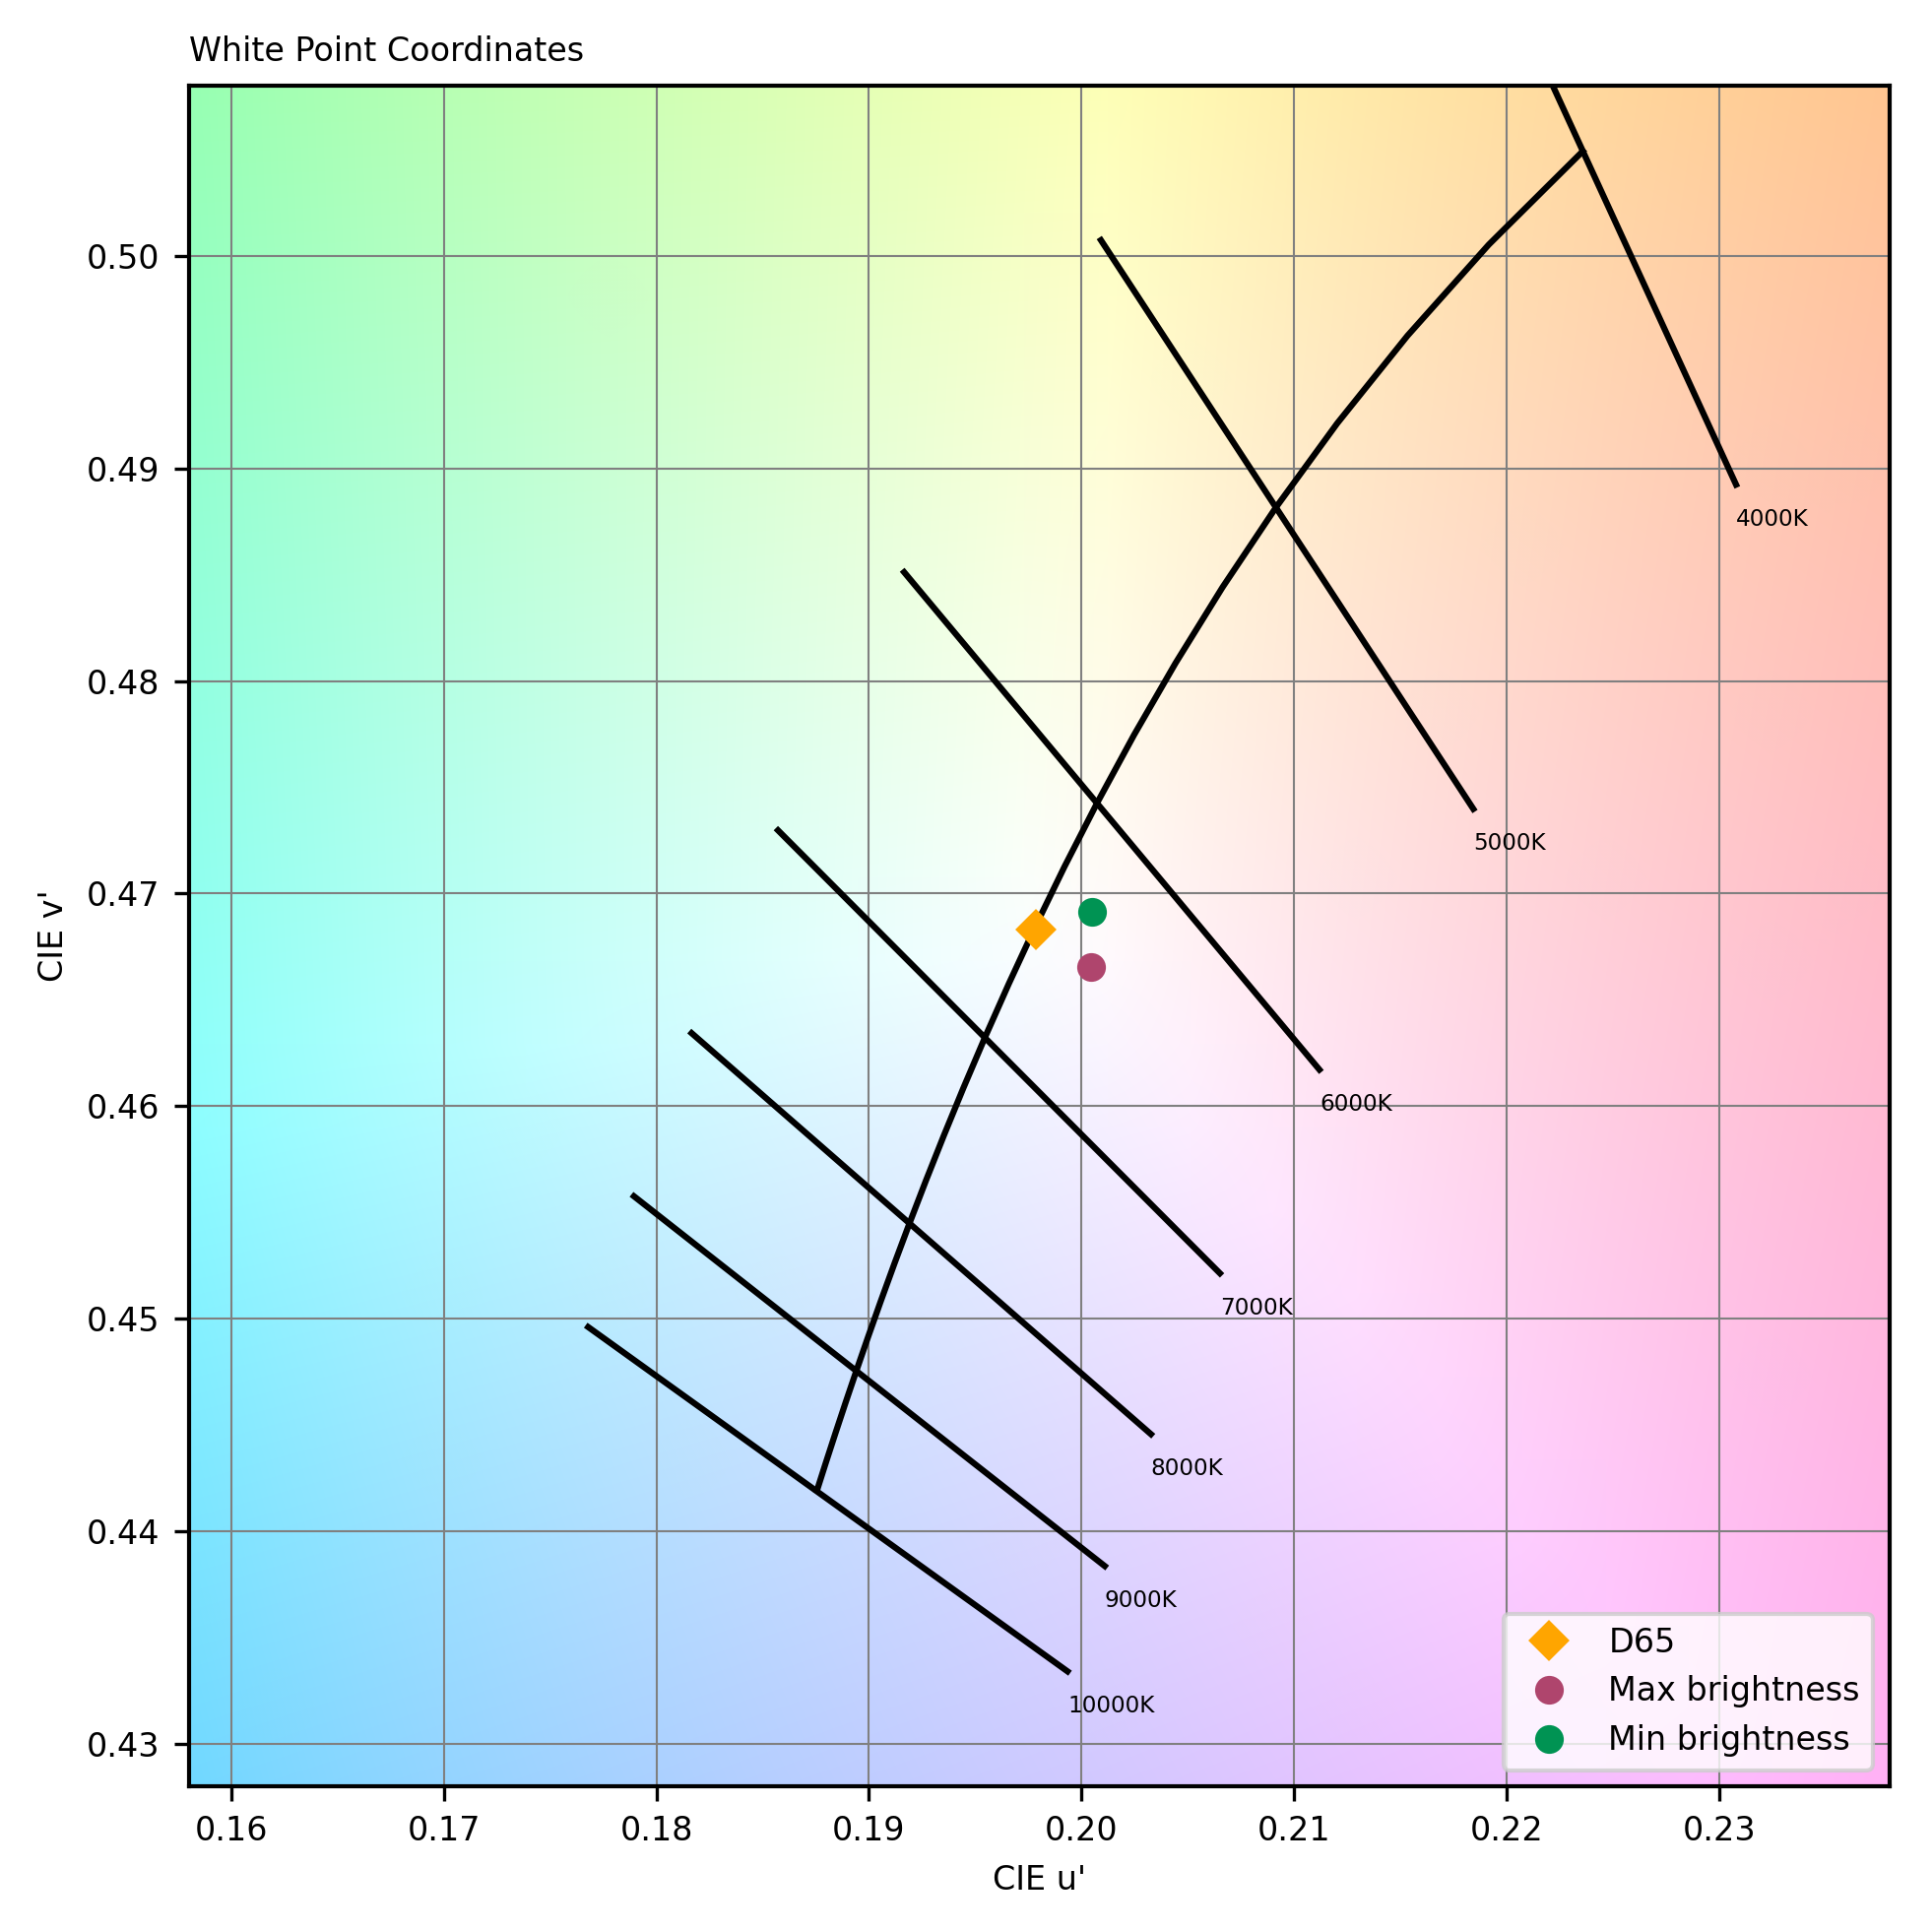
Display white point
This graph represents the color temperature of white content, compared with the reference (Daylight illuminant D65) measured in the dark on video at minimum and maximum brightness.
The following chart presents the playback for the multimedia use case:
Audio playback scores comparison
The following graphs show the frequency response, distortion and directivity in multimedia playback, recorded in our semi-anechoic room:
Audio playback frequency response
A 1/12 octave frequency response graph, which measures the volume of each frequency emitted by the laptop when playing a pure-sine wave in an anechoic environment.
Audio playback Total Harmonic Distortion + Noise
DXOMARK encourages its readers to share comments on the articles. To read or post comments, Disqus cookies are required. Change your Cookies Preferences and read more about our Comment Policy.