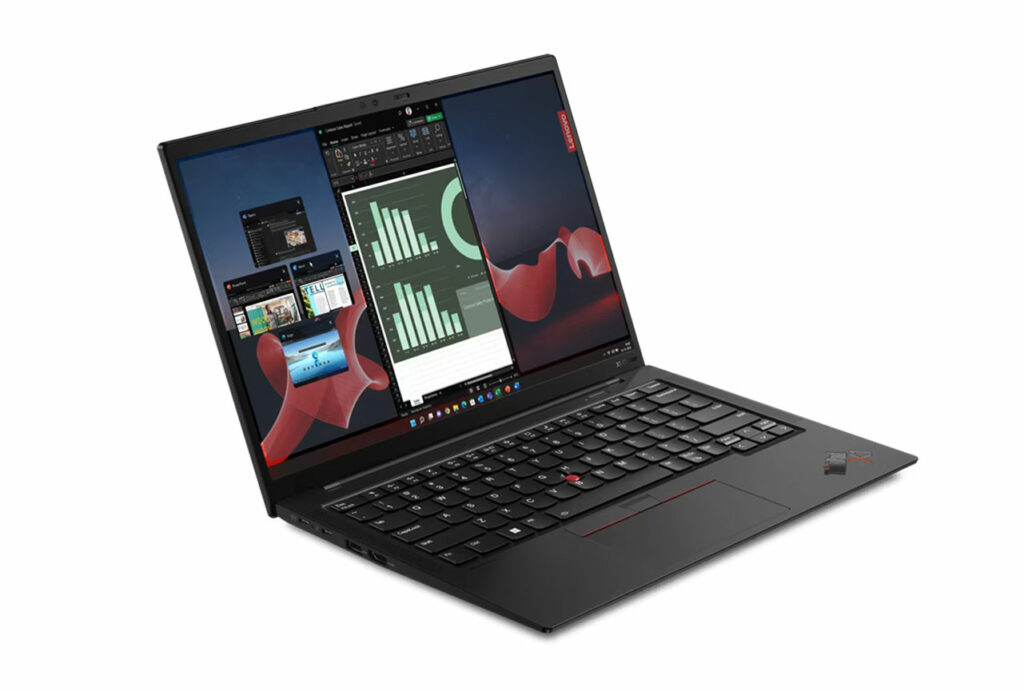
We put the Lenovo ThinkPad X1 Carbon Gen 11 through our rigorous DXOMARK Laptop test suite to measure its performance both at sound, camera and display.
In this review, we will break down how it fared in a variety of tests and several common use cases.
Overview
Key specifications include (as given by the manufacturer):
- Physical specs : 1,536 cm x 31,56 cm x 22,25 cm
- Display : 2880×1800 OLED, 100% DCI-P3, 400 nits
- Audio : Stereo speakers, 2x2W woofers & 2×0.8W tweeters, Dolby Atmos. Quad-microphone array, 360° far-field, Dolby Voice.
- Webcam : MIPI Full HD + IR
Scoring
Use-case and feature subscores included in the calculations of the global score
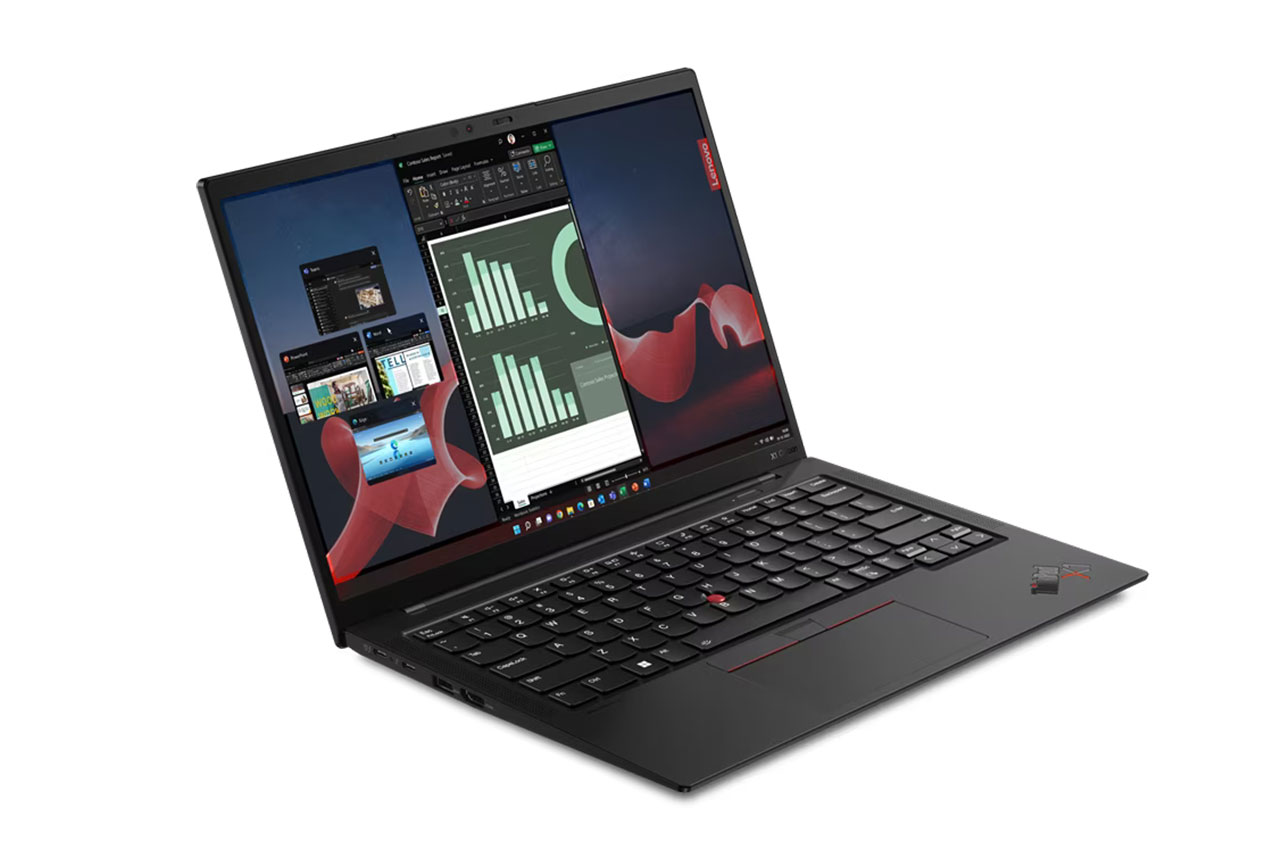
Lenovo ThinkPad X1 Carbon Gen 11
84
95
84
Pros
- In video call, high performance in texture and noise rendering, with high level of detail and well-controlled noise.
- In video call, very good target exposure on faces in most situations
- In video call, good overall voice intelligibility in the most simple situations
- Very good brightness levels, with a high maximum brightness when display HDR contents
- Faithful display color rendering
Cons
- Instabilities in dynamic range, exposure and white balance when in challenging conditions such as high contrast scenes
- Strong gating when voices overlap, impeding voices intelligibility
- In video call, monophonic and omnidirectional capture
- Lack of low-end bass power, bass and attack sharpness
The Lenovo ThinkPad X1 Carbon Gen 11 provided a great experience overall, achieving the best results of all Windows laptops tested to date. However, its best-in-class performance for camera and display was marred by a below-average audio performance for both recording and playback.
Test summary
About DXOMARK Laptop tests: For scoring and analysis in our laptop reviews, DXOMARK engineers perform a variety of objective tests and undertake more than 20 hours of perceptual evaluations under controlled lab conditions and real-life scenarios.
(For more details about the Laptop protocol, click here.)
The following section gathers key elements of our exhaustive tests and analyses performed in DXOMARK laboratories. Detailed performance evaluations under the form of reports are available upon request. Do not hesitate to contact us.
Video Call
Lenovo ThinkPad X1 Carbon Gen 11
144
DXOMARK's Video call use case is a score that evaluates how a device handles video calls and videoconferencing in multiple conditions. This score focuses on the camera performance and the capture and playback rendering of voices. Read more about how we test the use cases of Video call score here.
The Lenovo device’s camera had great target exposure on faces under most conditions, and achieved a high level of detail while controlling noise well. Lack of dynamic range caused highlight clipping in high-contrast scenes, however, along with visible fluctuations in scenes with movement. Despite its quad microphone array, audio recordings were monophonic and lacked directivity. And although voice intelligibility was good in simple situations, strong gating impaired intelligibility when more than one person was talking.
Camera
Lenovo ThinkPad X1 Carbon Gen 11
135
The following chart presents the camera subscores for the video call use case:
The following graphs show the objective measurements performed in our camera labs:
Audio
Lenovo ThinkPad X1 Carbon Gen 11
144
The following chart presents the capture subscores for the video call use case:
The following graphs show the frequency response, distortion and directivity in capture, recorded in our semi-anechoic room:
Music & Video
Lenovo ThinkPad X1 Carbon Gen 11
154
DXOMARK's Video and Music use case score evaluates the capability of a device to reproduce multimedia usages such as videos, movies and music playback in indoor conditions. This score focuses on the display performance and audio-playback rendering. Read more about how we test this use case here.
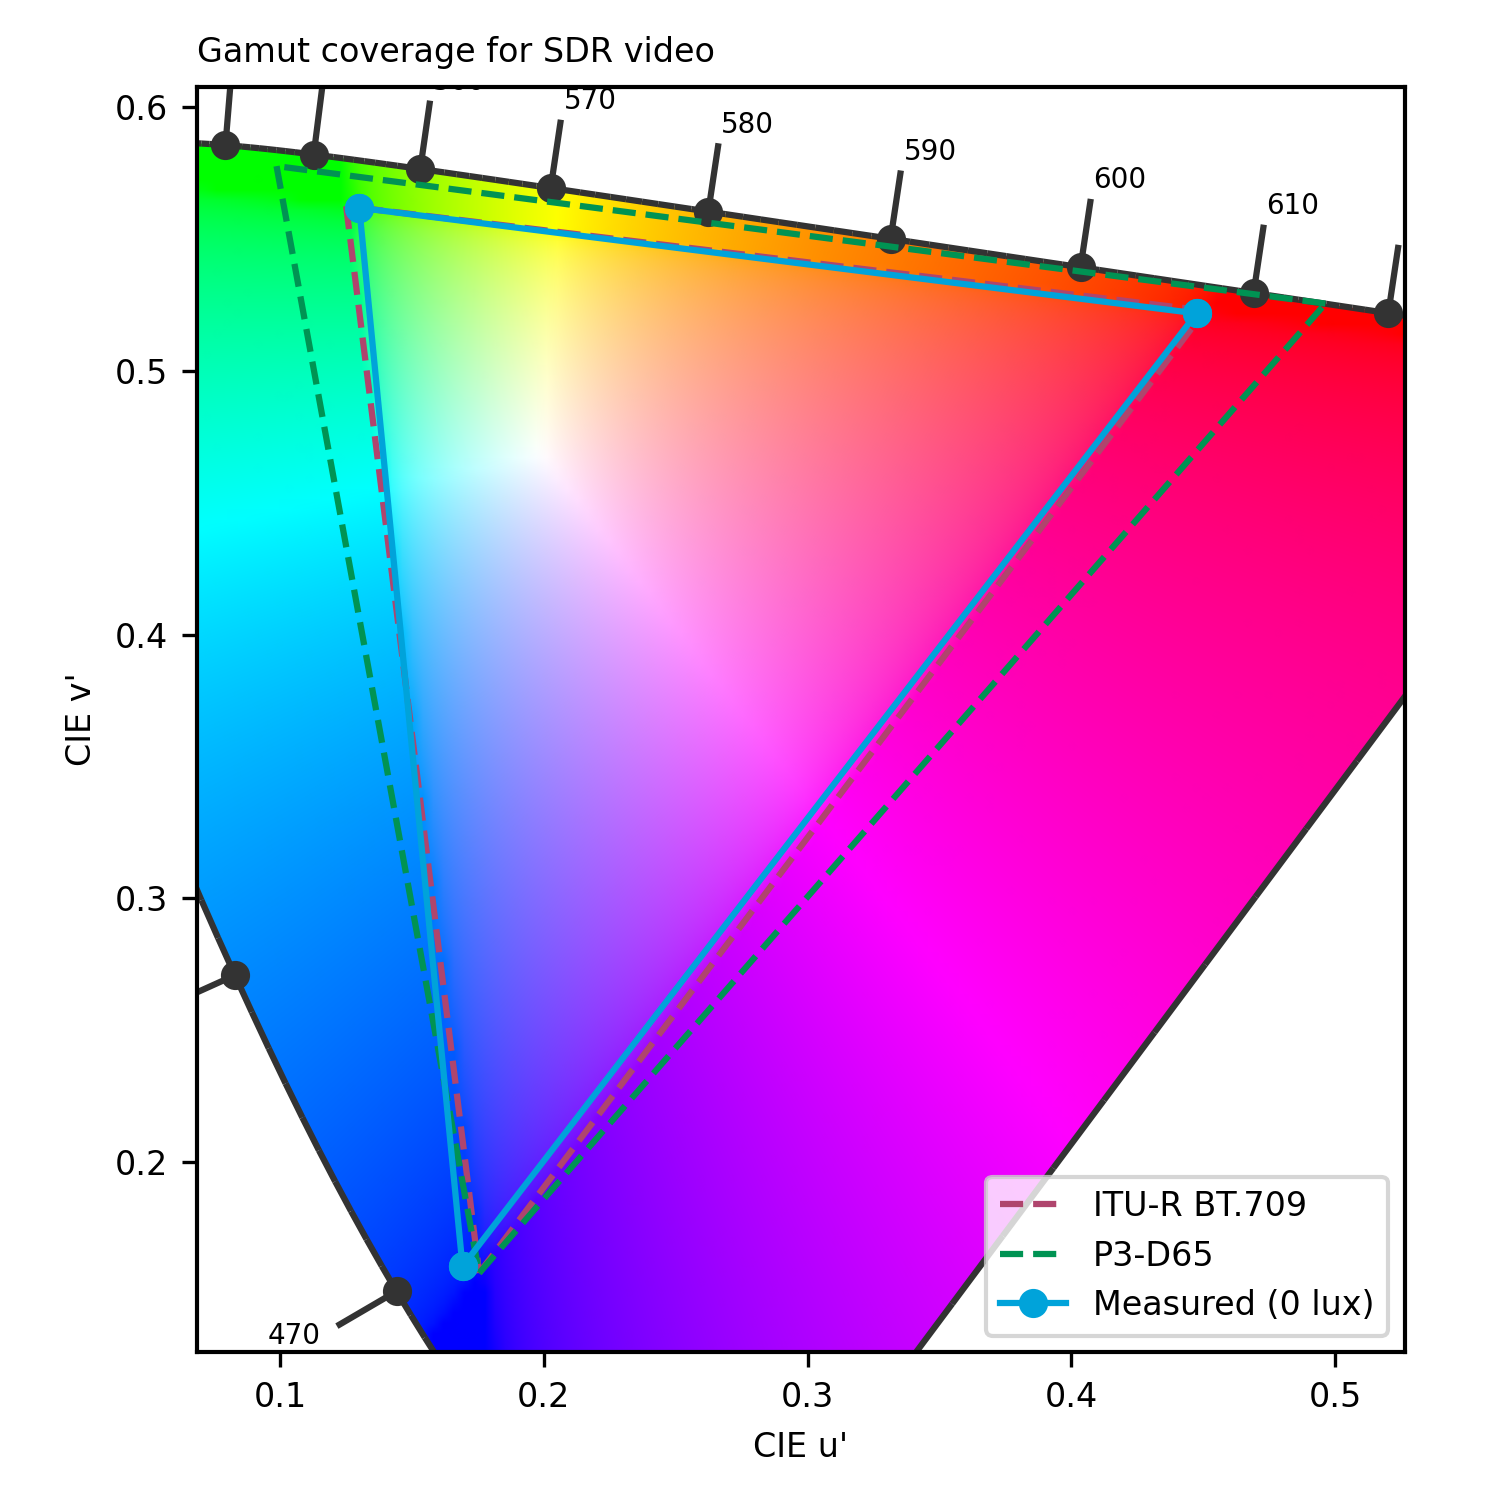
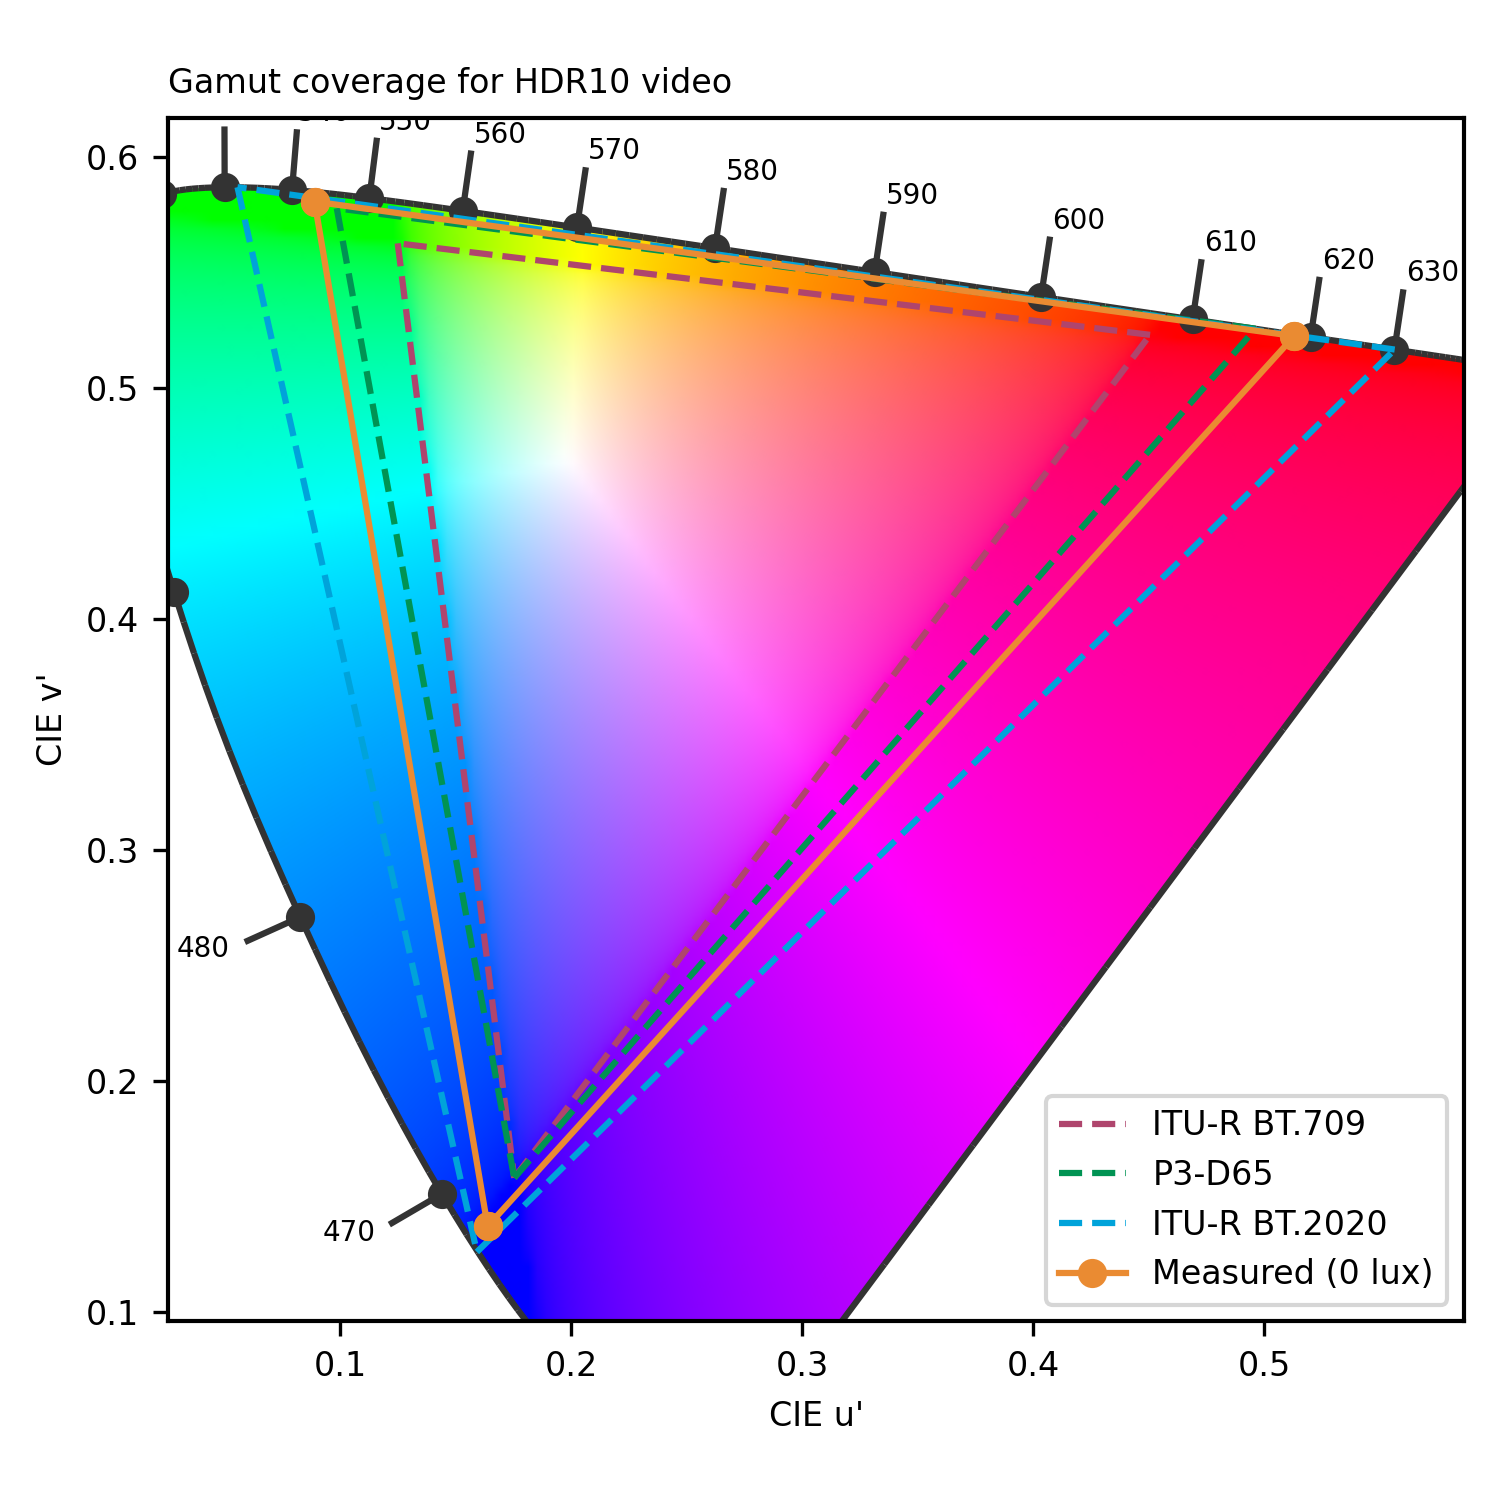
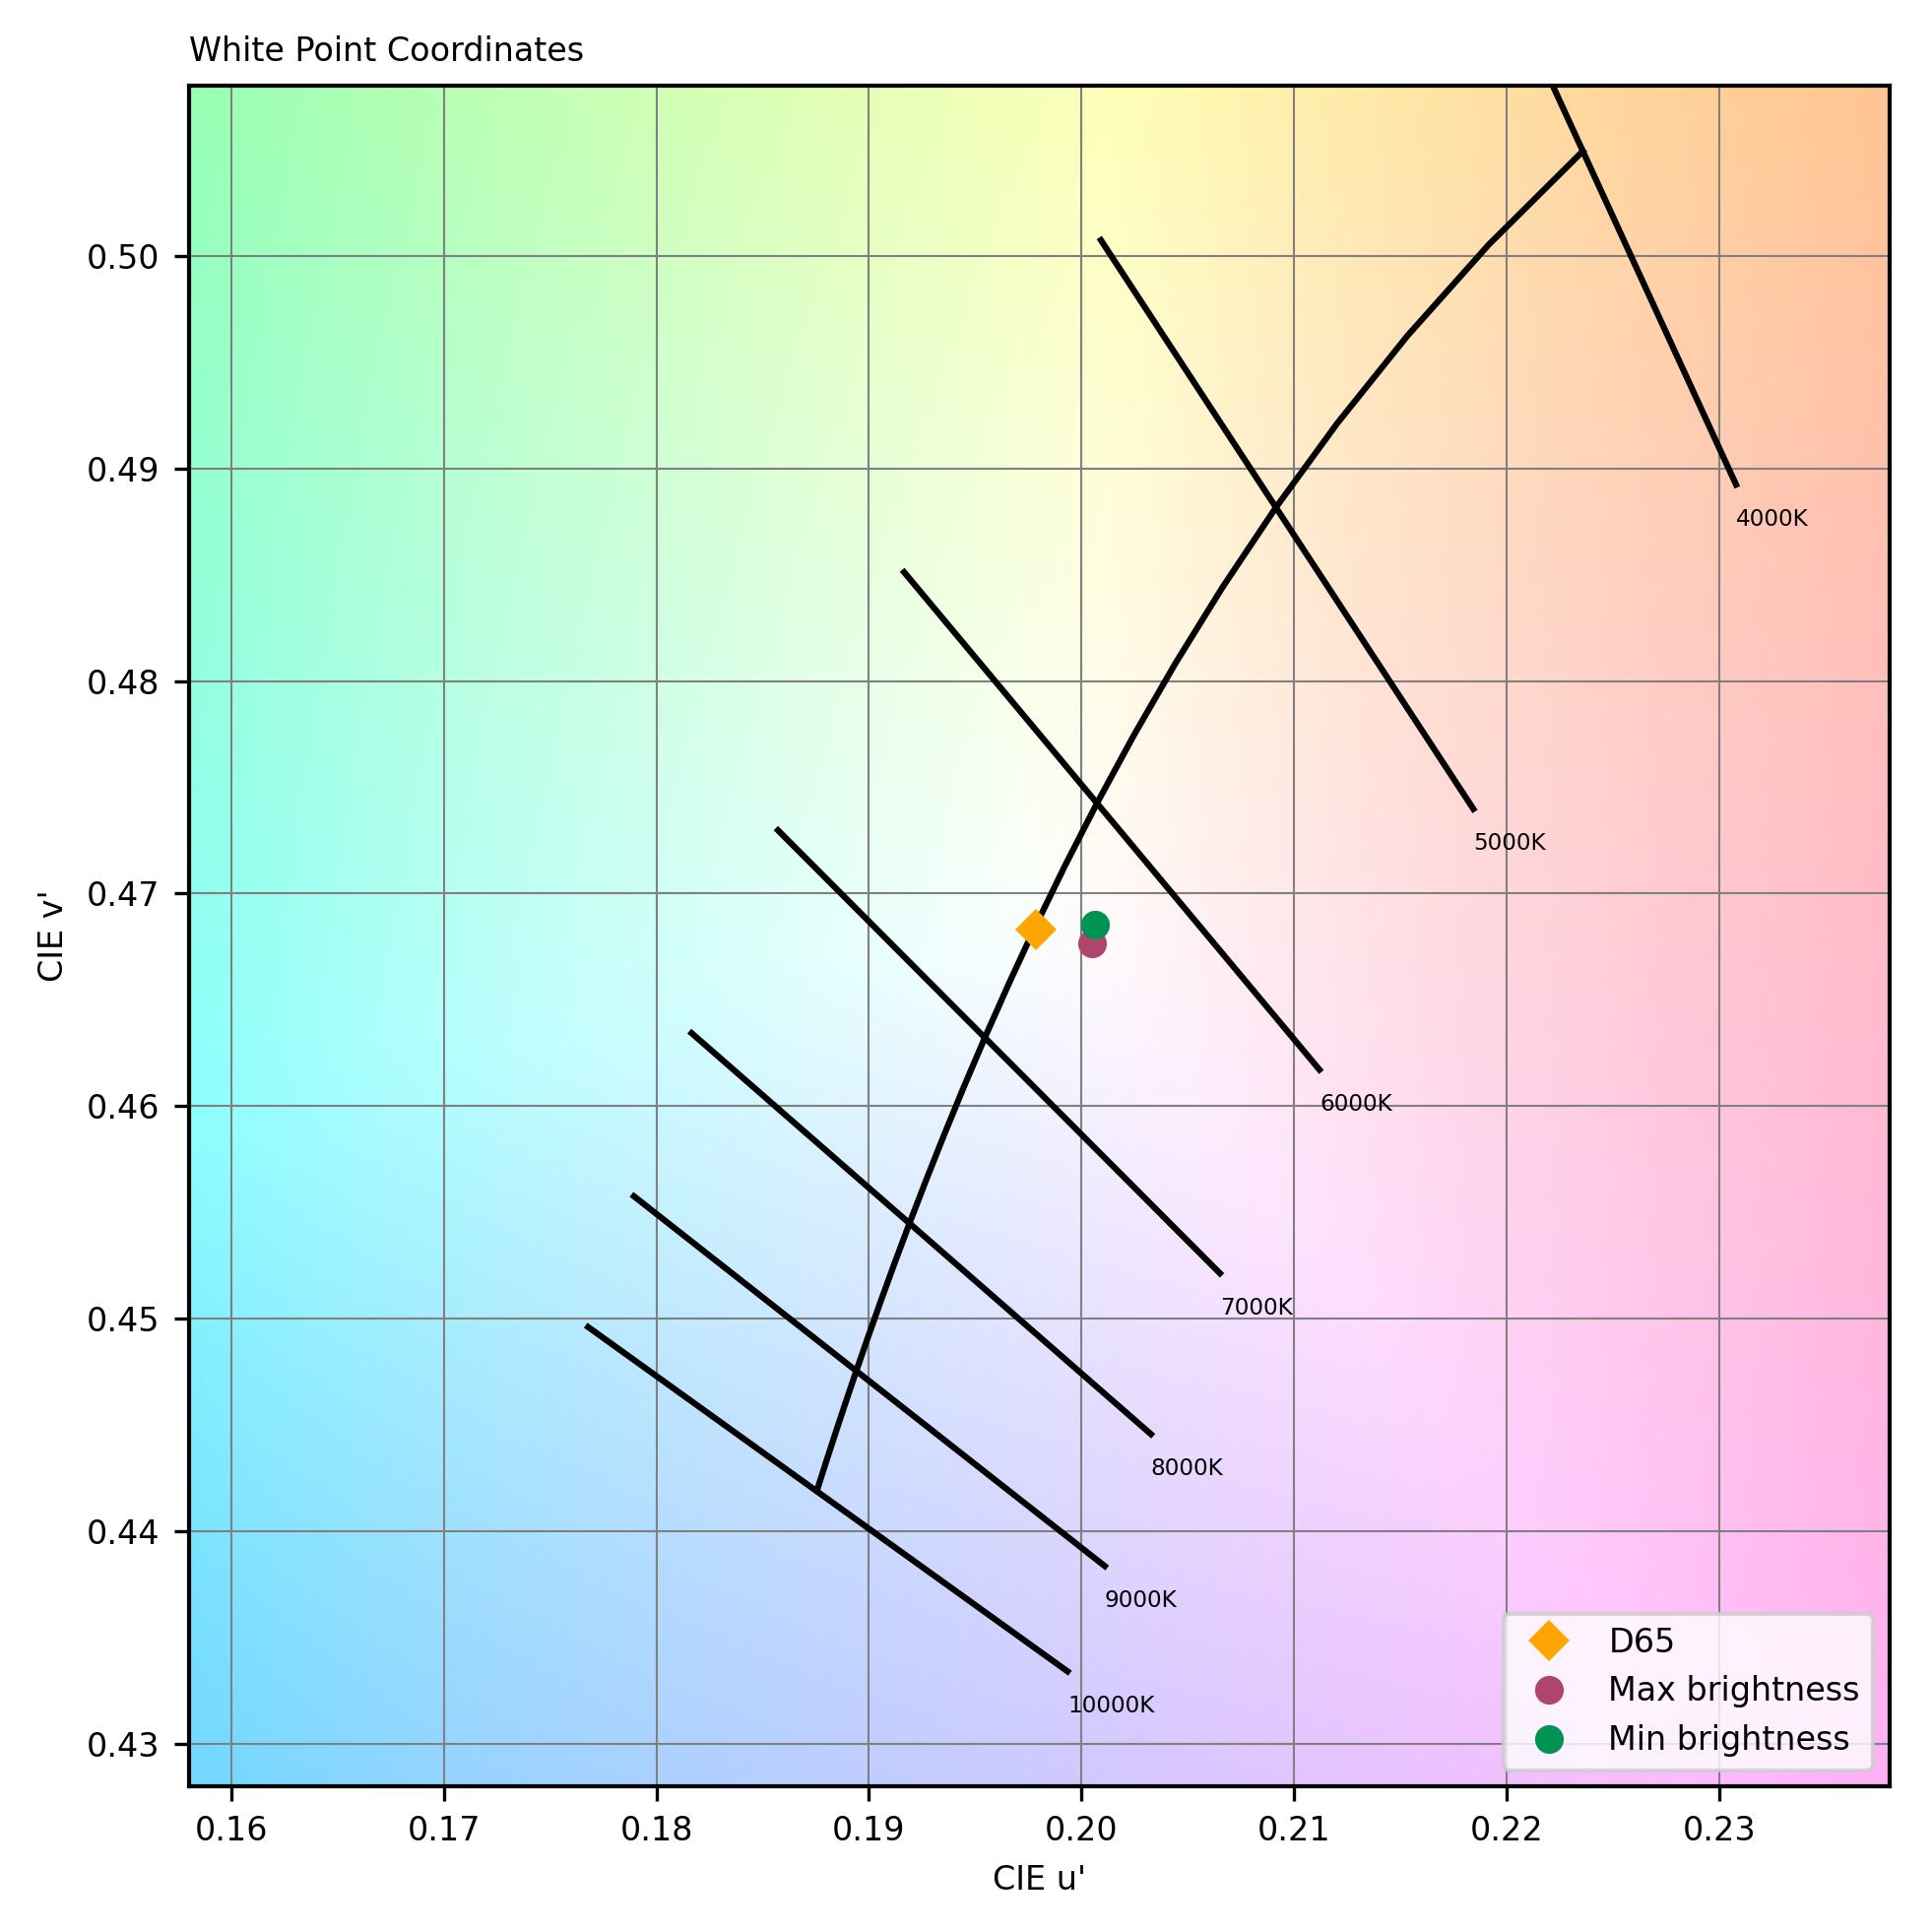
With a maximum brightness of 640 nits, the ThinkPad X1 Carbon Gen 11’s display was brighter than advertised (400 nits). Its HDR performance was the best among tested Windows laptops, with faithful color rendering and good EOTF; but while its SDR perfromance was good overall, blacks were slightly elevated and blues were somewhat desaturated. The device’s audio qualities were a bit disappointing, with a distracting and unexpected fade-in effect whenever audio files were played. Playback quality was further impaired by the lack of bass power, attack sharpness, and punch, along with noticeable pumping.
Display
Lenovo ThinkPad X1 Carbon Gen 11
156
The following chart presents the display subscores for the multimedia use case:
The following graphs show the objective measurements performed in our display lab:
cd/m²
cd/m²
cd/m²
cd/m²
cd/m²
cd/m²
cd/m²
cd/m²
cd/m²
 Distribution of brightness (min)
cd/m²
cd/m²
cd/m²
cd/m²
cd/m²
cd/m²
cd/m²
cd/m²
cd/m²
Distribution of brightness (max)
Audio
Lenovo ThinkPad X1 Carbon Gen 11
152
The following chart presents the playback for the multimedia use case:
The following graphs show the frequency response, distortion and directivity in multimedia playback, recorded in our semi-anechoic room:
DXOMARK encourages its readers to share comments on the articles. To read or post comments, Disqus cookies are required. Change your Cookies Preferences and read more about our Comment Policy.