We put the LG gram Style (14Z90RS) through our rigorous DXOMARK Laptop test suite to measure its performance both at sound, camera and display. In this review, we break down how it fared in a variety of tests and several common use cases.
Overview
Scoring
Use-case and feature subscores included in the calculations of the global score
 LG gram Style (14Z90RS)

56
camera
49
Apple MacBook Pro 14" (M3 Pro, 2023)
Best: Apple MacBook Pro 14" (M3 Pro, 2023) (93)
41
Lenovo ThinkPad X9 Aura
Best: Lenovo ThinkPad X9 Aura (56)
36
Microsoft Surface Laptop 13-inch
Best: Microsoft Surface Laptop 13-inch (79)
65
Apple MacBook Pro 14" (M2 Pro, 2023)
Best: Apple MacBook Pro 14" (M2 Pro, 2023) (83)
143
display
80
Apple MacBook Pro 14" (M3 Pro, 2023)
Best: Apple MacBook Pro 14" (M3 Pro, 2023) (84)
66
Apple MacBook Pro 14" (M3 Pro, 2023)
Best: Apple MacBook Pro 14" (M3 Pro, 2023) (95)
77
Honor MagicBook View 14 (2022)
Best: Honor MagicBook View 14 (2022) (84)
128
audio
125
Apple MacBook Pro 14" (M2 Pro, 2023)
Best: Apple MacBook Pro 14" (M2 Pro, 2023) (149)
130
Acer Swift Go 14
Best: Acer Swift Go 14 (133)
120
Asus Zenbook 14X OLED (2023)
Best: Asus Zenbook 14X OLED (2023) (153)
Pros
- Excellent Windows laptop for display, thanks to a great anti-reflective, semi-matte screen, as well as good management of SDR color and brightness
- Great audio performance during video calls, thanks to great SNR and recording loudness
Cons
- Display gamma is not ideal for watching videos, and some colors are not accurate
- Insufficient bass and low-midrange presence impede full enjoyment of multimedia content
- During video calls, quieter voices may not be picked up due to the strong SNR
The LG gram Style’s excellent display performance takes top honors in our Video Call use case among all other devices tested so far, and comes in near the top in our Music & Video use case as well.
The display, in combination with its great recording capabilities during video calls, makes the LG device the best Windows device in our database to date, coming in just behind the Apple MacBook Pro 14″ and just ahead of the Apple MacBook Air (both 13″ and 15″ versions).
When evaluating the display in Video Call, our experts focus on two things: the performance of SDR content and the reflectivity of the screen. The LG’s display performance of SDR content was top notch, making it a perfect device for all video content outside of HDR. The screen was also very readable in all situations thanks to its good brightness range and gamma.
Test summary
About DXOMARK Laptop tests: For scoring and analysis in our laptop reviews, DXOMARK engineers perform a variety of objective tests and undertake more than 20 hours of perceptual evaluations under controlled lab conditions and real-life scenarios.
(For more details about the Laptop protocol, click here.)
The following section gathers key elements of our exhaustive tests and analyses performed in DXOMARK laboratories. Detailed performance evaluations under the form of reports are available upon request. Do not hesitate to contact us.
LG gram Style (14Z90RS) overall & use-cases scores
Video Call
116
Apple MacBook Pro 14" (M2 Pro, 2023)
Apple MacBook Pro 14" (M2 Pro, 2023)
About DXOMARK Laptop tests
DXOMARK's Video call use case is a score that evaluates how a device handles video calls and videoconferencing in multiple conditions. This score focuses on the camera performance and the capture and playback rendering of voices.
The LG gram Style’s camera put in an unremarkable performance. While it had generally stable white balance, strong clipping in bright areas was often visible, and colors were often desaturated. Further, strong hue shifts near saturation were also visible. However, the LG device provided a great performance in both recording and playback, with excellent recording loudness. Its SNR effectively filtered out background noises during recording; however, the device tended to gate quieter voices during video calls. Its handling of duplex situations was mixed: when used for a meeting with several individuals facing the laptop, the performance was great, but in a one-on-one video call situation, gating was more prominent and heavily impaired voice intelligibility.
Camera
56
Apple MacBook Pro 14" (M3 Pro, 2023)
Apple MacBook Pro 14" (M3 Pro, 2023)
Camera texture acutance on Deadleaves with illuminance levels
This graph shows the evolution of texture acutance with the level of lux measured on a Deadleaves chart.
Camera visual noise evolution with illuminance levels
This graph shows the evolution of spatial visual noise with the level of lux. Spatial visual noise is measured on the visual noise chart in the video noise setup. DXOMARK visual noise measurement is derived from ISO15739 standard.
Target exposure on face with illuminance levels
These measurements take place on a setup combining realistic mannequins and a backlit panel simulating high dynamic range conditions. This graph shows the evolution of lightness measured on the forehead of the realistic mannequin with the level of lux, for multiple lighting conditions. The lightness is measured in L*. Delta EV specifies the difference of luminance in stops between the face and the light panel simulating HDR conditions.
Target exposure on face with illuminance levels in HDR conditions
These measurements take place on a setup combining realistic mannequins and a backlit panel simulating high dynamic range conditions. This graph shows the evolution of lightness measured on the forehead of the realistic mannequin with the level of lux, for multiple lighting conditions. The lightness is measured in L*. Delta EV specifies the difference of luminance in stops between the face and the light panel simulating HDR conditions.
Audio
137
Apple MacBook Pro 14" (M2 Pro, 2023)
Apple MacBook Pro 14" (M2 Pro, 2023)
Audio capture scores comparison
The following graphs show the frequency response, distortion and directivity in capture, recorded in our semi-anechoic room:
Audio capture directivity
Directivity graph of the laptop microphone(s) when capturing test signals using the camera app. It represents the acoustic energy (in dB) over the angle of incidence of the sound source (normalized to the angle 0°, in front of the device).
About DXOMARK Laptop tests
DXOMARK's Video and Music use case score evaluates the capability of a device to reproduce multimedia usages such as videos, movies and music playback in indoor conditions. This score focuses on the display performance and audio-playback rendering.
The LG device’s anti-reflective, semi-matte display screen was effective in improving readability in all ambient lighting. SDR content benefited from well-tuned contrast, good color rendering, and 600 nits of maximum brightness when playing videos. Some colors were not accurate in HDR videos, however. In still usage, maximum brightness fell below 500 nits, which was not enough to provide comfortable viewing in all lighting environments. The LG gram Style’s audio was artifact-free during playback, even at maximum volumes. Its timbre was consistently decent, particularly for upper midrange and treble, although its weaker bass and low-midrange resulted in a thin sound rendition. Dynamics were generally good, though lacking in bass precision and punch.
The following chart presents the display subscores for the multimedia use case:
Display scores comparison
The following graphs show the objective measurements performed in our display lab:
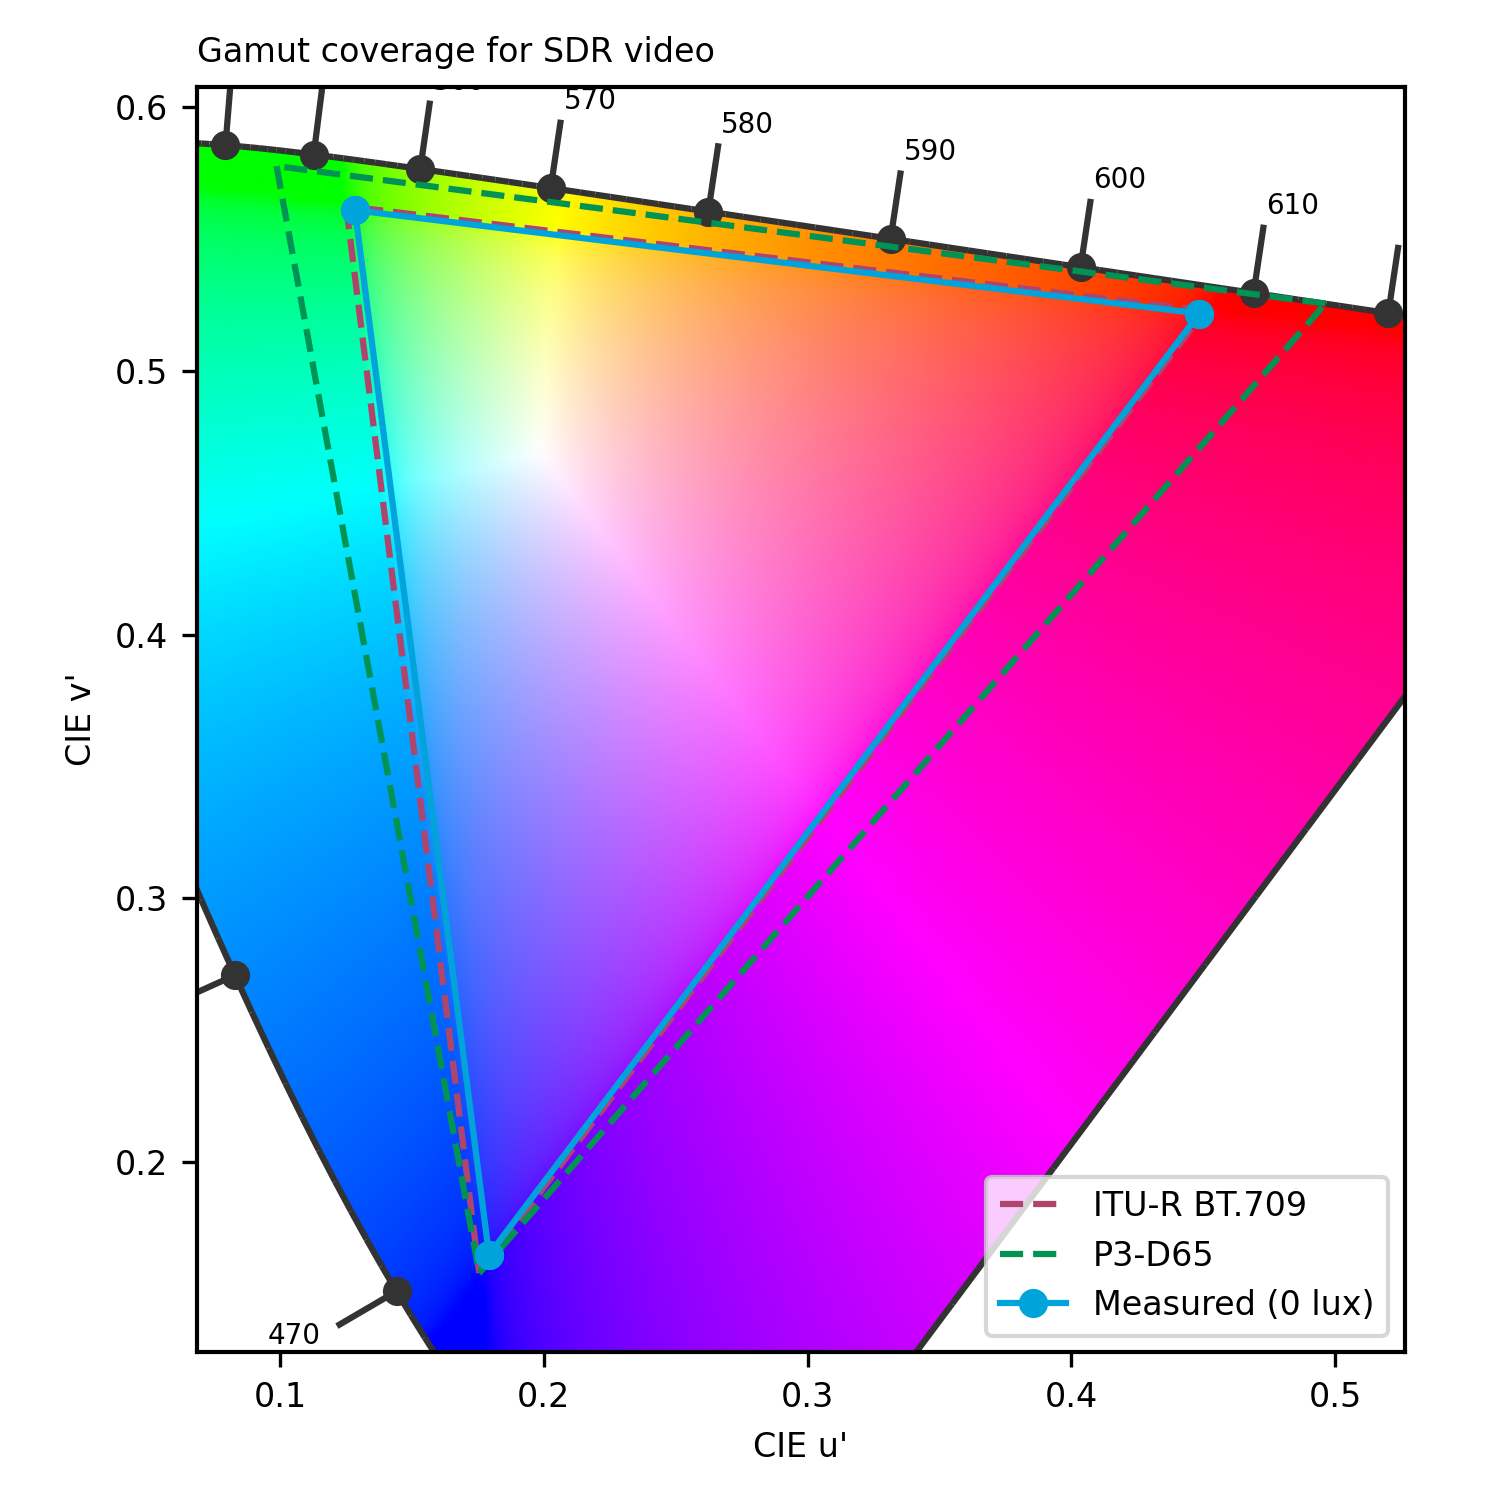
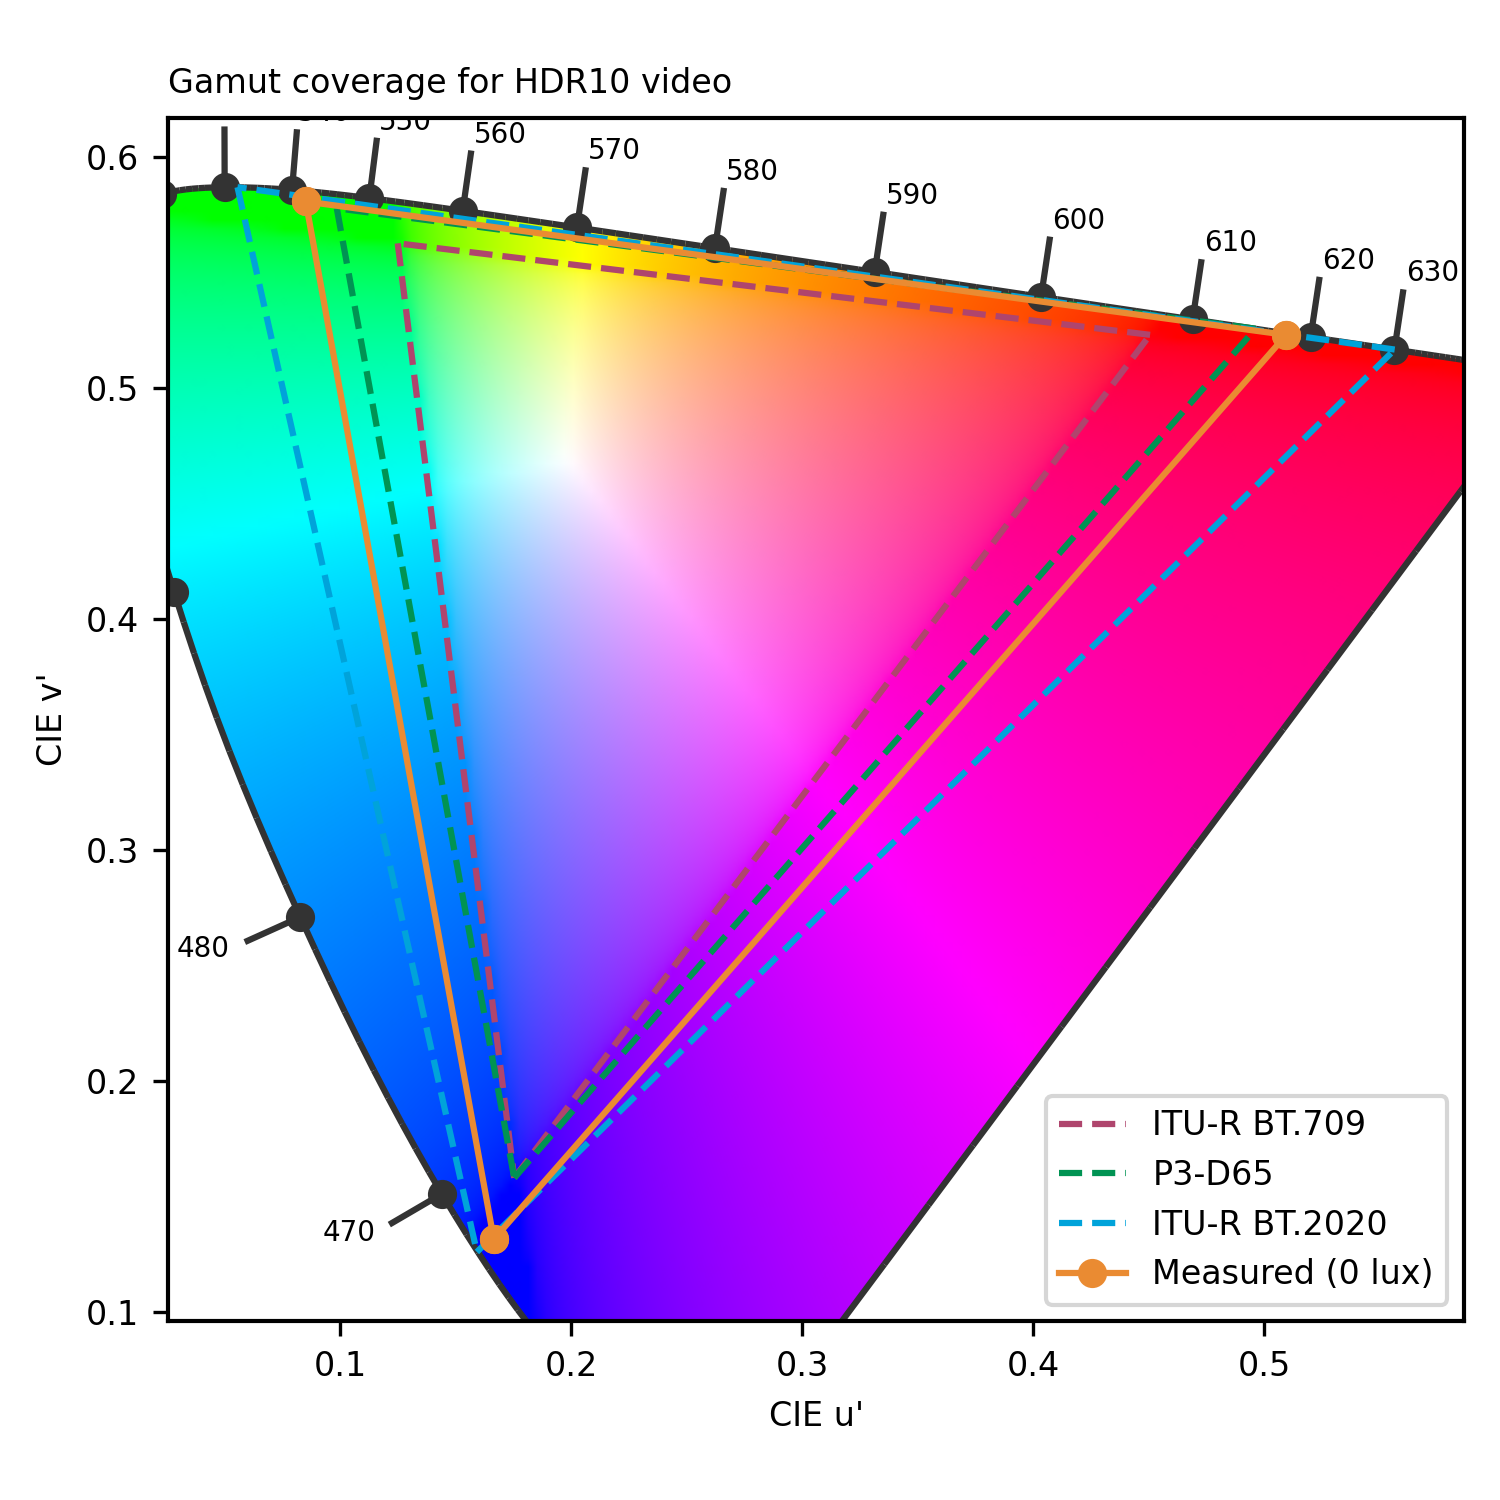
Display gamut coverage for video contents
The primary colors are measured both in HDR10 and SDR. The extracted color gamut shows the extent of the color area that the device can render. To respect the artistic intent, the measured gamut should match the master color space of each video.
Display reflectance measurement (SCI)
Measurements above show the reflection of the device within the visible spectrum range (400 nm to 700 nm). It includes both diffuse and specular reflection.
Display reflectance profile
Display brightness uniformity
0.215
cd/m²
0.169
cd/m²
0.131
cd/m²
0.171
cd/m²
0.145
cd/m²
0.121
cd/m²
0.16
cd/m²
0.161
cd/m²
0.151
cd/m²
 Distribution of brightness (min)
415.7
cd/m²
413.6
cd/m²
421.6
cd/m²
413.2
cd/m²
412
cd/m²
420.3
cd/m²
413.1
cd/m²
409.6
cd/m²
416.6
cd/m²
Distribution of brightness (max)
This illustration shows the brightness measured on nine zones of the display for minimum brightness (left) and maximum brightness (right) for SDR content.
Display SDR EOTF measurement
This graph represents the rendering of contrast (gray levels) for SDR video content, measured in the dark. We expect to be close to the 2.2 or 2.4 gamma references.
Display peak brightness for video contents
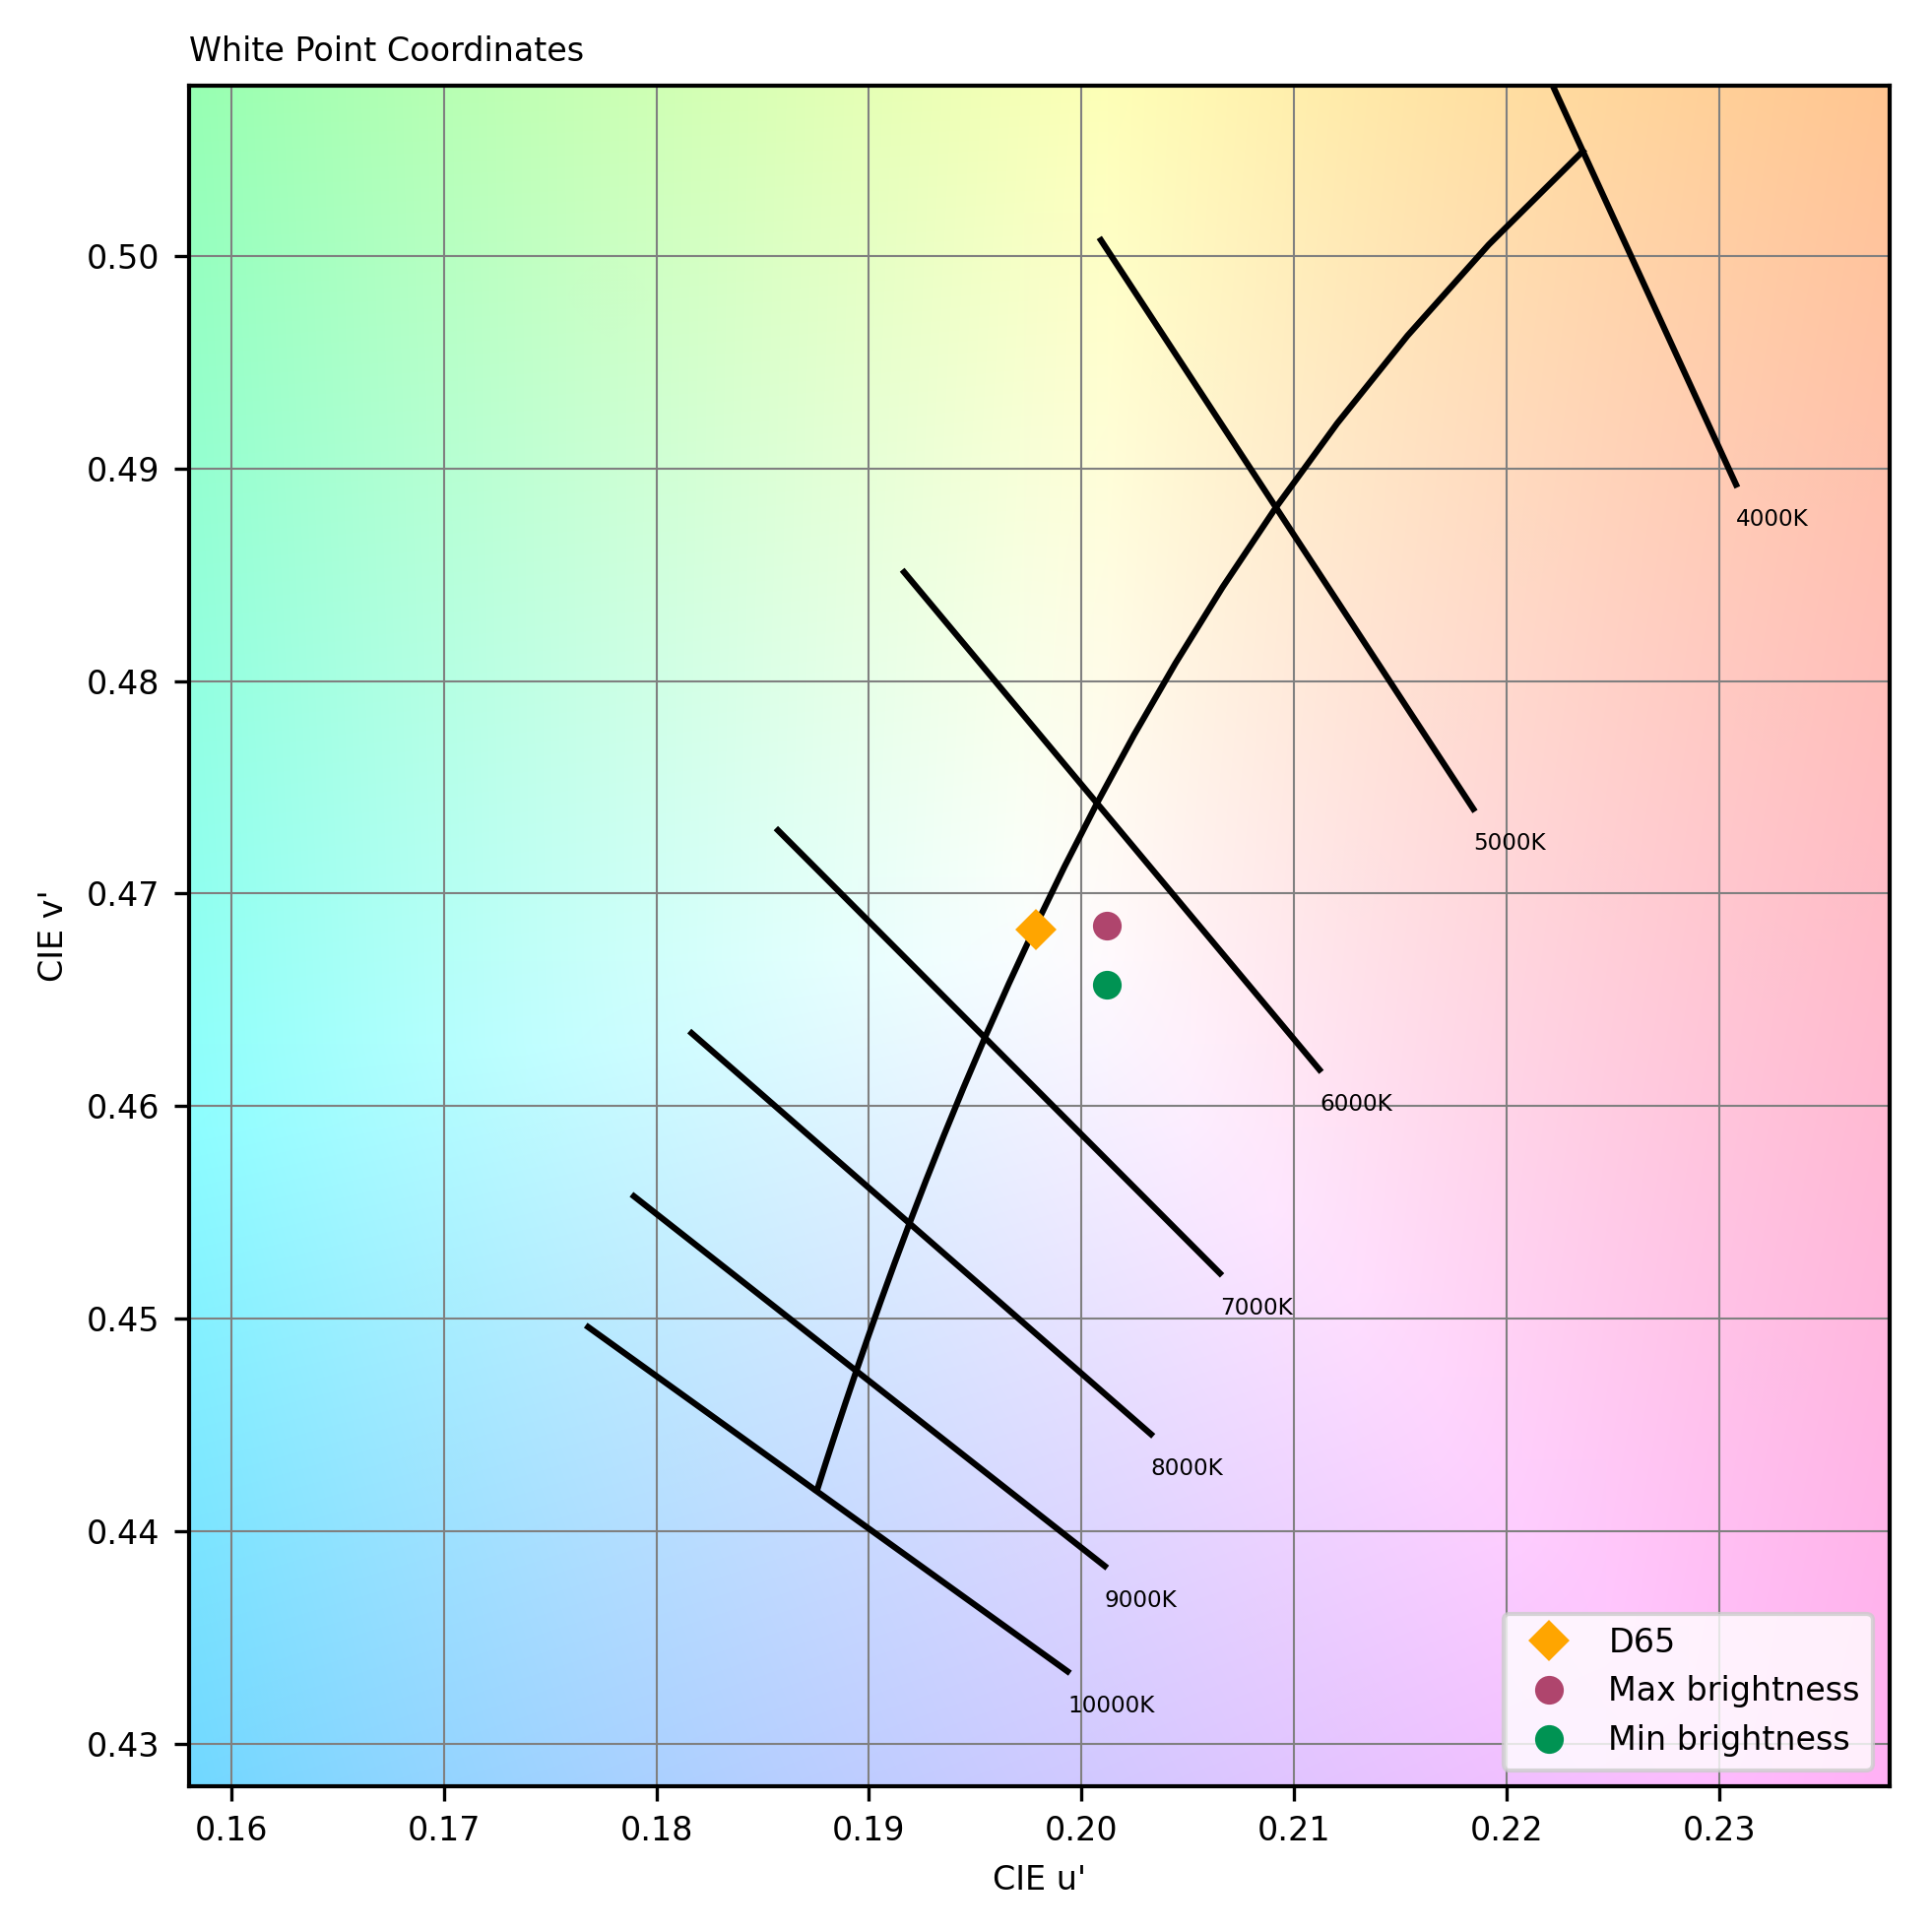
Display white point
This graph represents the color temperature of white content, compared with the reference (Daylight illuminant D65) measured in the dark on video at minimum and maximum brightness.
The following chart presents the playback for the multimedia use case:
Audio playback scores comparison
The following graphs show the frequency response, distortion and directivity in multimedia playback, recorded in our semi-anechoic room:
Audio playback frequency response
A 1/12 octave frequency response graph, which measures the volume of each frequency emitted by the laptop when playing a pure-sine wave in an anechoic environment.
Audio playback Total Harmonic Distortion + Noise
DXOMARK encourages its readers to share comments on the articles. To read or post comments, Disqus cookies are required. Change your Cookies Preferences and read more about our Comment Policy.