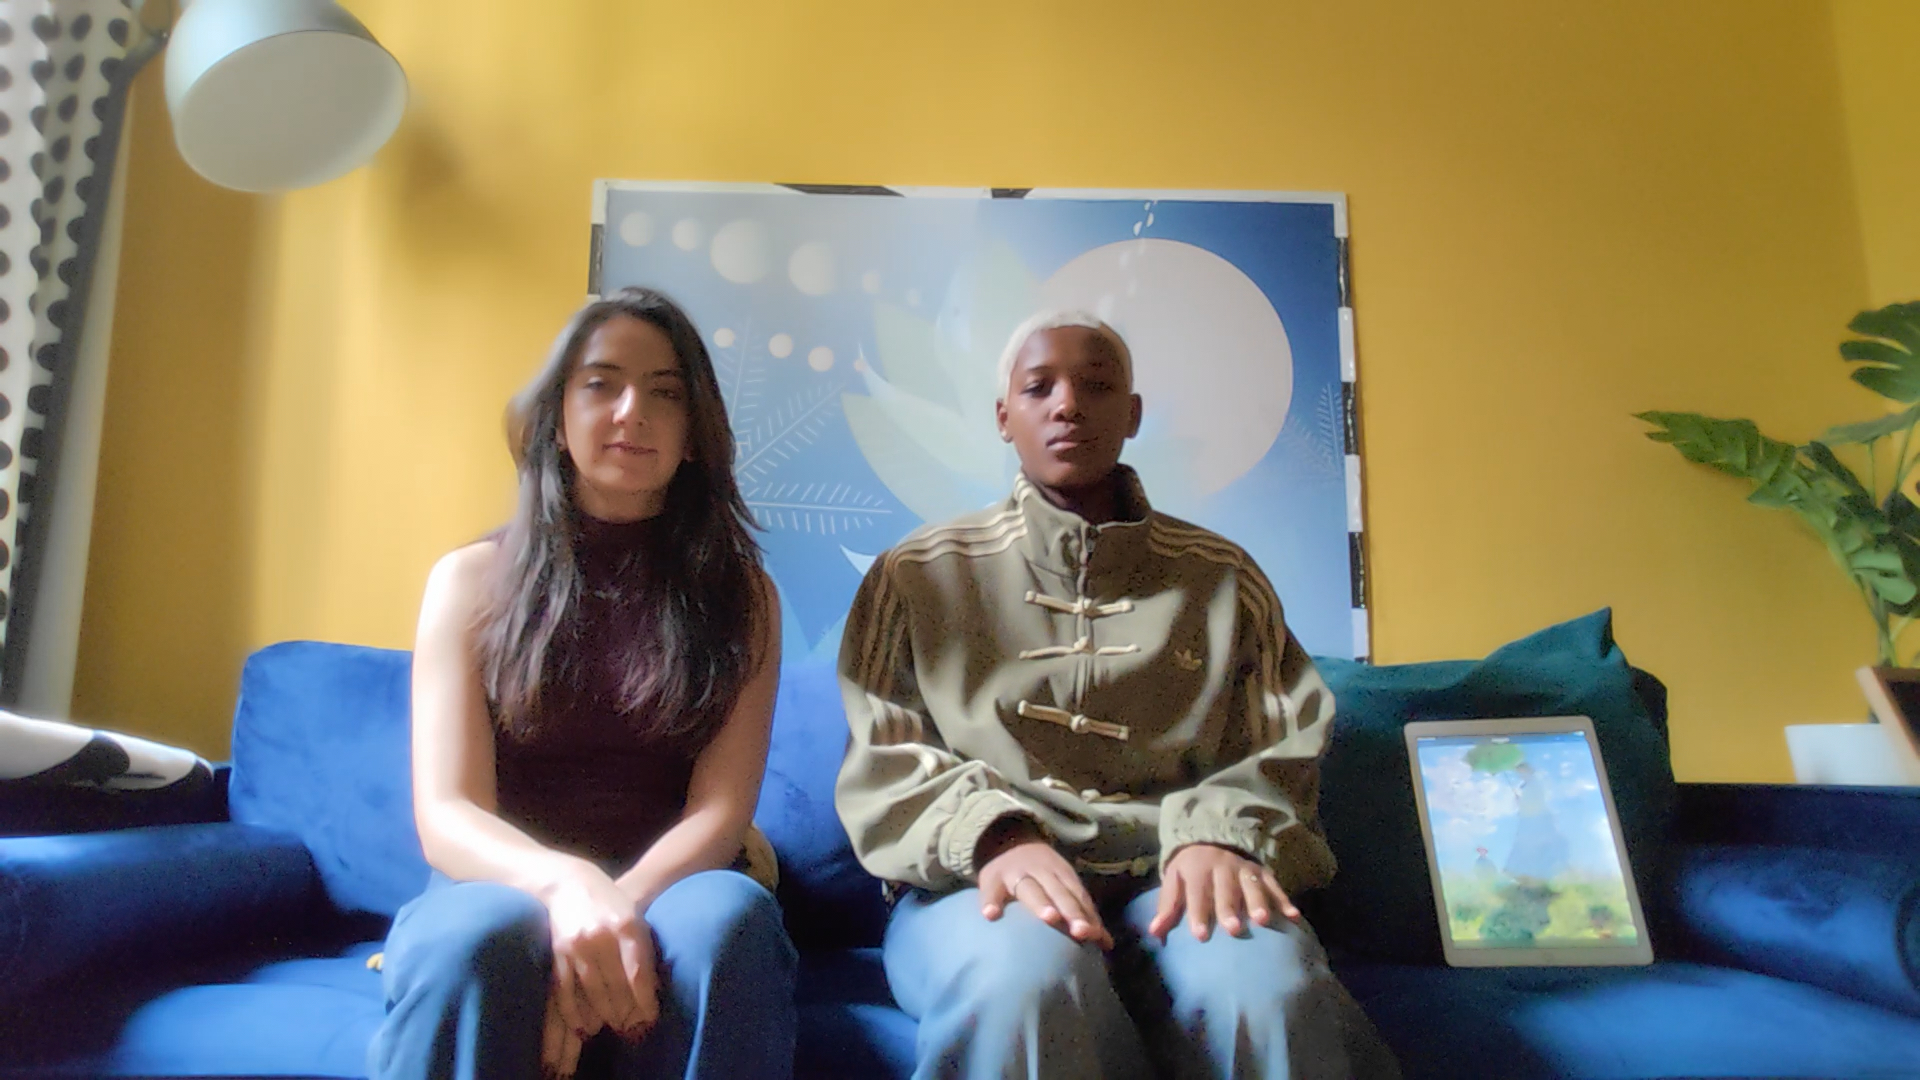
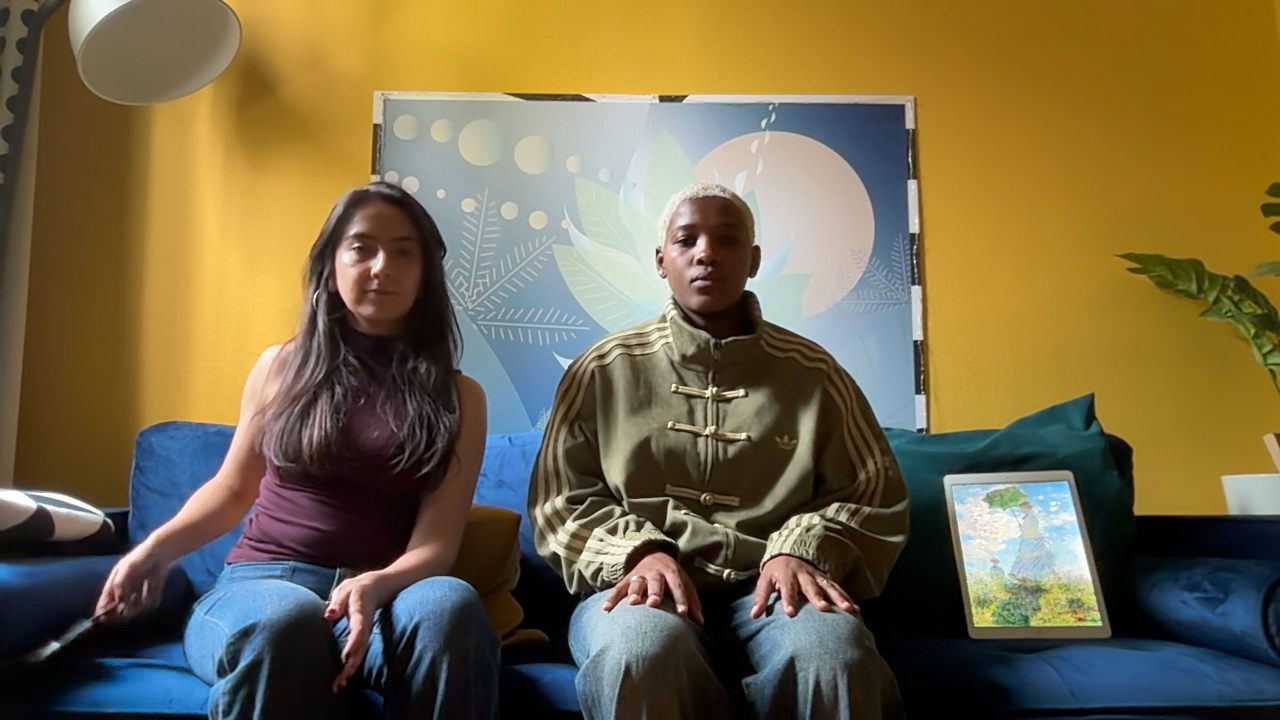
We put the Microsoft Surface Pro 13 inch inch through our rigorous DXOMARK Laptop test suite to measure its performance in sound, camera and display. In this review, we will break down how it fared in a variety of tests and several common use cases.
Overview
Scoring
Use-case and feature subscores included in the calculations of the global score
 Microsoft Surface Pro 13inch (12th Gen)

108
camera
66
Microsoft Surface Pro 13-inch
Best: Microsoft Surface Pro 13-inch (93)
34
Lenovo ThinkPad X9 Aura
Best: Lenovo ThinkPad X9 Aura (56)
82
Microsoft Surface Laptop 13.8-inch
Best: Microsoft Surface Laptop 13.8-inch (84)
68
Apple MacBook Pro 14" (M5; 2025)
Best: Apple MacBook Pro 14" (M5; 2025) (85)
73
Microsoft Surface Laptop 13.8-inch
Best: Microsoft Surface Laptop 13.8-inch (146)
100
Microsoft Surface Laptop 13.8-inch
Best: Microsoft Surface Laptop 13.8-inch (146)
Pros
- Generally accurate white balance with pleasant color rendering
- Low noise levels in bright conditions with static subjects
- Accurate and stable exposure in most lighting conditions
Cons
- Visible noise in indoor and low-light conditions, particularly during motion
- Occasional loss of fine detail with unnatural texture rendering
- Slightly undersaturated colors in indoor conditions
In our comprehensive evaluation of the Microsoft Surface Pro 13 inch, the camera delivers a generally consistent performance, particularly in bright lighting conditions where it benefits from accurate white balance, pleasant color rendering and controlled noise levels.
In bright environments, color rendering remains pleasant and noise is kept at a low level, particularly when the subject remains static. Exposure is also accurate and stable in most lighting conditions, allowing faces and the overall scene to remain consistently rendered during video conferencing. However, the performance becomes less convincing in indoor and low-light conditions, where visible noise is noticeable and becomes more pronounced during motion. Some loss of detail can also be observed, with occasional unnatural texture rendering affecting fine structures. In HDR conditions, some clipping is noticeable, highlighting a limitation compared to other devices. Color rendering is slightly less convincing in indoor conditions, where colors can appear somewhat undersaturated.
Overall, the Microsoft Surface Pro 13 inch provides a reliable camera experience, with accurate exposure, stable white balance and pleasant color rendering being among its main strengths. However, noise, detail loss and slightly undersaturated colors become more noticeable as lighting conditions and motion become more challenging.
Microsoft Surface Pro 13inch (12th Gen)
Test summary
About DXOMARK Laptop tests: For scoring and analysis in our laptop reviews, DXOMARK engineers perform a variety of objective tests and undertake more than 20 hours of perceptual evaluations under controlled lab conditions and real-life scenarios. (For more details about the Laptop protocol, click here.)
The following section gathers key elements of our exhaustive tests and analyses performed in DXOMARK laboratories. Detailed performance evaluations under the form of reports are available upon request. Do not hesitate to contact us.
Camera
108
Microsoft Surface Pro 13inch (12th Gen)
146
Microsoft Surface Laptop 13.8-inch
Microsoft Surface Laptop 13.8-inch
About DXOMARK Camera Laptop tests
DXOMARK evaluates the image quality of the built in camera during video calls, whether with a single person or with multiple people, in a variety of lighting conditions. Our camera evaluation particularly assesses the ability of the built-in camera to clearly render human faces during video calls. Other intrinsic camera quality aspects are also evaluated, like color reproduction, texture and noise, as well as artefacts.
Camera texture acutance on Deadleaves with illuminance levels (Eugene)
This graph shows the evolution of texture acutance with the level of lux measured on a Deadleaves chart.
Camera texture acutance on Deadleaves with illuminance levels (Eugene)
This graph shows the evolution of texture acutance with the level of lux measured on a Deadleaves chart.
Camera texture acutance on Deadleaves with illuminance levels (Eugene)
This graph shows the evolution of texture acutance with the level of lux measured on a Deadleaves chart.
Camera texture acutance on Deadleaves with illuminance levels (Eugene)
This graph shows the evolution of texture acutance with the level of lux measured on a Deadleaves chart.
Camera texture acutance on Deadleaves with illuminance levels (Diana)
This graph shows the evolution of texture acutance with the level of lux measured on a Deadleaves chart.
Camera texture acutance on Deadleaves with illuminance levels (Diana)
This graph shows the evolution of texture acutance with the level of lux measured on a Deadleaves chart.
Camera texture acutance on Deadleaves with illuminance levels (Diana)
This graph shows the evolution of texture acutance with the level of lux measured on a Deadleaves chart.
Camera texture acutance on Deadleaves with illuminance levels (Diana)
This graph shows the evolution of texture acutance with the level of lux measured on a Deadleaves chart.
Camera visual noise evolution with illuminance levels (Eugene)
This graph shows the evolution of spatial visual noise with the level of lux. Spatial visual noise is measured on the visual noise chart in the video noise setup. DXOMARK visual noise measurement is derived from ISO15739 standard.
Camera visual noise evolution with illuminance levels (Eugene)
This graph shows the evolution of spatial visual noise with the level of lux. Spatial visual noise is measured on the visual noise chart in the video noise setup. DXOMARK visual noise measurement is derived from ISO15739 standard.
Camera visual noise evolution with illuminance levels (Eugene)
This graph shows the evolution of spatial visual noise with the level of lux. Spatial visual noise is measured on the visual noise chart in the video noise setup. DXOMARK visual noise measurement is derived from ISO15739 standard.
Camera visual noise evolution with illuminance levels (Eugene)
This graph shows the evolution of spatial visual noise with the level of lux. Spatial visual noise is measured on the visual noise chart in the video noise setup. DXOMARK visual noise measurement is derived from ISO15739 standard.
Camera visual noise evolution with illuminance levels (Diana)
This graph shows the evolution of spatial visual noise with the level of lux. Spatial visual noise is measured on the visual noise chart in the video noise setup. DXOMARK visual noise measurement is derived from ISO15739 standard.
Camera visual noise evolution with illuminance levels (Diana)
This graph shows the evolution of spatial visual noise with the level of lux. Spatial visual noise is measured on the visual noise chart in the video noise setup. DXOMARK visual noise measurement is derived from ISO15739 standard.
Camera visual noise evolution with illuminance levels (Diana)
This graph shows the evolution of spatial visual noise with the level of lux. Spatial visual noise is measured on the visual noise chart in the video noise setup. DXOMARK visual noise measurement is derived from ISO15739 standard.
Camera visual noise evolution with illuminance levels (Diana)
This graph shows the evolution of spatial visual noise with the level of lux. Spatial visual noise is measured on the visual noise chart in the video noise setup. DXOMARK visual noise measurement is derived from ISO15739 standard.
Target exposure on face with illuminance levels in HDR conditions (Eugene)
These measurements take place on a setup combining realistic mannequins and a backlit panel simulating high dynamic range conditions. This graph shows the evolution of lightness measured on the forehead of the realistic mannequin with the level of lux, for multiple lighting conditions. The lightness is measured in L*. Delta EV specifies the difference of luminance in stops between the face and the light panel simulating HDR conditions.
Target exposure on face with illuminance levels in HDR conditions (Eugene)
These measurements take place on a setup combining realistic mannequins and a backlit panel simulating high dynamic range conditions. This graph shows the evolution of lightness measured on the forehead of the realistic mannequin with the level of lux, for multiple lighting conditions. The lightness is measured in L*. Delta EV specifies the difference of luminance in stops between the face and the light panel simulating HDR conditions.
Target exposure on face with illuminance levels in HDR conditions (Eugene)
These measurements take place on a setup combining realistic mannequins and a backlit panel simulating high dynamic range conditions. This graph shows the evolution of lightness measured on the forehead of the realistic mannequin with the level of lux, for multiple lighting conditions. The lightness is measured in L*. Delta EV specifies the difference of luminance in stops between the face and the light panel simulating HDR conditions.
Target exposure on face with illuminance levels in HDR conditions (Eugene)
These measurements take place on a setup combining realistic mannequins and a backlit panel simulating high dynamic range conditions. This graph shows the evolution of lightness measured on the forehead of the realistic mannequin with the level of lux, for multiple lighting conditions. The lightness is measured in L*. Delta EV specifies the difference of luminance in stops between the face and the light panel simulating HDR conditions.
Target exposure on face with illuminance levels in HDR conditions (Diana)
These measurements take place on a setup combining realistic mannequins and a backlit panel simulating high dynamic range conditions. This graph shows the evolution of lightness measured on the forehead of the realistic mannequin with the level of lux, for multiple lighting conditions. The lightness is measured in L*. Delta EV specifies the difference of luminance in stops between the face and the light panel simulating HDR conditions.
Target exposure on face with illuminance levels in HDR conditions (Diana)
These measurements take place on a setup combining realistic mannequins and a backlit panel simulating high dynamic range conditions. This graph shows the evolution of lightness measured on the forehead of the realistic mannequin with the level of lux, for multiple lighting conditions. The lightness is measured in L*. Delta EV specifies the difference of luminance in stops between the face and the light panel simulating HDR conditions.
Target exposure on face with illuminance levels in HDR conditions (Diana)
These measurements take place on a setup combining realistic mannequins and a backlit panel simulating high dynamic range conditions. This graph shows the evolution of lightness measured on the forehead of the realistic mannequin with the level of lux, for multiple lighting conditions. The lightness is measured in L*. Delta EV specifies the difference of luminance in stops between the face and the light panel simulating HDR conditions.
Target exposure on face with illuminance levels in HDR conditions (Diana)
These measurements take place on a setup combining realistic mannequins and a backlit panel simulating high dynamic range conditions. This graph shows the evolution of lightness measured on the forehead of the realistic mannequin with the level of lux, for multiple lighting conditions. The lightness is measured in L*. Delta EV specifies the difference of luminance in stops between the face and the light panel simulating HDR conditions.

 English