We put the Microsoft Surface Pro 9 5G through our rigorous DXOMARK Laptop test suite to measure its performance both at sound, camera and display.
In this review, we will break down how it fared in a variety of tests and several common use cases.
Overview
Key specifications include (as given by the manufacturer):
- Physical specs : 287 x 209 x 9.3, 883g
- Display : 2880×1920, Dynamic 120Hz, Touch, sRGB
- Audio : 2W stereo speakers with Dolby Atmos, Dual far field studio microphones
- Webcam : Front-facing camera with 1080p full HD video, 10.0 MP rear-facing autofocus camera with 1080p HD and 4k video
Scoring
Use-case and feature subscores included in the calculations of the global score
Microsoft Surface Pro 9 5G
84
95
84
Pros
- In video call, accurate face exposure and dynamic range, even in challenging conditions
- In video call, great voice intelligibility thanks to great voice tonal balance, good noise reduction and sharp envelopes for both playback and capture
- In video call, good directivity with the sound source focusing on the person in the field of view of the camera
- In Music & Video, Good spatial performance, with immersive wideness and realistic distance rendition
- Generally good display readability with a great brightness range
Cons
- On Camera, while doing video calls, dynamic range could be limited in high contast scenes
- On Camera, oversaturated colors and skintones
- Limitations in double talk situations, with strong gating, masking the main person speaking
- Limited display contrast level while watching videos, showing limitations while rendering deep blacks
- Limited readability of the screen in backlit situations due to a high reflectivity
- No HDR panel
The Microsoft Surface Pro 9 5G put in a great overall performance overall, tying for second-best Windows product tested in this first batch. Its performance in video call was stellar, but despite lackng HDR capability, it was nonethess very suitable for multimedia use.
Test summary
About DXOMARK Laptop tests: For scoring and analysis in our laptop reviews, DXOMARK engineers perform a variety of objective tests and undertake more than 20 hours of perceptual evaluations under controlled lab conditions and real-life scenarios.
(For more details about the Laptop protocol, click here.)
The following section gathers key elements of our exhaustive tests and analyses performed in DXOMARK laboratories. Detailed performance evaluations under the form of reports are available upon request. Do not hesitate to contact us.
Video Call
Microsoft Surface Pro 9 5G
144
DXOMARK's Video call use case is a score that evaluates how a device handles video calls and videoconferencing in multiple conditions. This score focuses on the camera performance and the capture and playback rendering of voices. Read more about how we test the use cases of Video call score here.
The Surface Pro 9 5G (along with its non-5G sibling) had the best Windows performance for camera, with good details and face exposure even in challenging situations, even though dynamic range can be limited in high-contrast scenes. On the downside, colors and skin tones appeared oversaturated, and colorful environments led to white balance instabilities. Audio quality was good in most situations, with well-tuned tonal balance and noise reduction leading to great voice intelligibility for both playback and capture. Capture offers good directivity, but strong gating was induced whenever more than one person was speaking.
Camera
Microsoft Surface Pro 9 5G
135
The following chart presents the camera subscores for the video call use case:
The following graphs show the objective measurements performed in our camera labs:
Audio
Microsoft Surface Pro 9 5G
144
The following chart presents the capture subscores for the video call use case:
The following graphs show the frequency response, distortion and directivity in capture, recorded in our semi-anechoic room:
Music & Video
Microsoft Surface Pro 9 5G
154
DXOMARK's Video and Music use case score evaluates the capability of a device to reproduce multimedia usages such as videos, movies and music playback in indoor conditions. This score focuses on the display performance and audio-playback rendering. Read more about how we test this use case here.
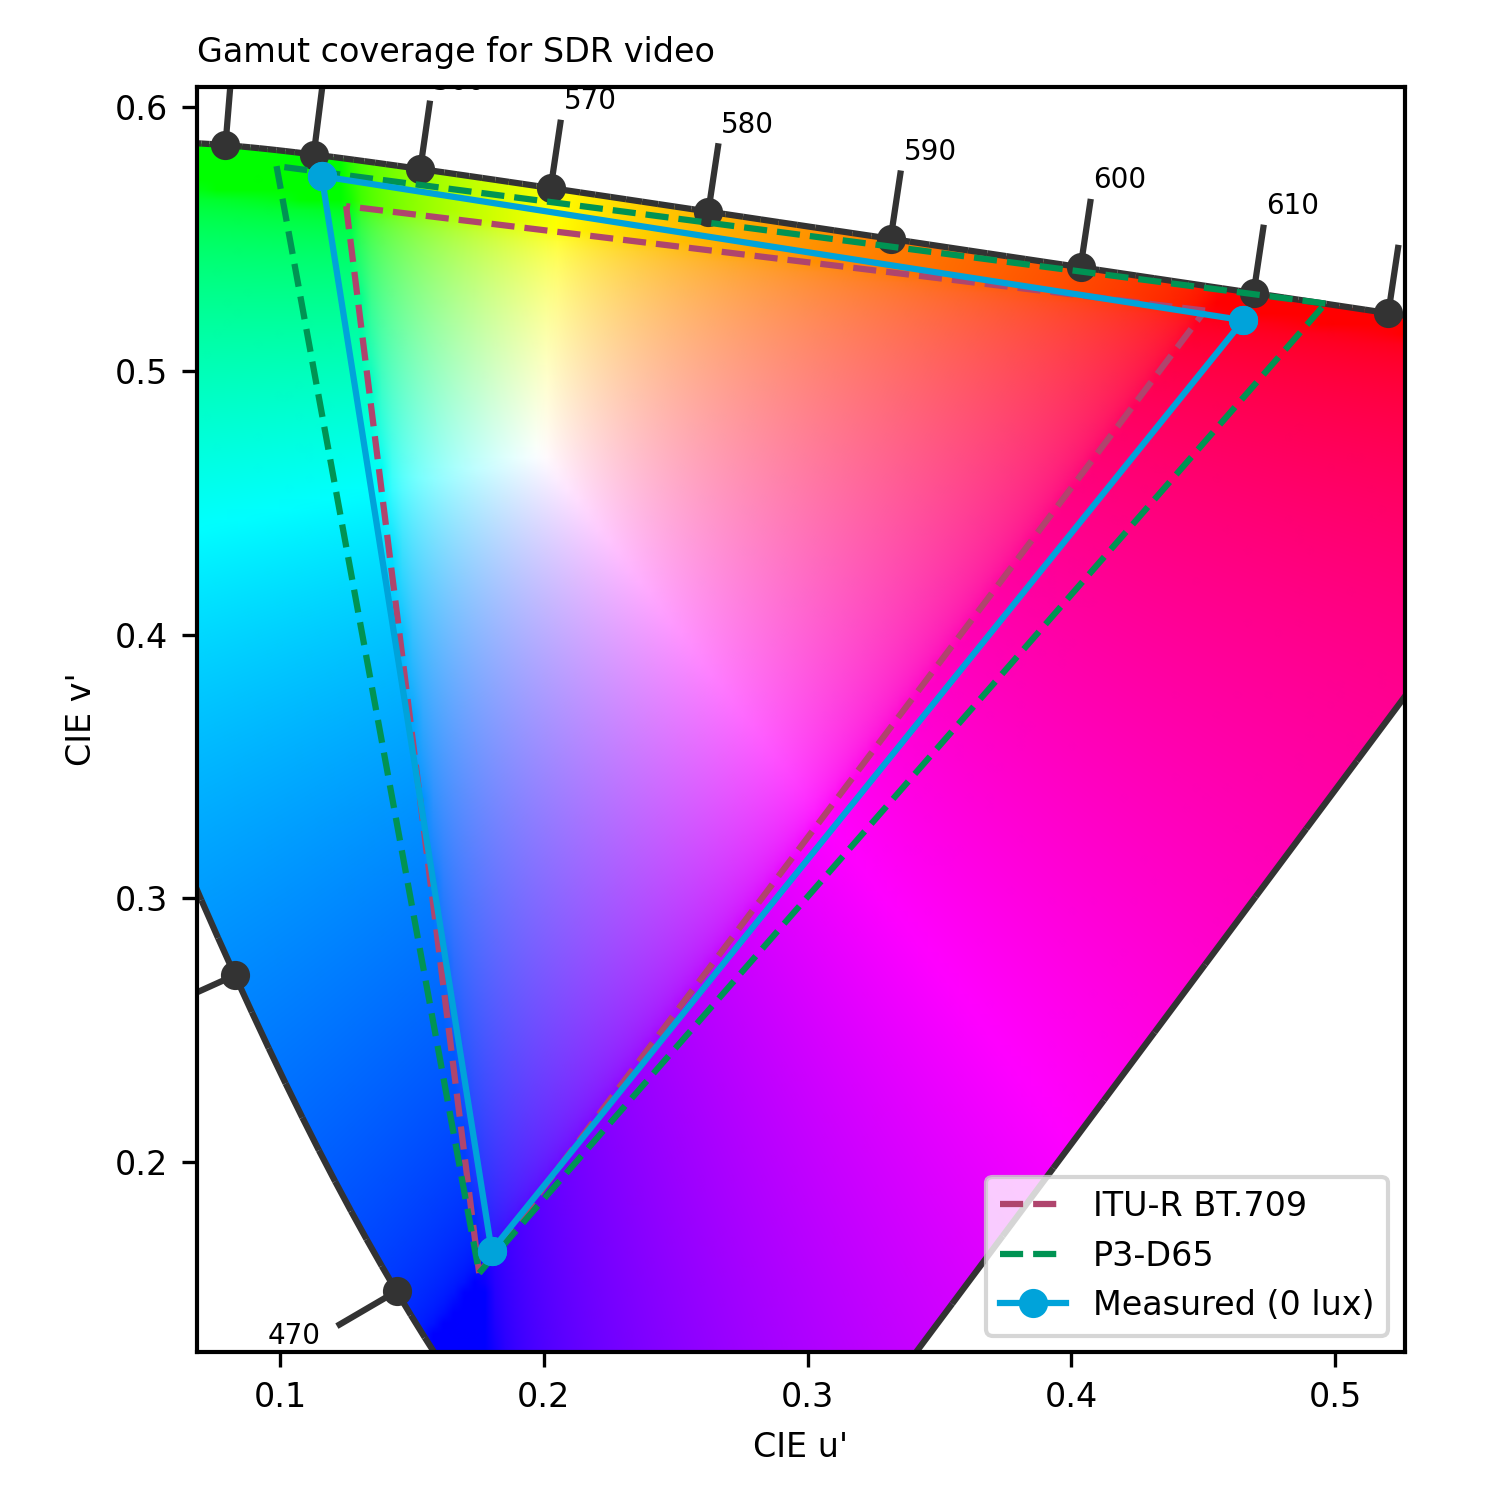
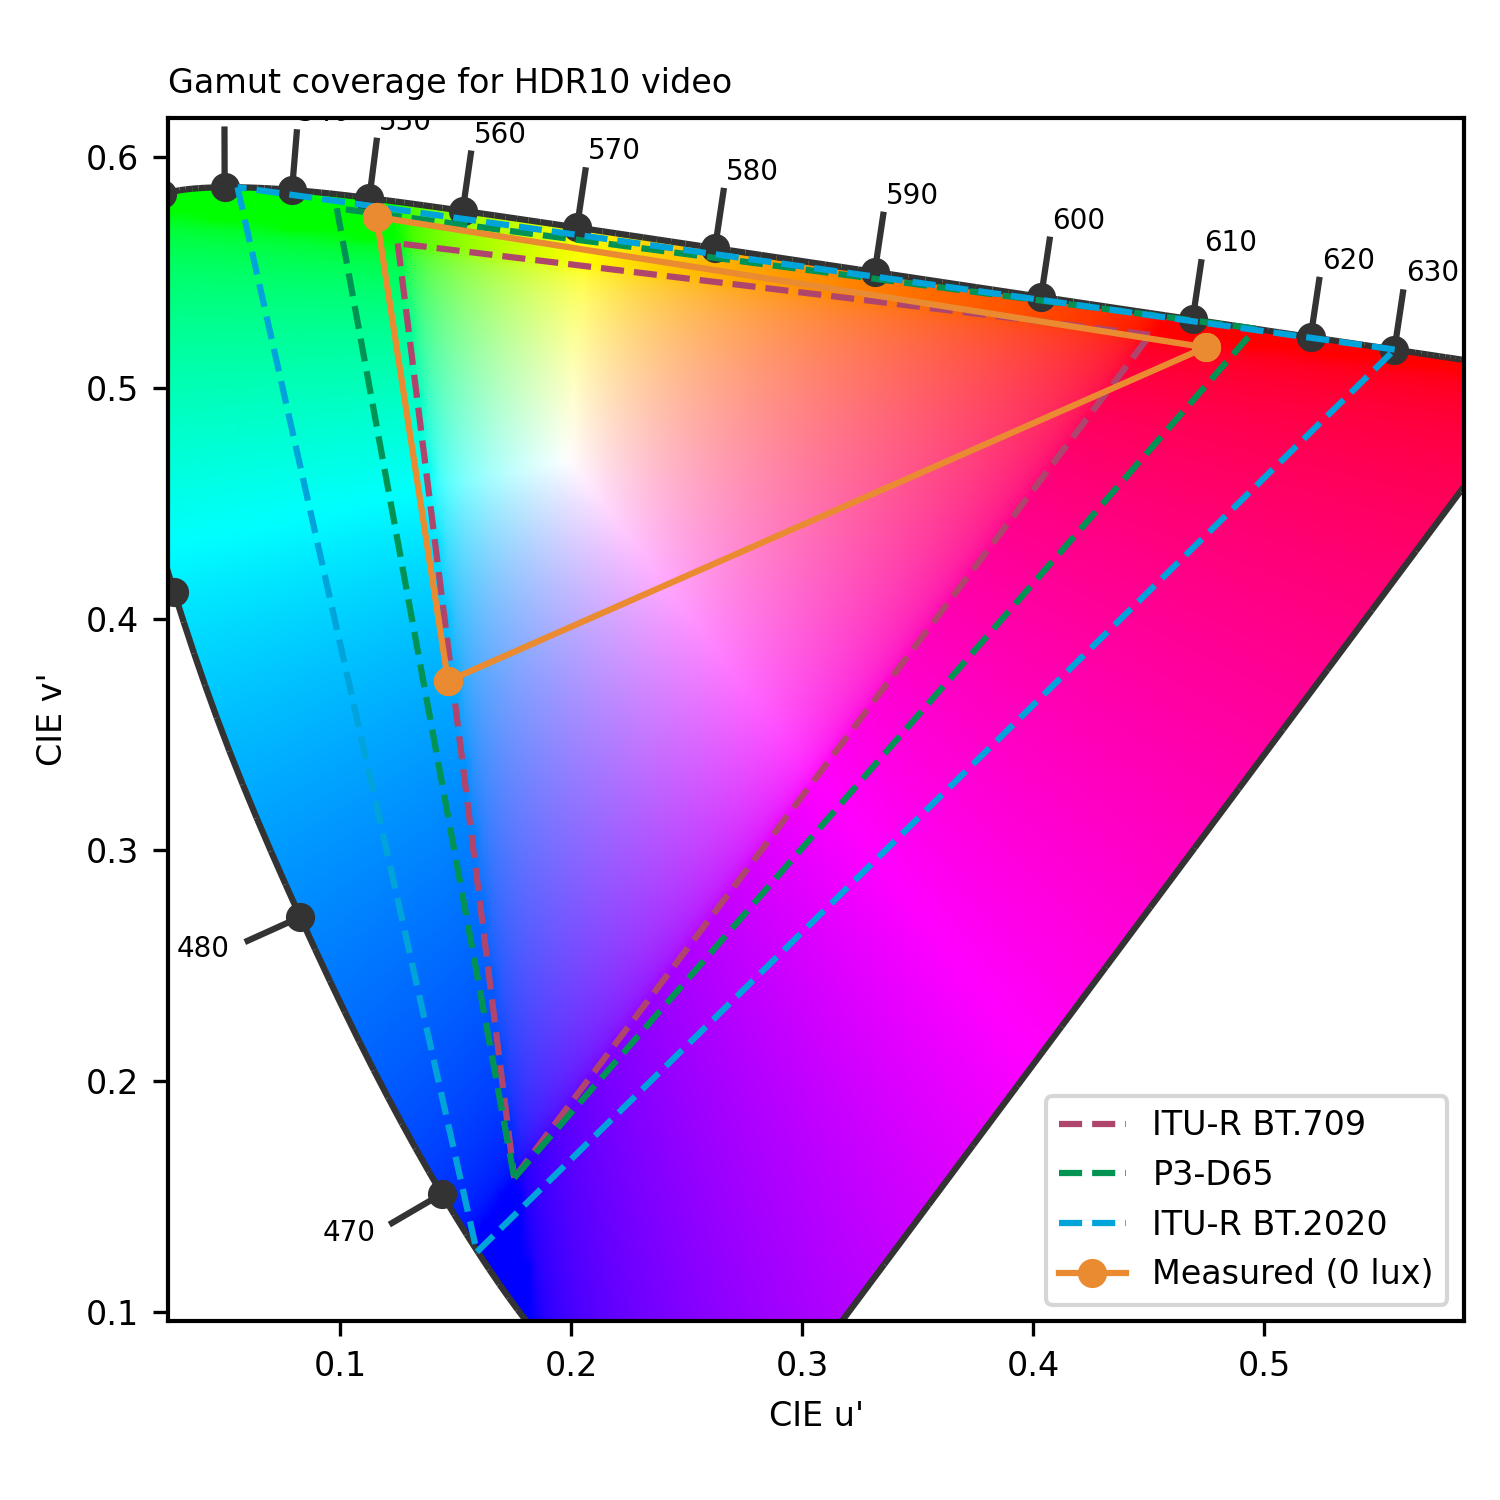
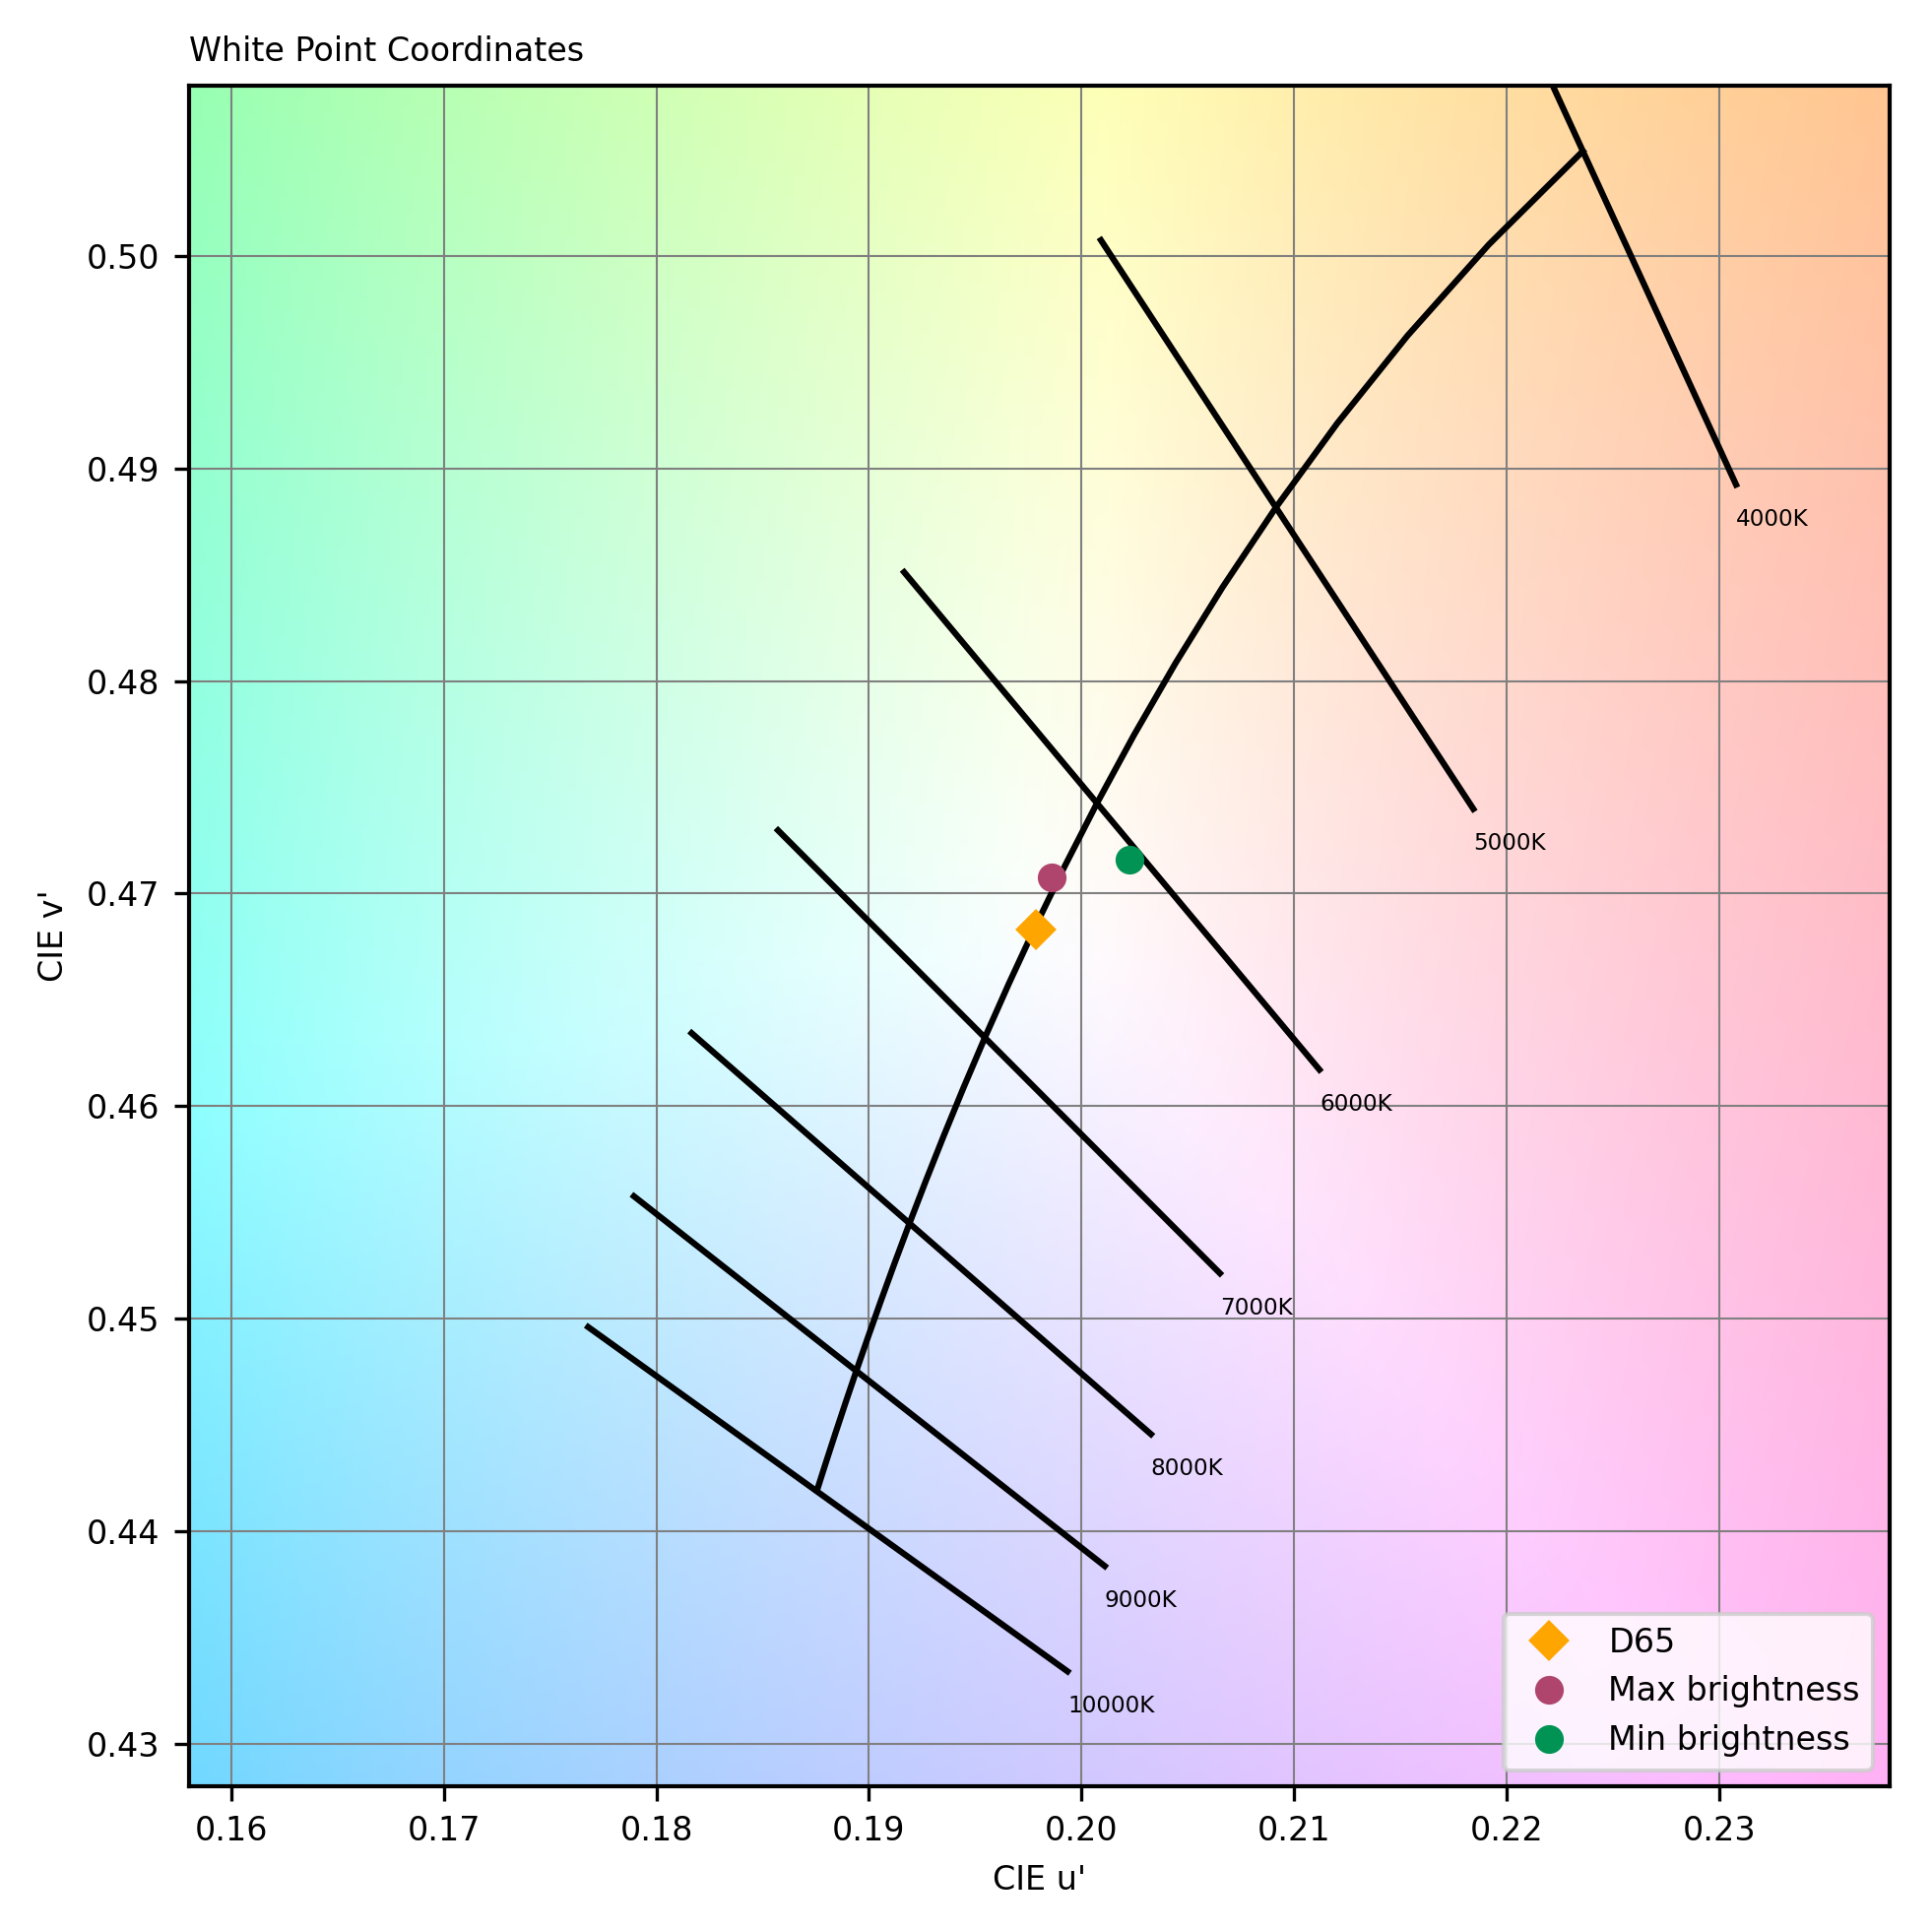
The gamut coverage of SDR content was great and the overall rendering of colors was faithful, but blues appeared desaturated. Contrast was a bit limited due to the panel technology’s inability to render deep blacks. Readability was good overall, but high reflectivity made the device difficult to read in backlit situations. The Surface Pro 9 5G’s audio system offered a similar tonal balance at all volumes, with strong bass and midranges, but the lack of treble and high-end extension made the overall rendering sound quite dark. Spatial performance was good, with immersive wideness and realistic distance rendition. Despite some distortion, the device generally handled artifacts well.
Display
Microsoft Surface Pro 9 5G
156
The following chart presents the display subscores for the multimedia use case:
The following graphs show the objective measurements performed in our display lab:
cd/m²
cd/m²
cd/m²
cd/m²
cd/m²
cd/m²
cd/m²
cd/m²
cd/m²
 Distribution of brightness (min)
cd/m²
cd/m²
cd/m²
cd/m²
cd/m²
cd/m²
cd/m²
cd/m²
cd/m²
Distribution of brightness (max)
Audio
Microsoft Surface Pro 9 5G
152
The following chart presents the playback for the multimedia use case:
The following graphs show the frequency response, distortion and directivity in multimedia playback, recorded in our semi-anechoic room:
DXOMARK encourages its readers to share comments on the articles. To read or post comments, Disqus cookies are required. Change your Cookies Preferences and read more about our Comment Policy.