We put the Microsoft Surface Pro 9 through our rigorous DXOMARK Laptop test suite to measure its performance both at sound, camera and display.
In this review, we will break down how it fared in a variety of tests and several common use cases.
Overview
Key specifications include (as given by the manufacturer):
- Physical specs : 287 x 209 x 9.3, 883g
- Display : 2880×1920, Dynamic 120Hz, Touch, sRGB, Dolby Visio IQ
- Audio : 2W stereo speakers with Dolby Atmos, Dual far field studio microphones
- Webcam : Front-facing camera with 1080p full HD video, 10.0MP rear-facing autofocus camera with 1080p HD and 4k video
Scoring
Use-case and feature subscores included in the calculations of the global score

Microsoft Surface Pro 9
84
95
84
Pros
- In video call, camera providing a high level of details
- In video call, camera delivering an accurate and faithful color rendering
- In video call, excellent signal to noise ratio, leaving out background noise in most situations
- In music & video, good overall readability of the display
- Natural and pleasing tonal balance overall
- Dynamics are well handled with sharp impacts, and impactful punch rendition
- Good handling of loud volumes with no noticeable artifacts
Cons
- In video call, face exposure can be too low in challenging situations such as backlit scenes
- In video call, Duplex / voice overlap situations are not handled correctly, with voices in both direction including strong gating, distortion and compression artifacts
- In music & video, limited contrast of the display, not capable or rendering deep blacks
- High reflectivity of the display leading to difficulties to watch the screen in backlit situations
- Low ends lacking some power in music & video
Like the 5G version, the Microsoft Surface Pro 9 put in a great performance overall in this first batch of tests, with a particularly laudable performance in our video call use case. Despite its lack of HDR display capability, it is nonetheless very suitable for multimedia purposes.
Test summary
About DXOMARK Laptop tests: For scoring and analysis in our laptop reviews, DXOMARK engineers perform a variety of objective tests and undertake more than 20 hours of perceptual evaluations under controlled lab conditions and real-life scenarios.
(For more details about the Laptop protocol, click here.)
The following section gathers key elements of our exhaustive tests and analyses performed in DXOMARK laboratories. Detailed performance evaluations under the form of reports are available upon request. Do not hesitate to contact us.
Video Call
Microsoft Surface Pro 9
144
DXOMARK's Video call use case is a score that evaluates how a device handles video calls and videoconferencing in multiple conditions. This score focuses on the camera performance and the capture and playback rendering of voices. Read more about how we test the use cases of Video call score here.
The Surface Pro 9’s camera shared the top spot for Windows laptops overall with its 5G. It provided a good level of detail; however, face exposure can be too low in challenging backlit scenes, and dynamic range can be limiting. Despite some slight instabilities and color casts, color rendering was accurate and faithful. The device’s audio system produced good timbre in recordings, despite a slight lack of midrange body in tonal balance rendition. Although it controlled noise well, the laptop did not handle duplex situations well, with strong gating, distortion, and compression artifacts when more than one person was speaking.
Camera
Microsoft Surface Pro 9
135
The following chart presents the camera subscores for the video call use case:
The following graphs show the objective measurements performed in our camera labs:
Audio
Microsoft Surface Pro 9
144
The following chart presents the capture subscores for the video call use case:
The following graphs show the frequency response, distortion and directivity in capture, recorded in our semi-anechoic room:
Music & Video
Microsoft Surface Pro 9
154
DXOMARK's Video and Music use case score evaluates the capability of a device to reproduce multimedia usages such as videos, movies and music playback in indoor conditions. This score focuses on the display performance and audio-playback rendering. Read more about how we test this use case here.
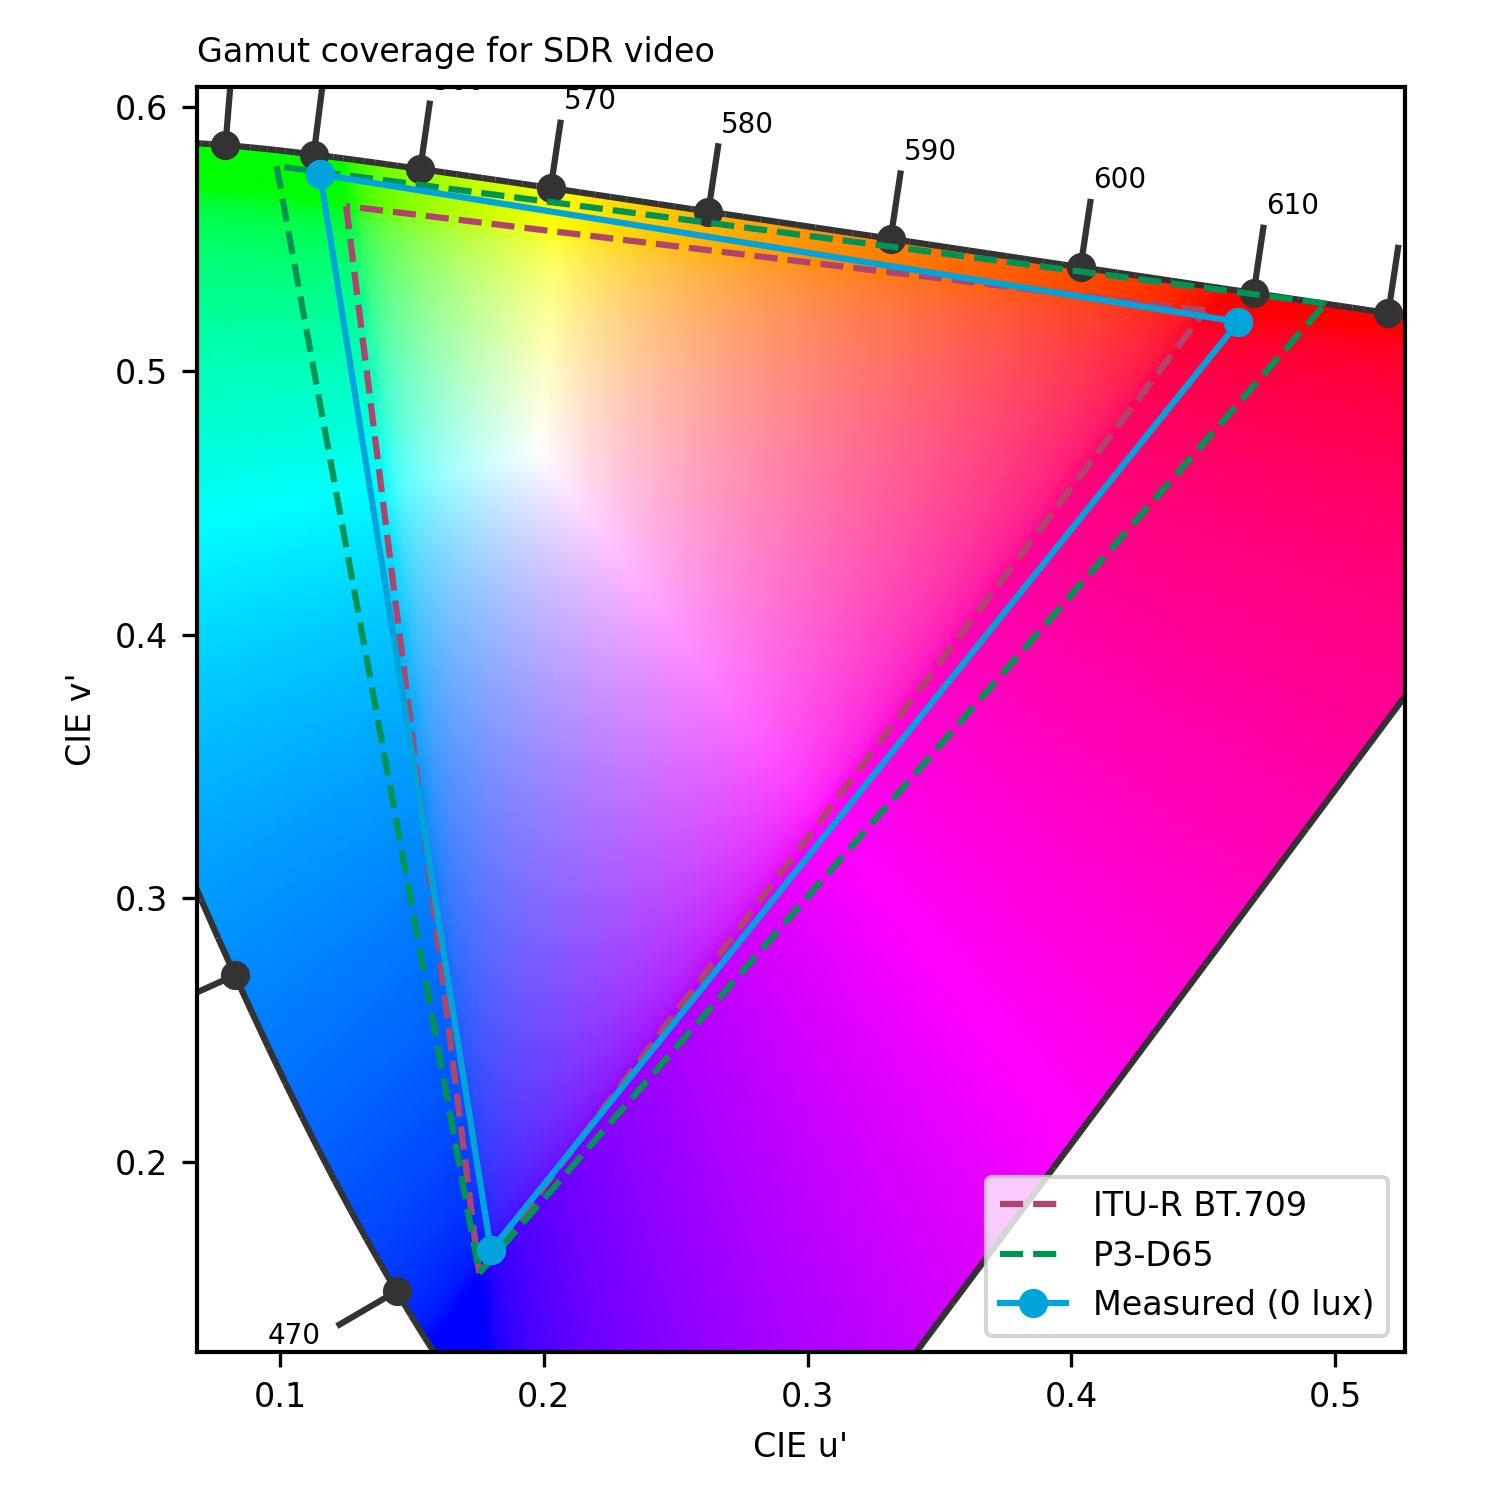
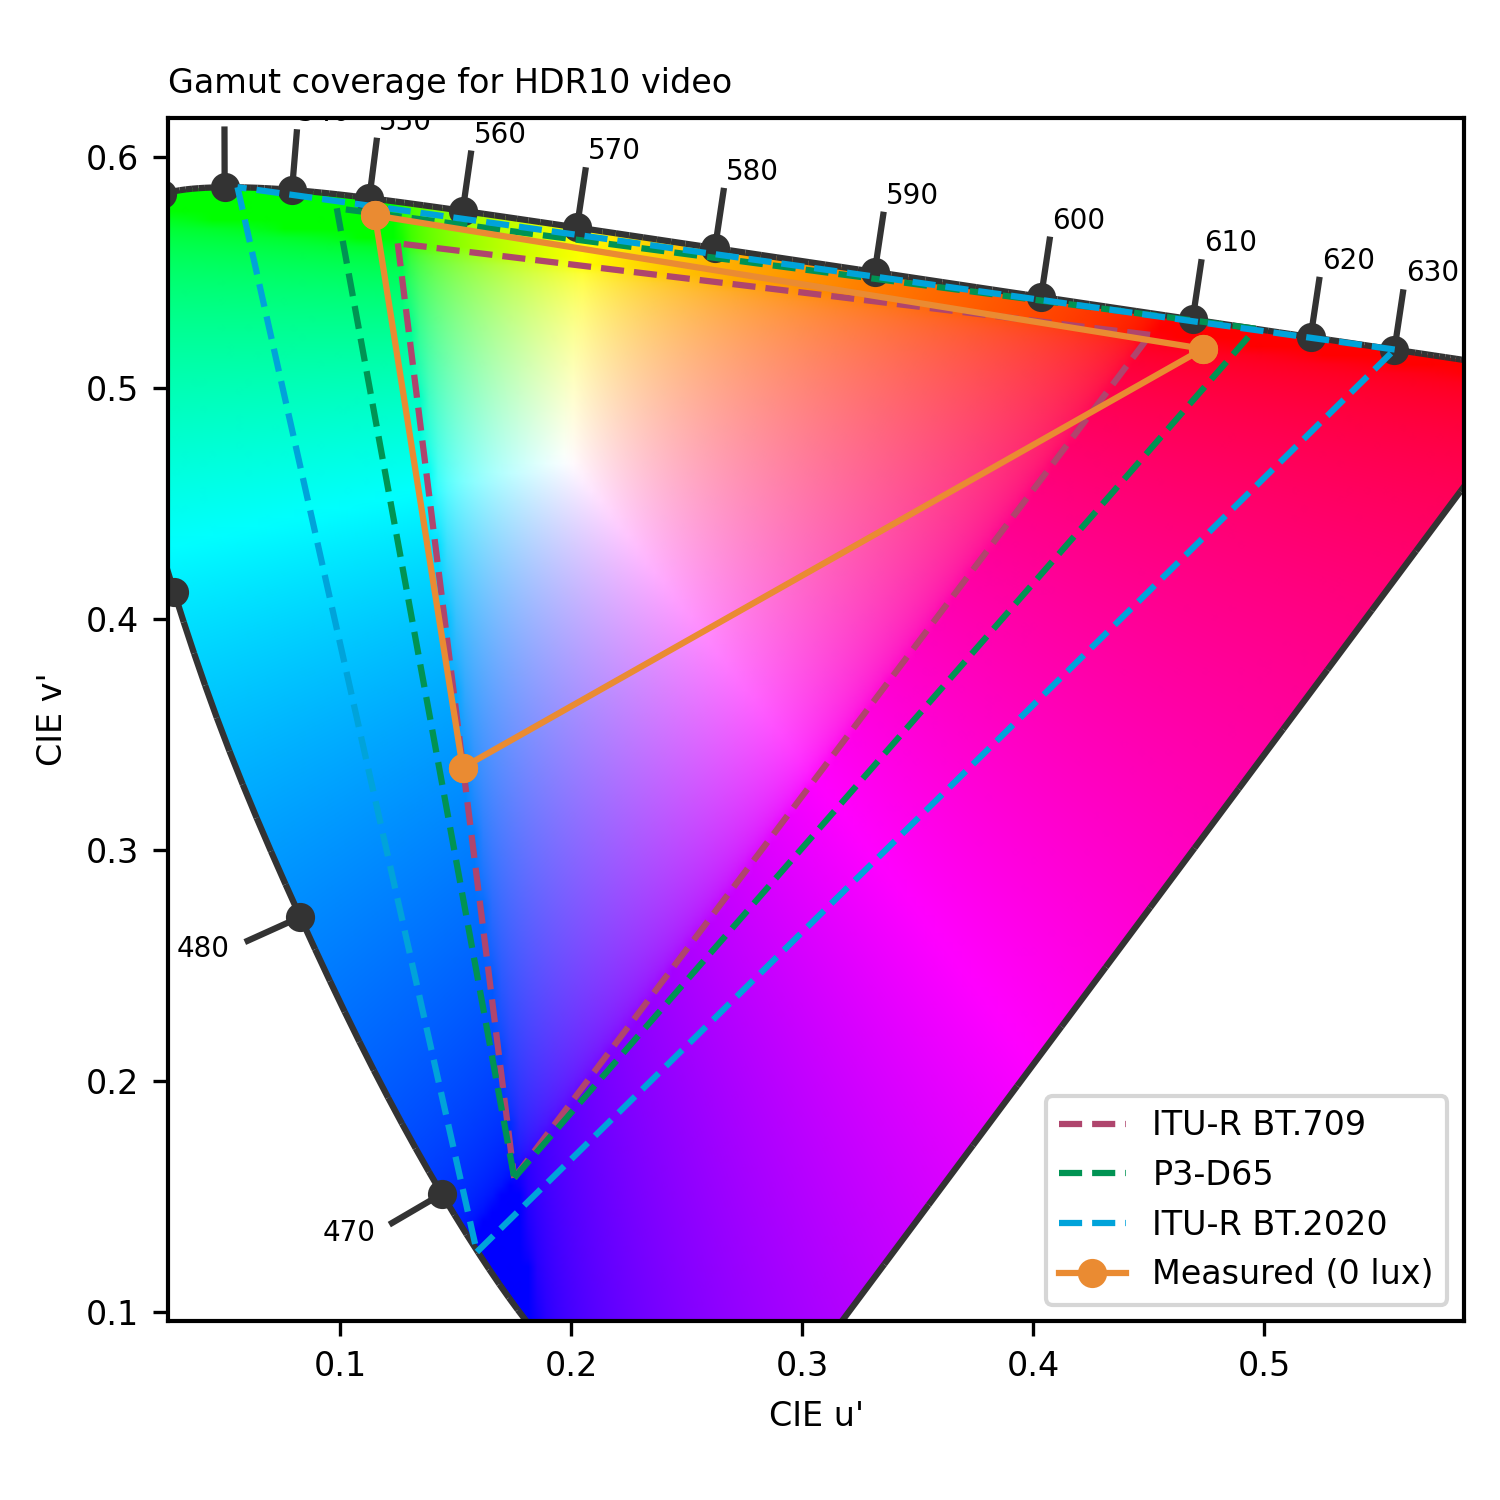
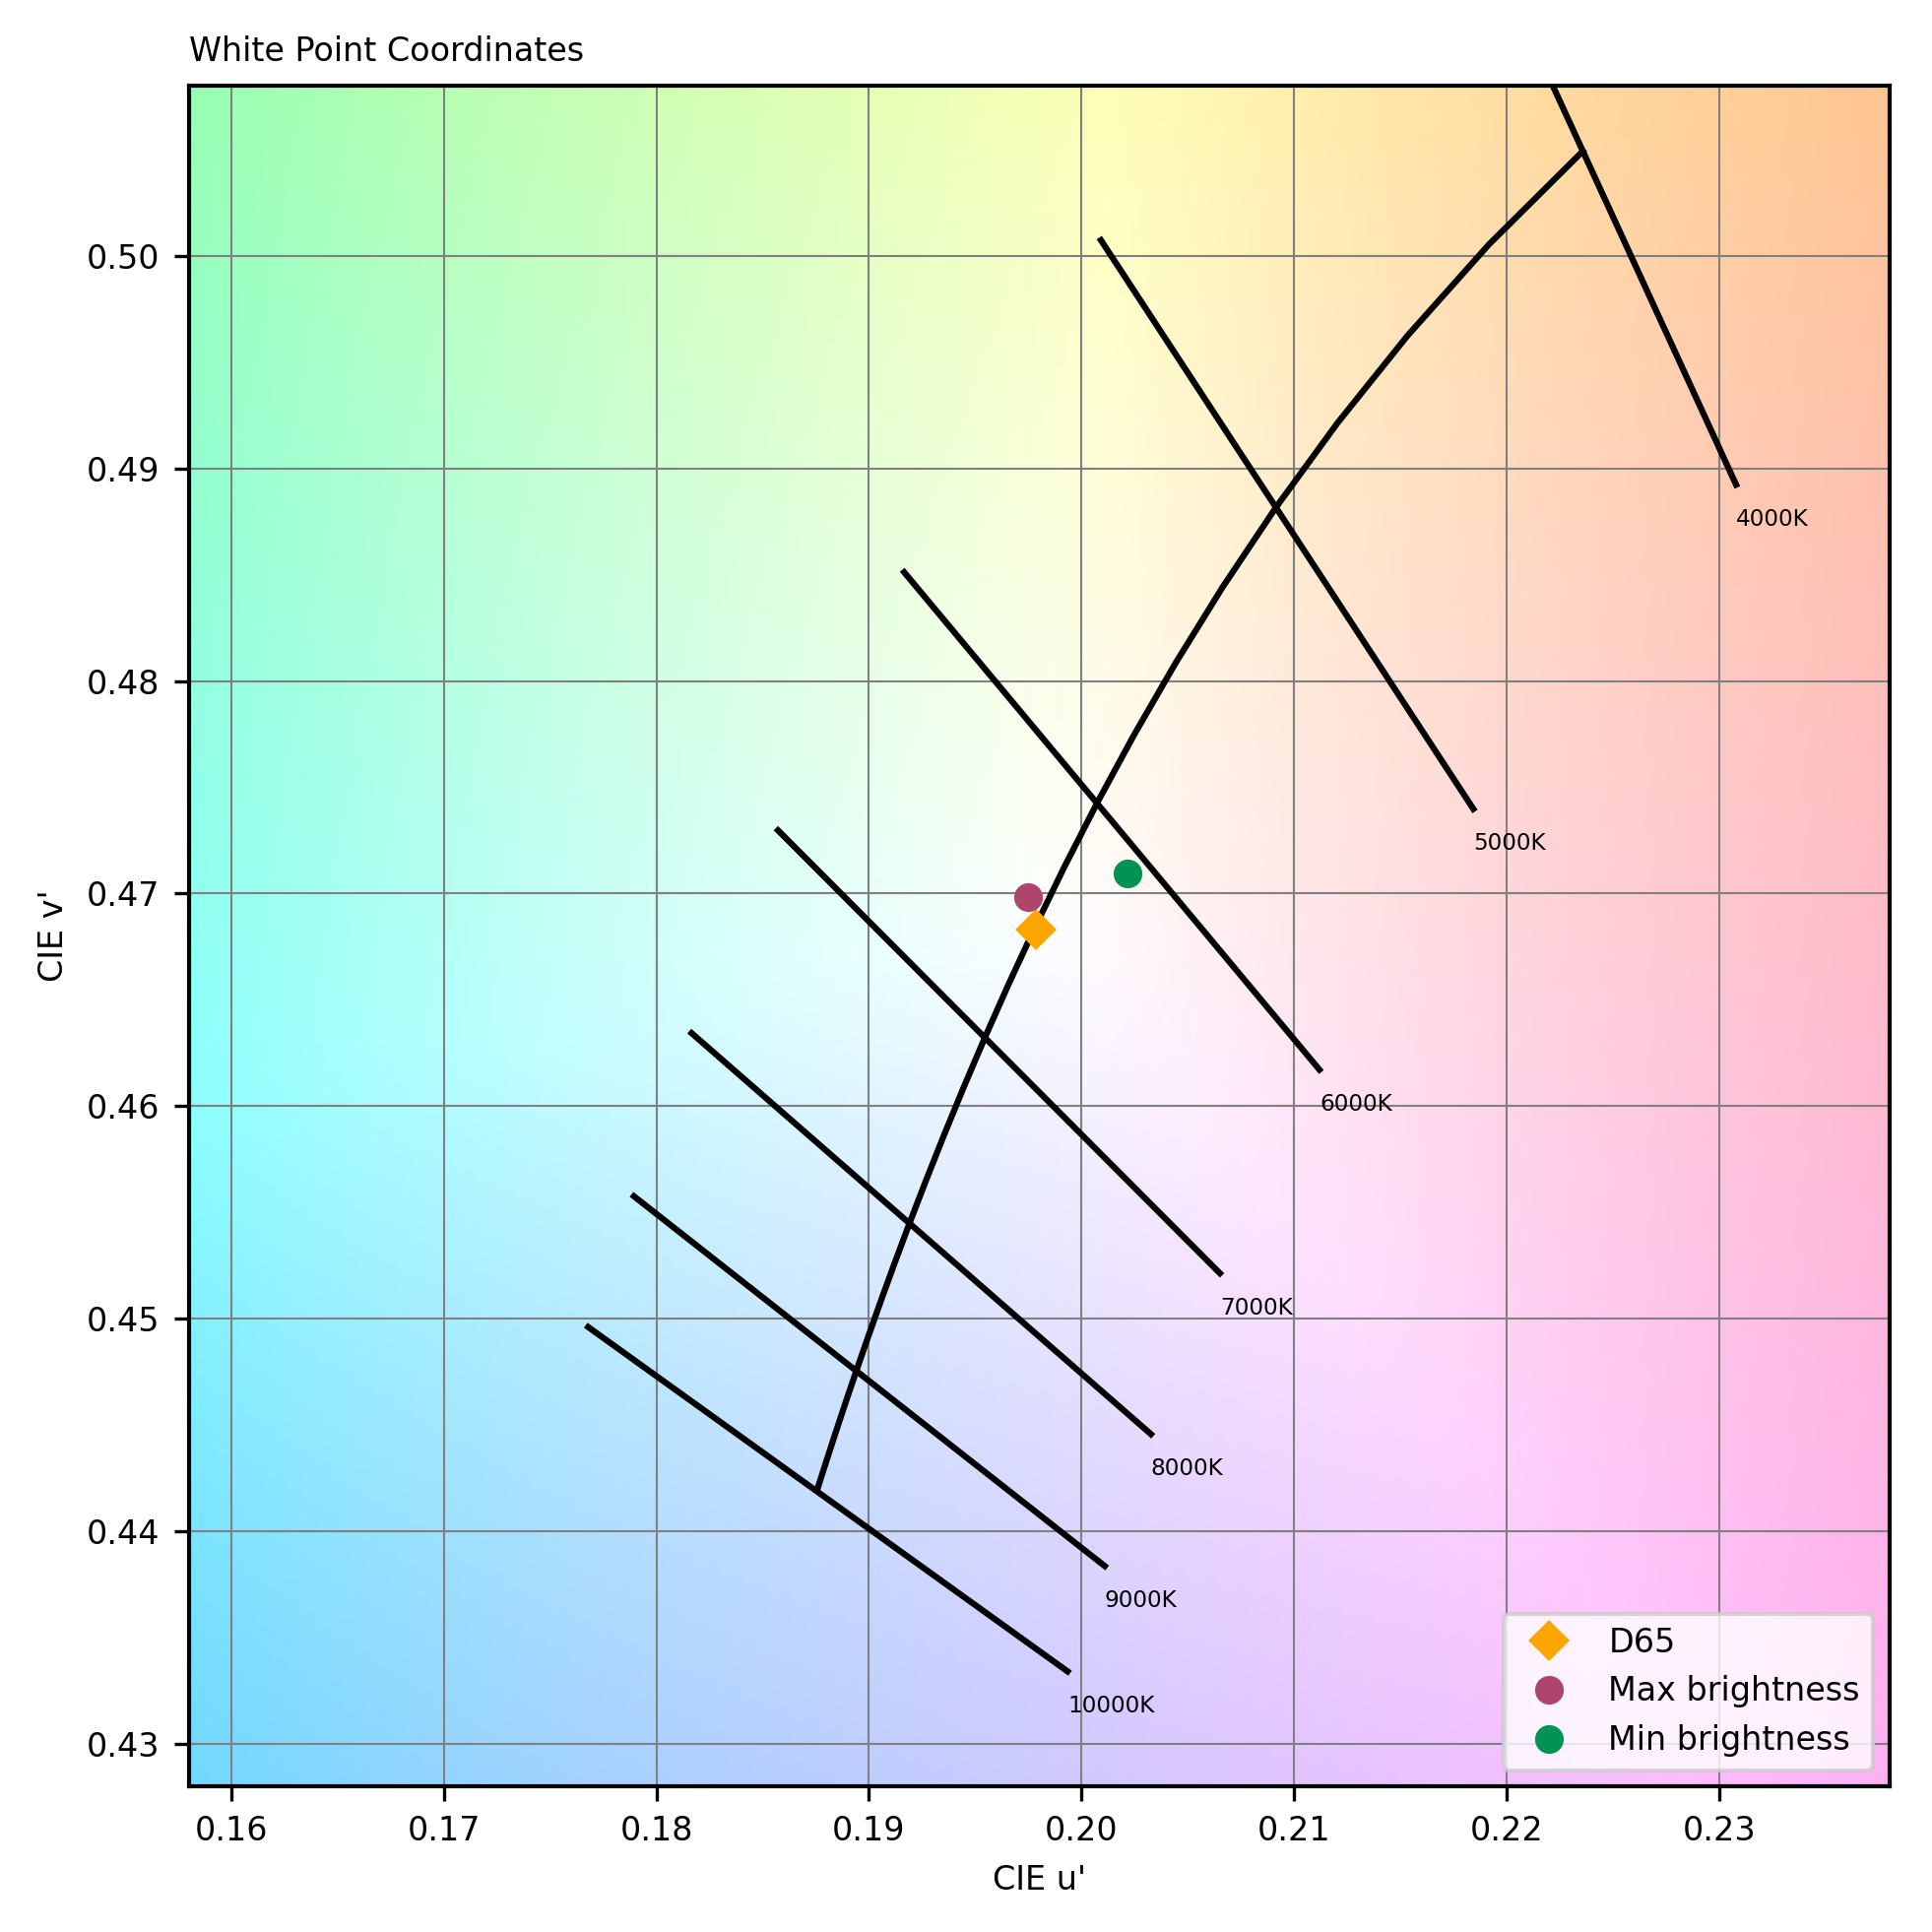
While the gamut coverage of SDR content was great and the overall rendering of colors was faithful, but blues appeared desaturated overall. Display contrast was a bit limited, as the panel technology is not capable of rendering deep blacks. Readability was good overall, with a great brightness range, but reflectivity was quite high, making the device difficult to read in backlit situations. The Surface Pro 9’s audio tonal balance was natural and pleasing overall, but the low end lacked some power compared to best-in-class laptops. The device had satisfying dynamics, and apart from some treble resonances at maximum volume, the device manages loud volumes well, with no other noticeable artifacts.
Display
Microsoft Surface Pro 9
156
The following chart presents the display subscores for the multimedia use case:
The following graphs show the objective measurements performed in our display lab:
cd/m²
cd/m²
cd/m²
cd/m²
cd/m²
cd/m²
cd/m²
cd/m²
cd/m²
 Distribution of brightness (min)
cd/m²
cd/m²
cd/m²
cd/m²
cd/m²
cd/m²
cd/m²
cd/m²
cd/m²
Distribution of brightness (max)
Audio
Microsoft Surface Pro 9
152
The following chart presents the playback for the multimedia use case:
The following graphs show the frequency response, distortion and directivity in multimedia playback, recorded in our semi-anechoic room:
DXOMARK encourages its readers to share comments on the articles. To read or post comments, Disqus cookies are required. Change your Cookies Preferences and read more about our Comment Policy.