Released in March 2021, the Oppo Find X3 Pro is built to compete with flagship smartphones from the leading brands, with a price tag that places it in DXOMARK’s ultra-premium ($800 and up) segment. It’s loaded with the Qualcomm Snapdragon 888 chipset with 12 GB RAM and 256 GB ROM and it has fast 65W SuperVOOC charging.
On the display front, the Find X3 Pro has a 6.7-inch AMOLED QHD+ display with a 120 Hz refresh rate and a “futuristic curved design.” Let’s take a look at how it performed in our exacting Display protocol tests.
Key display specifications:
- 6.7-inch AMOLED screen
- Resolution: 3216 x 1440 pixels (~526 ppi)
- Aspect ratio: 20:9
- Refresh rate: 120 Hz
About DXOMARK Display tests: For scoring and analysis in our smartphone and other display reviews, DXOMARK engineers perform a variety of objective and perceptual tests under controlled lab and real-life conditions. This article highlights the most important results of our testing. Note that we evaluate display attributes using only the device’s built-in display hardware and its still image (gallery) and video apps at their default settings. (For in-depth information about how we evaluate smartphone and other displays, check out our articles, “How DXOMARK tests display quality” and “A closer look at DXOMARK Display testing.”)
Test summary
Scoring
Sub-scores and attributes included in the calculations of the global score.
 Oppo Find X3 Pro
Pros
- Smooth touch, accurate zooming in the gallery app.
- Well-managed lighting transitions.
- Good readability indoors.
Cons
- When playing HDR10 video content, the Find X3 Pro is too dim and needs better color and contrast management.
- Outdoor viewing would be improved with higher luminance.
- Color rendition could benefit from more saturation.
With an overall score of 88 for Display, the Oppo Find X3 Pro ranks among the top 10 devices we’ve tested in our Display protocol thus far, tying with several others (including the Apple iPhone 12 Pro Max and the OnePlus 8 Pro). Across all tested attributes except for artifacts, the X3 Pro outdid its predecessor, the Oppo Find X2 Pro, by considerable margins. Our engineers were particularly impressed with the X3 Pro’s smooth touch and well-adapted readability. They noted, however, that it could be brighter outdoors and that watching HDR10 video content would be much more pleasant if the color and contrast rendering were improved. Let’s take a closer look at some specifics.
Analyses and comparisons
The DXOMARK Display overall score of 88 for the Oppo Find X3 Pro is derived from its scores across six attributes: readability, color, video, motion, touch, and artifacts. In this section, we’ll take a closer look at these display quality sub-scores and explain what they mean for the user, and we will compare the Oppo Find X3 Pro’s performance in several areas against its predecessor, the X2 Pro, and two of its competitors, the OnePlus 8T and the Apple iPhone 12 Pro.

Readability
Oppo Find X3 Pro
69
76
DXOMARK uses the device’s gallery app to show static (still image) content when measuring the device’s display for brightness, contrast, gamma, and blue light impact, etc.
The Oppo Find X3 Pro turned in a strong performance in readability. Our engineers found it to be particularly well-adapted for readability in indoor lighting conditions. Outside, both in the shade and in direct sunlight, the device could benefit from being a little brighter, but content was still legible overall. In changing light conditions, the X3 pro reacts quickly to rising levels of light, but the overall transition takes too long. In falling light, the transition is adequate to human-eye adaptation.
In a low-light environment during daytime, the display is a little bit dazzling (photo below is without blue-light filter). It adapts its brightness according to the time of day, however, and becomes dimmer during the night. With the blue light filter on, the X3 Pro reduces its brightness. (You can find a photo illustration showing blue light filter on further down in the color attribute.)
The comparison charts below show the Oppo Find X3 Pro’s performance vs. the competition at 0 lux (low light) and at 30,000 lux (broad daylight):
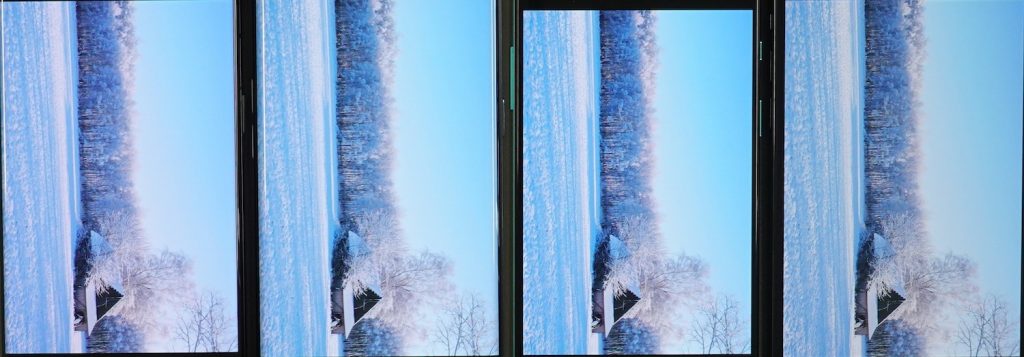
As the following photos illustrate, the Oppo Find X3 Pro retains fairly good readability in bright outdoor conditions, although the color rendering and contrast becomes less natural.

In direct sunlight, illustrated below, the X3 Pro could be a bit brighter. Content is still legible, but less so. The other devices also struggle to perform well in direct sunlight.

Outdoors under sunlight, from left to right: Oppo Find X3 Pro, Oppo Find X2 Pro, OnePlus 8T, and the Apple iPhone 12 Pro.
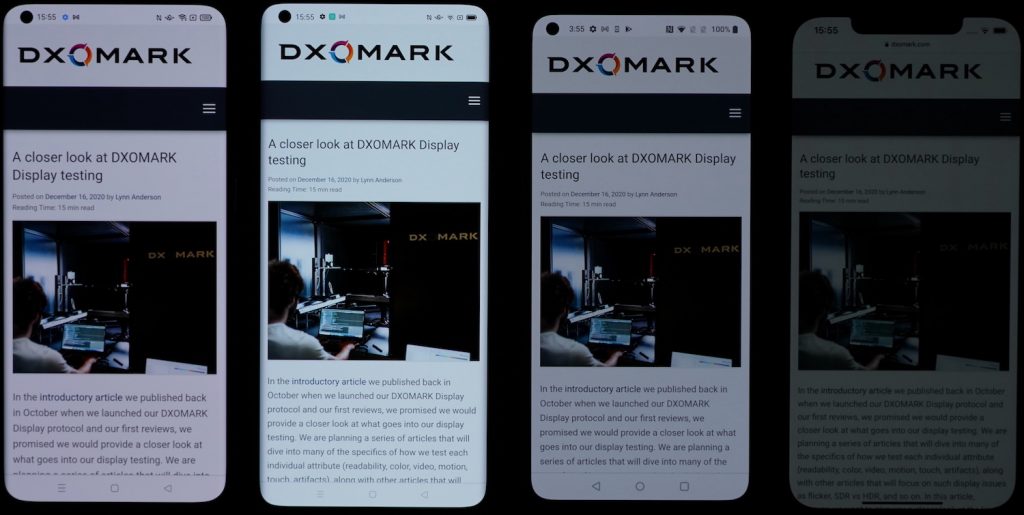
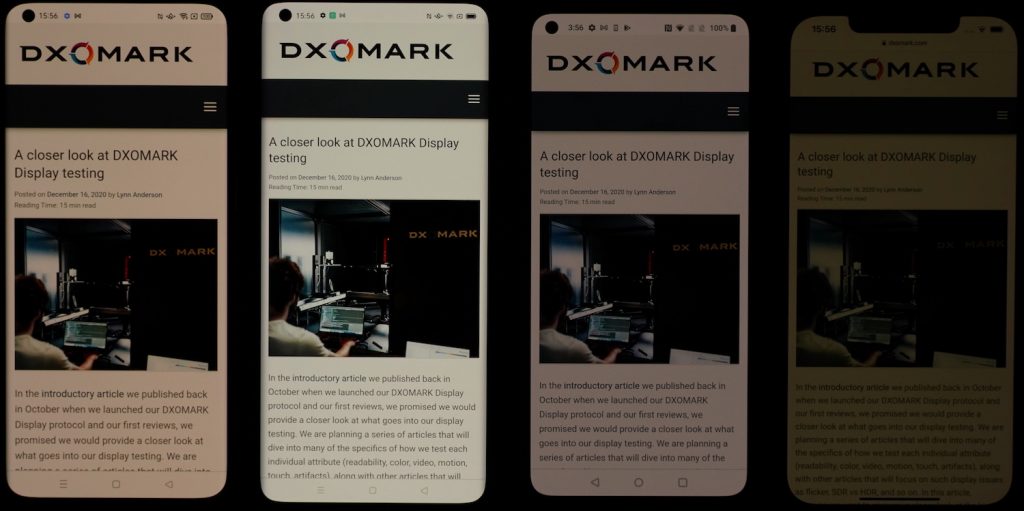
As the array below illustrates, however, the X3 Pro’s readability indoors is very good, and measures up well with its predecessor and the other two devices.

Indoors, from left to right: Oppo Find X3 Pro, Oppo Find X2 Pro, OnePlus 8T, and the Apple iPhone 12 Pro.
When held at an angle, the Oppo Find X3 Pro doesn’t perform quite as well as its brand sibling and the OnePlus 8T, but it does similarly well as the iPhone 12 Pro, as shown in our chart of objective test results:
Our perceptual tests for brightness vs angle confirm the objective test results, as you can see the illustrative photo array below. The Find X3 is slightly darker than the X2, but it remains readable at a 45° angle:

Indoor brightness at 45°, from left to right: Oppo Find X3 Pro, Oppo Find X2 Pro, OnePlus 8T, and the Apple iPhone 12 Pro.
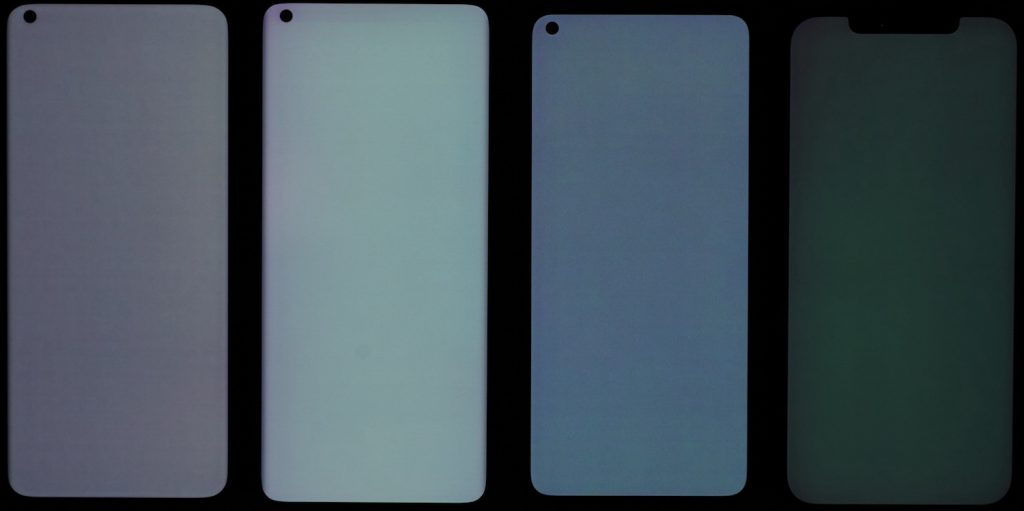
When it comes to brightness uniformity, the Oppo Find X3 Pro far outpaces the Find X2, as you can see in the illustration below. That said, the X3 Pro is slightly brighter on the right-hand side of the display.
Brightness uniformity, from left to right: Oppo Find X3 Pro, Oppo Find X2 Pro, OnePlus 8T, and the Apple iPhone 12 Pro.

Color
Oppo Find X3 Pro
84
92
DXOMARK uses the device’s gallery app to show static (still image) content when measuring the device’s display for white point, gamut, uniformity, color fidelity, and blue light filter impact, etc.
The Oppo Find X3 Pro did quite well in the color attribute, notching a score that puts it in good company in our database rankings. Overall, our engineers found that the Find X3 Pro was faithful to the content it was displaying, and fairly accurate, though colors tend to be somewhat desaturated across use cases.
In the illustrative photo array below, the petals of the sunflower are slightly paler and less saturated than the renderings from the other devices.
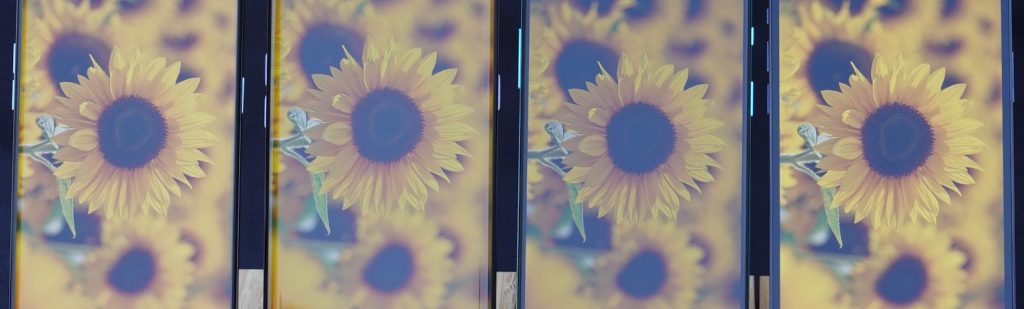
Color in outdoor shade, from left to right: Oppo Find X3 Pro, Oppo Find X2 Pro, OnePlus 8T, and the Apple iPhone 12 Pro.
Under sunlight, the Oppo Find X3 Pro loses some accuracy and is even less saturated, though you can see the other devices also suffer under this situation in this illustrative photo array:
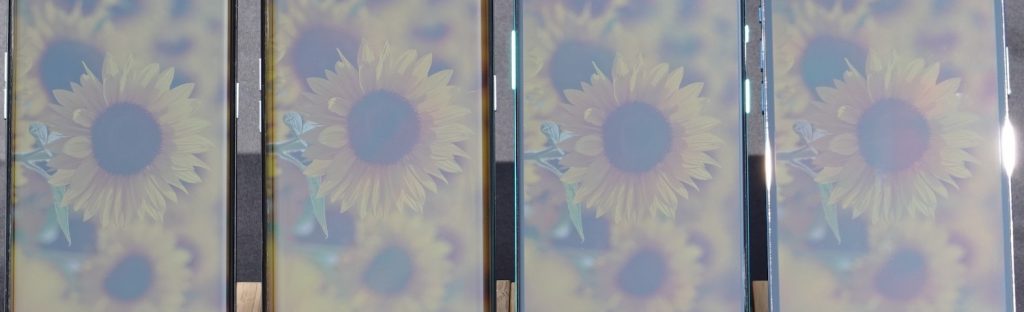
Color under sunlight, from left to right: Oppo Find X3 Pro, Oppo Find X2 Pro, OnePlus 8T, and the Apple iPhone 12 Pro.
As for color fidelity, the charts below show the measured color faithfulness of the Oppo Find X3 Pro compared to the target under 1000 lux lighting in both the sRGB (standard) color space (left) and the broader DCI-P3 color space (right). The center of each circle is the target color; anything outside the circle represents a noticeable color difference. The further the tip of the arrow is outside of the circle, the more a user will notice the difference between the color on the display and color of the real object or chart next to it. As you can see, the Oppo Find X3 Pro shows correct color fidelity in both spaces, with some slight shifts off target.


White (color) vs angle
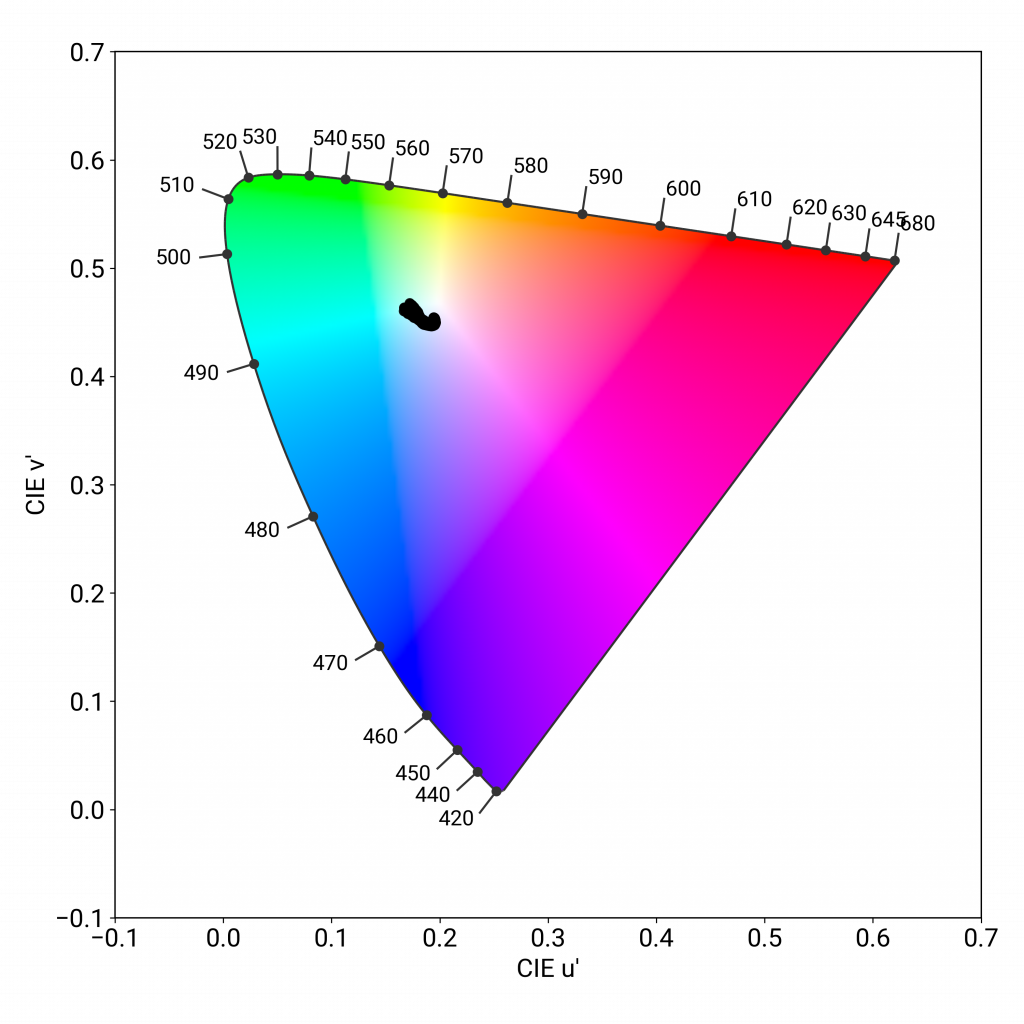
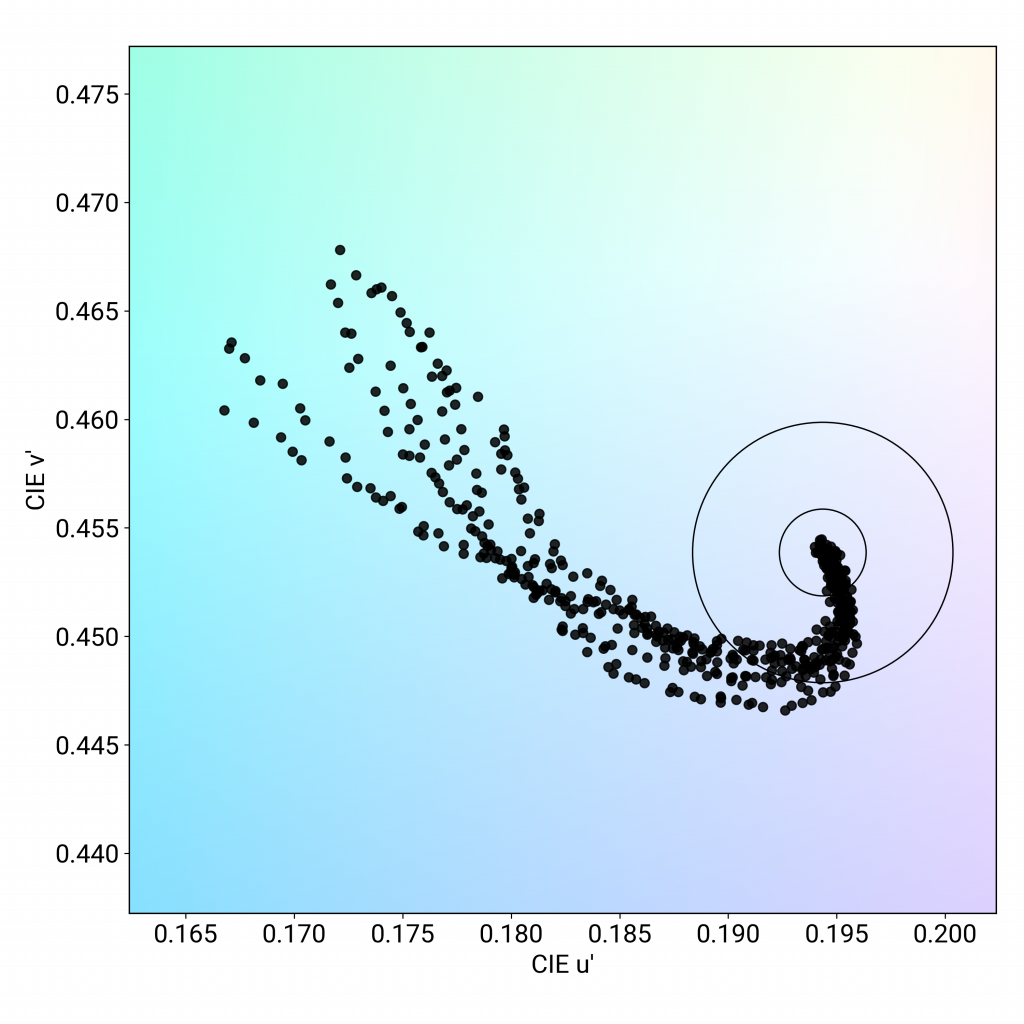
Holding a smartphone at an angle can affect display color rendering. The left-hand chart below shows the Oppo Find X3 Pro’s color tendencies when held at an angle; in the right-hand chart (a closeup of the chart on the left), each dot represents a measurement taken at a discrete angle and distance from the device; dots inside the inner circle exhibit no color shift in angle; those between the inner and outer circle have shifts that are just noticeable by trained eyes; but those falling outside the outer circle are easily noticeable. You can see that as the Find X3 Pro tilts, it shifts toward green and blue as the angle becomes more acute.
The photos below of our perceptual tests back up the objective measurements. The array of photo illustrations below shows shots on axis (that is, perpendicular to the viewer).
Indoor color on axis, from left to right: Oppo Find X3 Pro, Oppo Find X2 Pro, OnePlus 8T, and the Apple iPhone 12 Pro.
Viewed at an angle, the Oppo Find X3 Pro shifts towards blue or green as the angle increases, and the loss of saturation is visible.

Indoor color at 45°, from left to right: Oppo Find X3 Pro, Oppo Find X2 Pro, OnePlus 8T, and the Apple iPhone 12 Pro.
The Oppo Find X3 Pro has some minor color non-uniformities, as shown in the photo illustration below, but it is a dramatic improvement over the X2 Pro next to it:
Color uniformity, from left to right: Oppo Find X3 Pro, Oppo Find X2 Pro, OnePlus 8T, and the Apple iPhone 12 Pro.
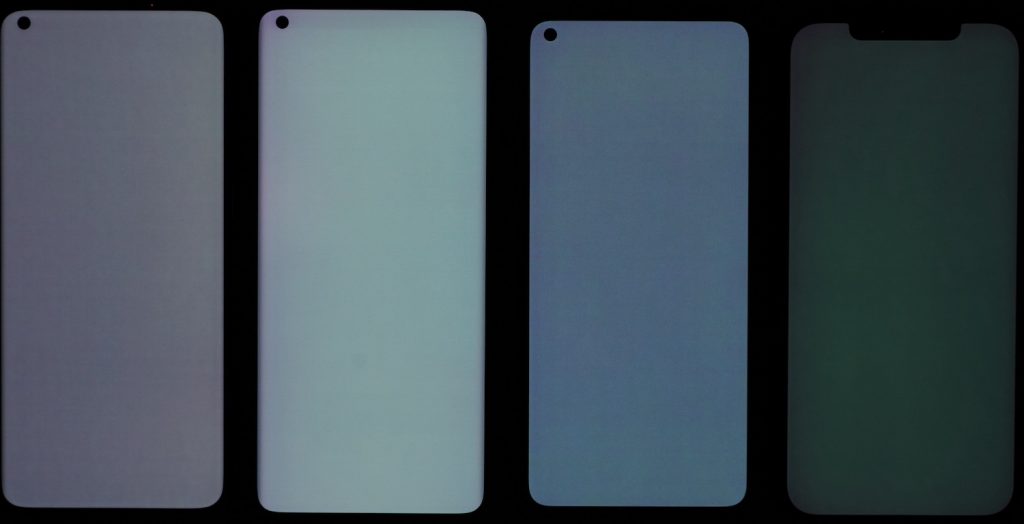
With the blue light filter (BLF) on, the Find X3 Pro displays a strong orange cast, but our engineers note that the filter is quite efficient at reducing the blue light. Its brand sibling to the right shows less color shift, but the filter is not as effective.
Color shift with BLF on, from left to right: Oppo Find X3 Pro, Oppo Find X2 Pro, OnePlus 8T, and the Apple iPhone 12 Pro.

Video
Oppo Find X3 Pro
58
91
DXOMARK uses the device’s video (or browser) app to show dynamic content when measuring the device’s display for brightness, contrast, gamma, and color.
The overall score in video for the Oppo Find X3 Pro is a little below average, and somewhat surprising, considering how well it performed in other regards. Our engineers noted that when playing HDR10 content, the X3 Pro lacks brightness, but the larger issues are in contrast and color. These issues can be seen in play in the photo illustrations below. In this first one, you can see the lack of brightness, the loss of detail in dark areas, and the reddish skin tones. You can see that the iPhone 12 Pro manages the scene more adeptly, despite the yellow cast.

Video brightness, from left to right: Oppo Find X3 Pro, Oppo Find X2 Pro, OnePlus 8T, and the Apple iPhone 12 Pro.
In this photo illustration (of glass being melted) the issues with contrast are evident. There’s a big loss of detail in the dark areas:
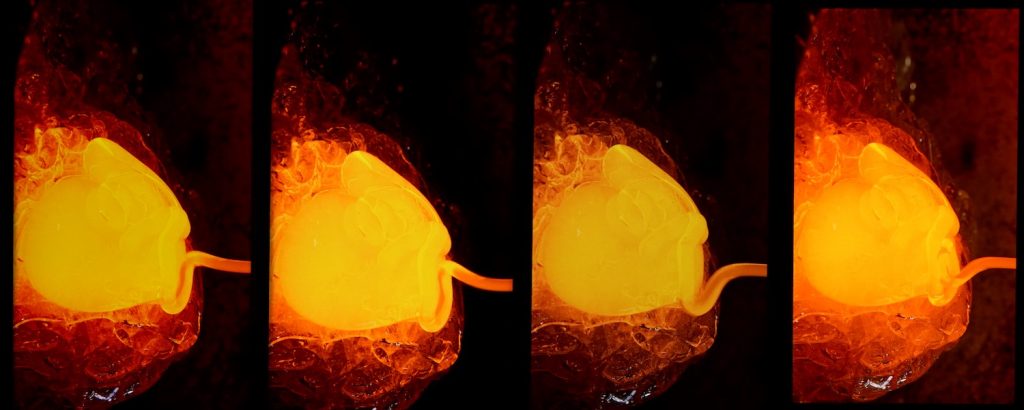
Video contrast, from left to right: Oppo Find X3 Pro, Oppo Find X2 Pro, OnePlus 8T, and the Apple iPhone 12 Pro.

Motion
Oppo Find X3 Pro
83
87

Touch
Oppo Find X3 Pro
77
85
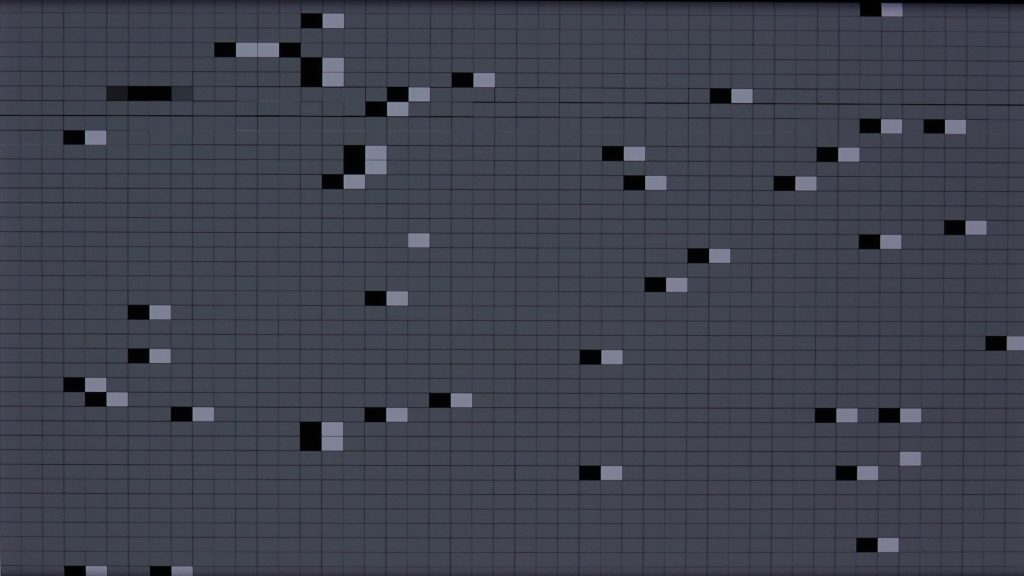
The Oppo Find X3 Pro did quite well in the motion attribute, showing only a few stutters at 30 fps, though it had many frame drops at 60 fps. Our engineers noted no visible frame drops when playing games. The Find X3 Pro does fairly well with motion blur, too, with no frame duplication. When resuming video play, there is a noticeable pause before it starts playing again.
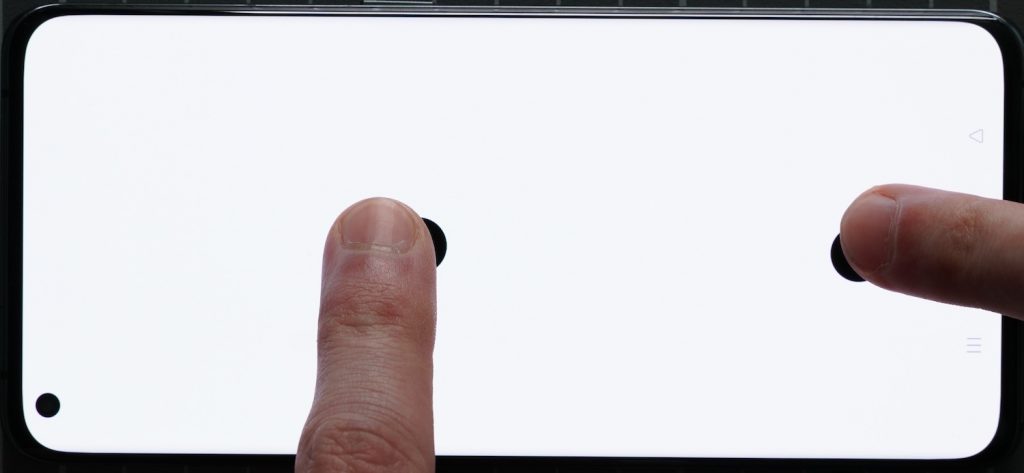
Touch is one of the strongest attributes of the Oppo Find X3 Pro. It was very smooth and pleasant to use when browsing in the gallery app and when web browsing. It was very accurate when zooming in the gallery app, although the zoom is capped. When gaming, the device was responsive in all but the bottom corners. Overall, the accuracy made using the device enjoyable.

Artifacts
Oppo Find X3 Pro
81
86
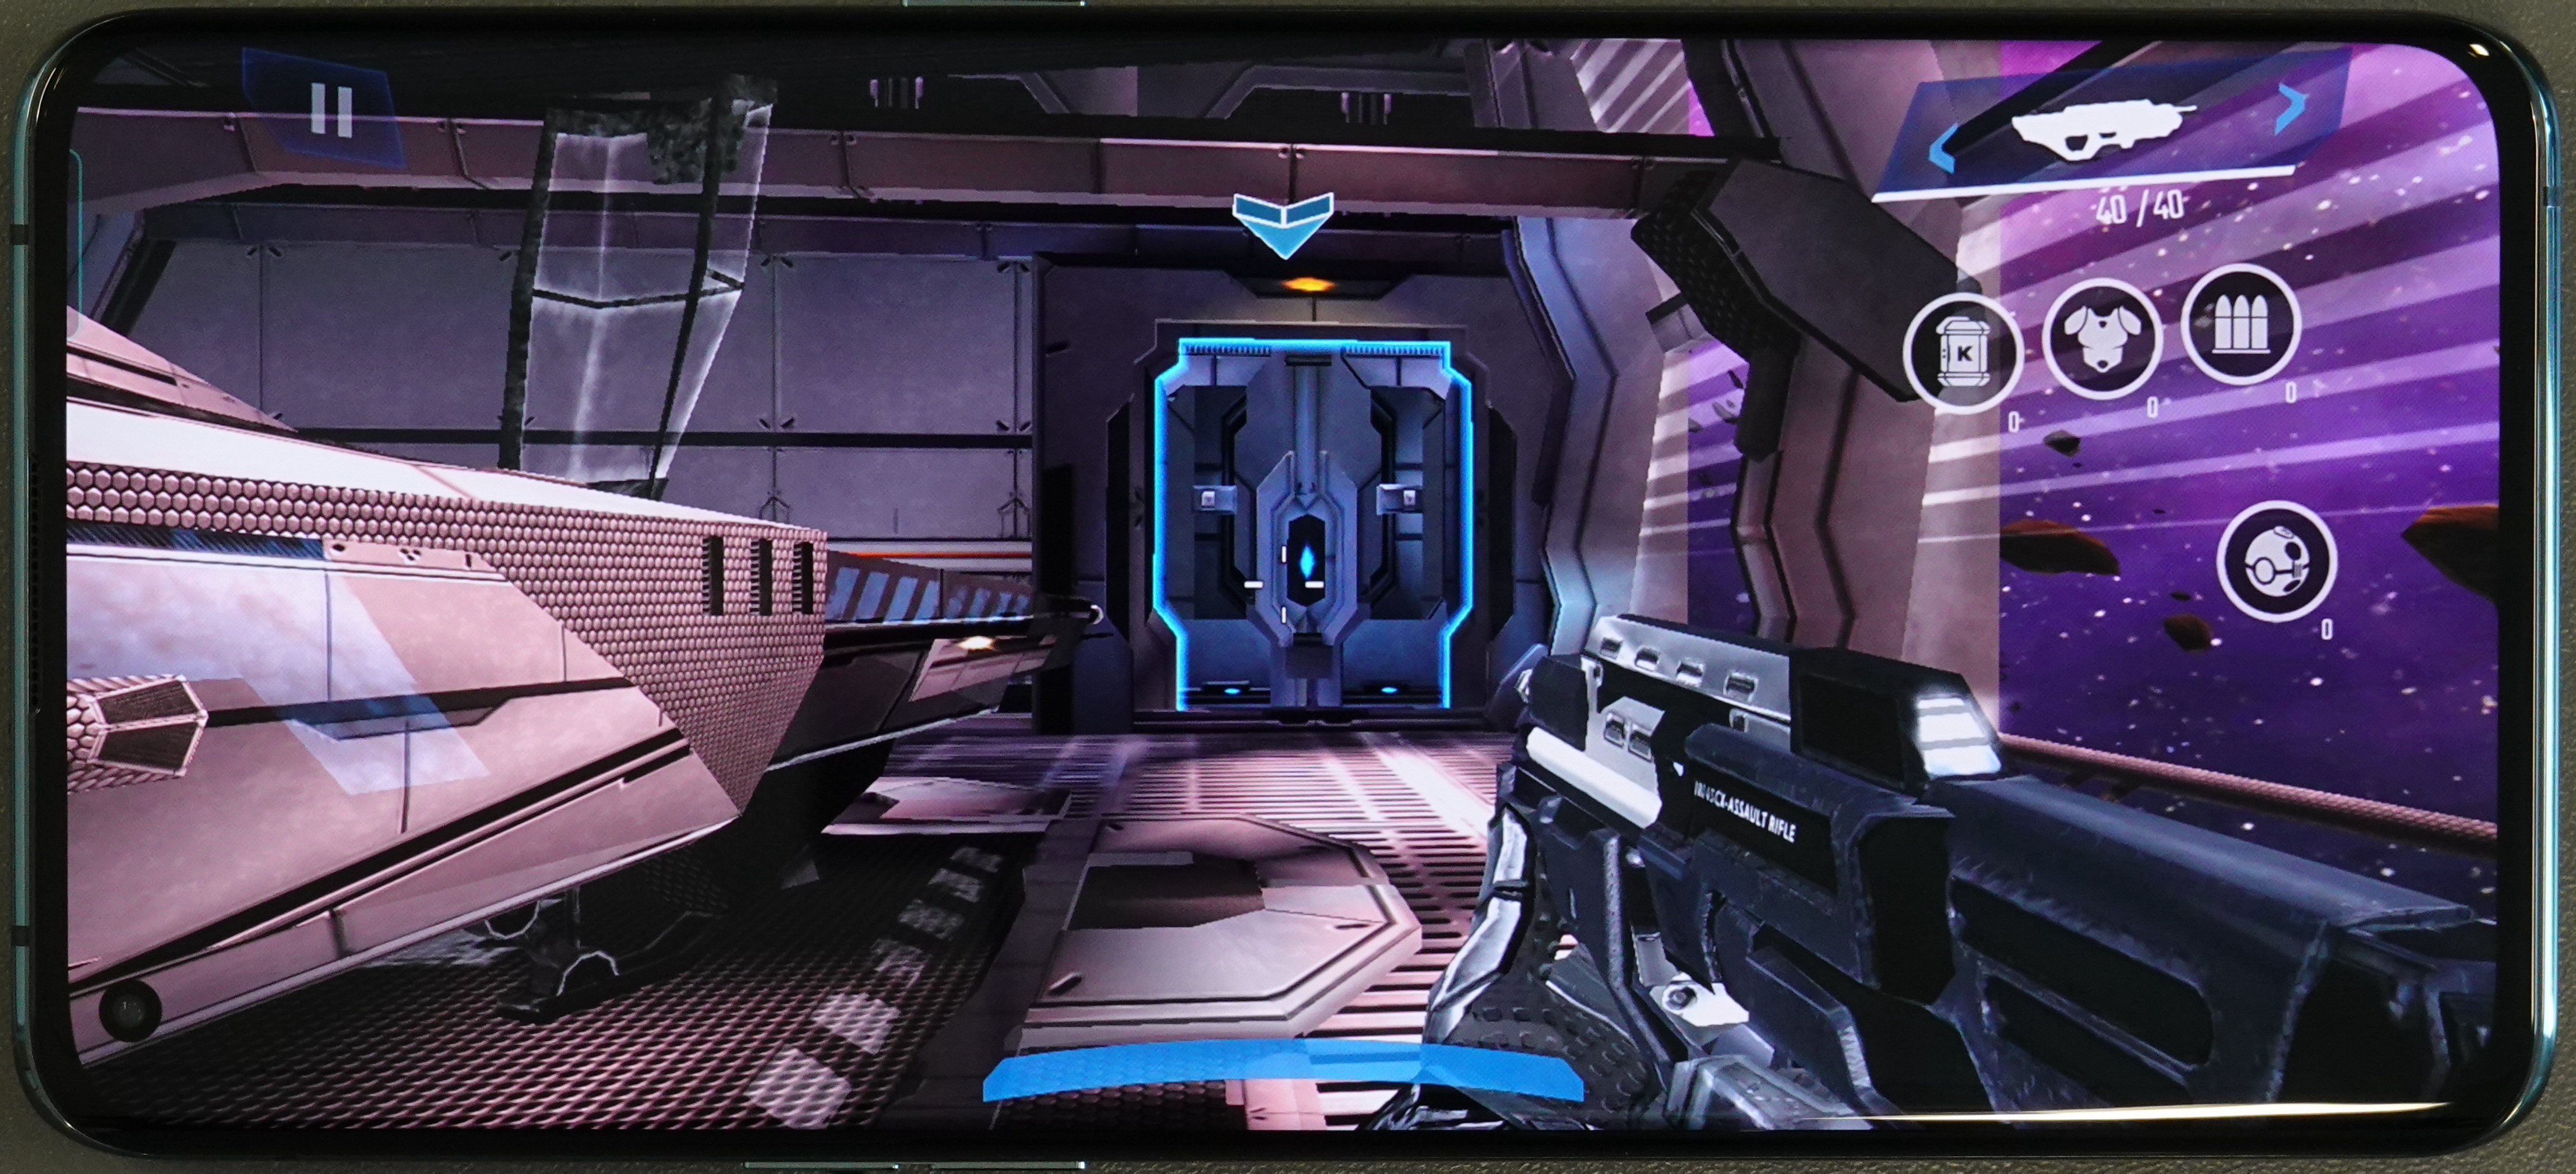
The Oppo Find X3 Pro did fairly well in the artifacts attribute. The notch for the selfie camera is small and in the upper left-hand corner of the display; this can be a factor in things like gaming and other full-screen activities. The device does show some ghost touches, and it shows slight judder at 24 fps. No judder was visible at 30 or 60 fps. Regarding flicker, as you can see in the chart below, the frequency is lower than its predecessor’s, which makes it more noticeable to the human eye.
Some slight aliasing is noticeable on curved and other edges, but it is not disturbing. If you take a look at the zoomed-in portion here you can see the pixelation along the top edge of the gaming gun.

Conclusion
The Oppo Find X3 Pro measures up well against the competition for the most part, scoring well in readability (which is ultimately the most important measure of utility for a smartphone display) but also earning praise for its smooth touch, which made the experience of using it a pleasure. Lighting transitions were well managed overall, and the device does a good job of adapting to the color space of visual content, thus increasing fidelity.
On the downside, it could be a bit brighter when used outside and in direct sunlight. And the Find X3 Pro has some shortcomings when it comes to video playback with HDR10 content. It’s not bright enough, and there are problems with the management of contrast and color that do affect the viewing experience.
DXOMARK encourages its readers to share comments on the articles. To read or post comments, Disqus cookies are required. Change your Cookies Preferences and read more about our Comment Policy.