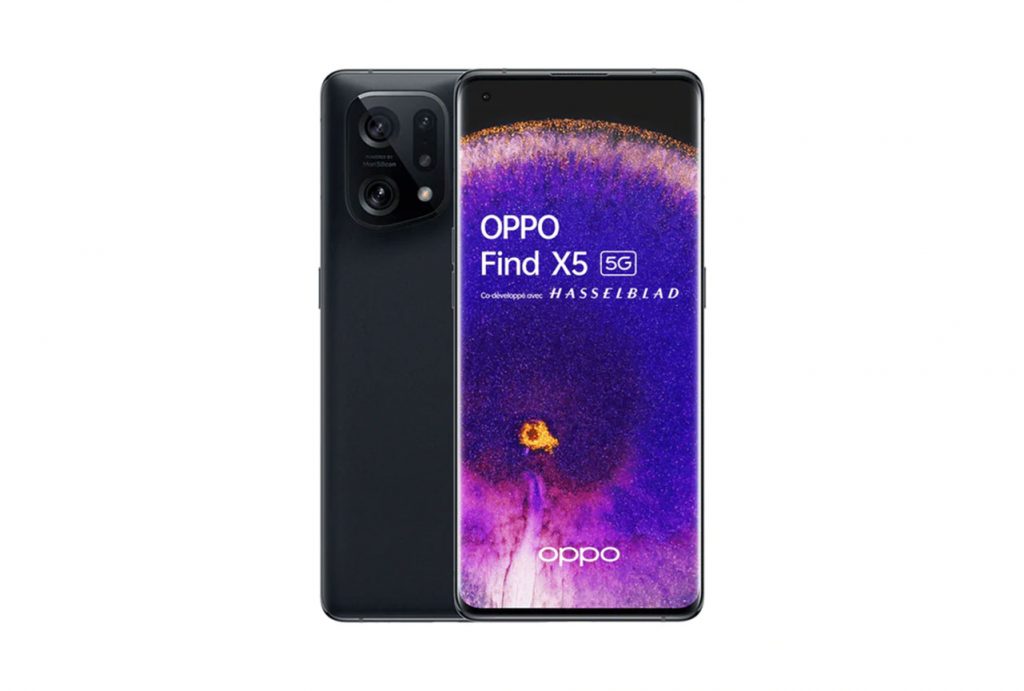
We put the Oppo Find X5 through our rigorous DXOMARK Display test suite to measure its performance. Here’s a look at how it did.
Overview
Key display specifications:
-
- 6.55 inches OLED
- Dimensions: 160.3 × 72.6 × 8.7 mm
- Resolution: 2400 x 1080 pixels, 402ppi
- Aspect ratio: 20:9
- Refresh rate: 120 Hz
Scoring
Sub-scores and attributes included in the calculations of the global score.
 Oppo Find X5
Pros
- Readable in most tested conditions with a brightness adaptation according to the time of the day
- Device smoothness when playing video games and in the gallery app
- Good color and brightness uniformity
Cons
- Very saturated colors in HDR10 videos, with dark tones hardly visible
- Strong color shift when viewed in angle
- Visible aliasing
The Oppo Find X5 display is well suited for overall indoor and low-light use, thanks to good color fidelity and good readability. But when it comes to watching videos, oversaturated colors and hard-to-see dark tones make viewing of HDR10 content quite difficult and uncomfortable on the eyes. On the other hand, for gaming, the device’s display offered a comfortable and smooth experience, with no visible frame drops, despite some aliasing.
Test summary
About DXOMARK Display tests: For scoring and analysis in our smartphone and other display reviews, DXOMARK engineers perform a variety of objective and perceptual tests under controlled lab and real-life conditions. Note that we evaluate display attributes using only the device’s built-in display hardware and its still image (gallery) and video apps at their default settings. (For in-depth information about how we evaluate smartphone and other displays, check out our articles, “How DXOMARK tests display quality” and “A closer look at DXOMARK Display testing.”
The following section gathers key elements of our exhaustive tests and analyses performed in DXOMARK laboratories. Detailed performance evaluations under the form of reports are available upon request. Do not hesitate to contact us.
Readability
Oppo Find X5
164
Readability evaluates how easily and comfortably users can read the display under different real-life conditions on still content (photos & web). DXOMARK uses its Display Bench to recreate ambient light conditions ranging from total darkness to bright sunlight. In addition to laboratory tests,perceptual analysis is also made in real-life environments.

Indoor at 1000 lux, from left to right: Oppo Find X5, 0nePlus 9, Apple iPhone 13, GooglePixel 6 Pro
(Photos for illustration only)

In direct sunlight (>90,000 lux), from left to right: Oppo Find X5, 0nePlus 9, Apple iPhone 13, Google Pixel 6 Pro
(Photos for illustration only)
Color
Oppo Find X5
165
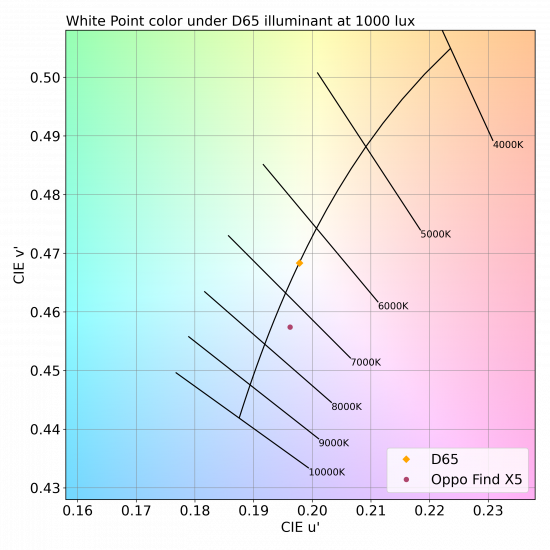
The color attribute evaluates the capacity of the device to accurately reproduce colors. The measurements taken are for fidelity, white point color, and gamut coverage. We perform color evaluations for different lighting conditions to see how well the device can manage color in the surrounding environment. Colors are measured using a spectrophotometer in a controlled lighting environment. Perceptual analysis of color rendering is against the reference pattern displayed on a calibrated professional monitor.
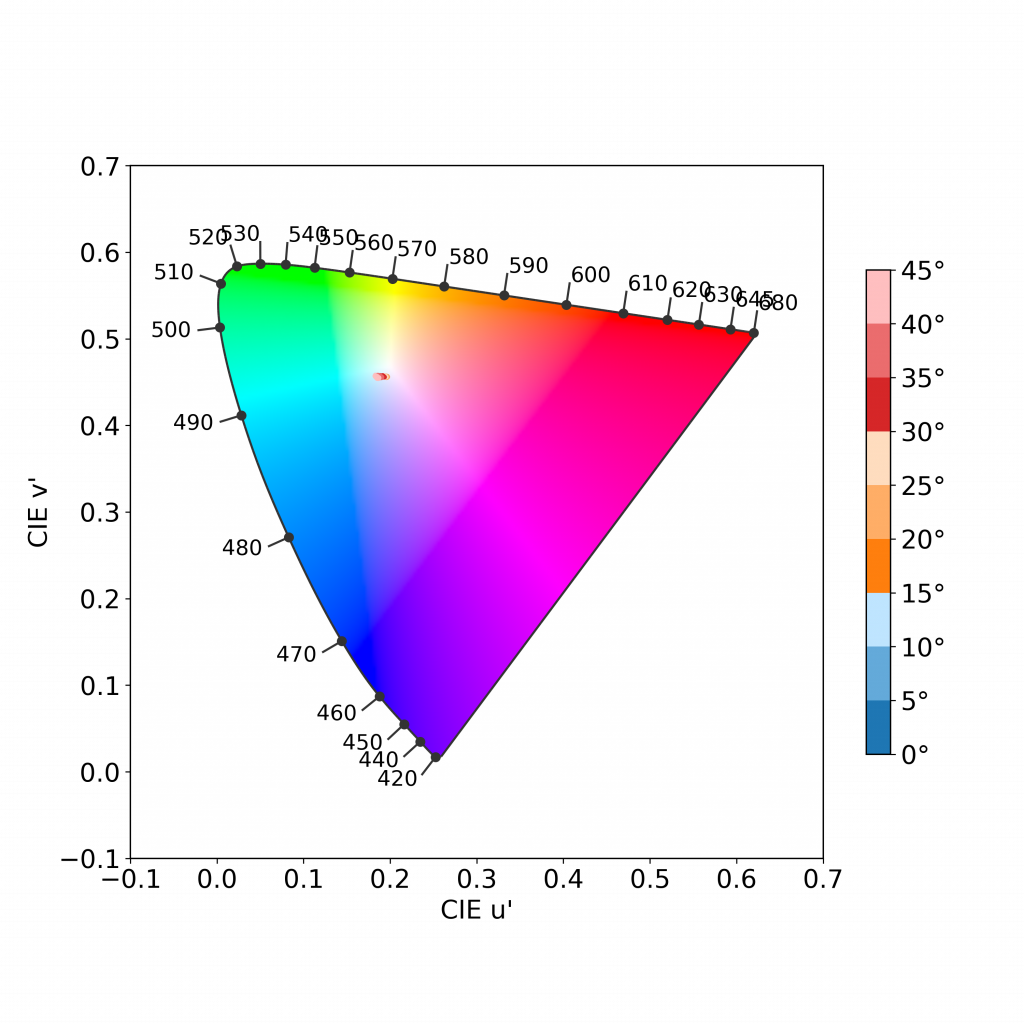
In the graphs below, each arrow represents the color difference between a target color pattern (base of the arrow) and its actual measurement (tip of the arrow). The longer the arrow, the greater the color difference is visible. If the arrow stays within the circle, the color difference will only be visible to trained eyes. In the case of the Oppo Find X5, the color spaces could have been better managed.
 Oppo Find X5, color fidelity at 1000 lux in the sRGB color space
 Oppo Find X5, color fidelity at 1000 lux in the DCI-P3 color space
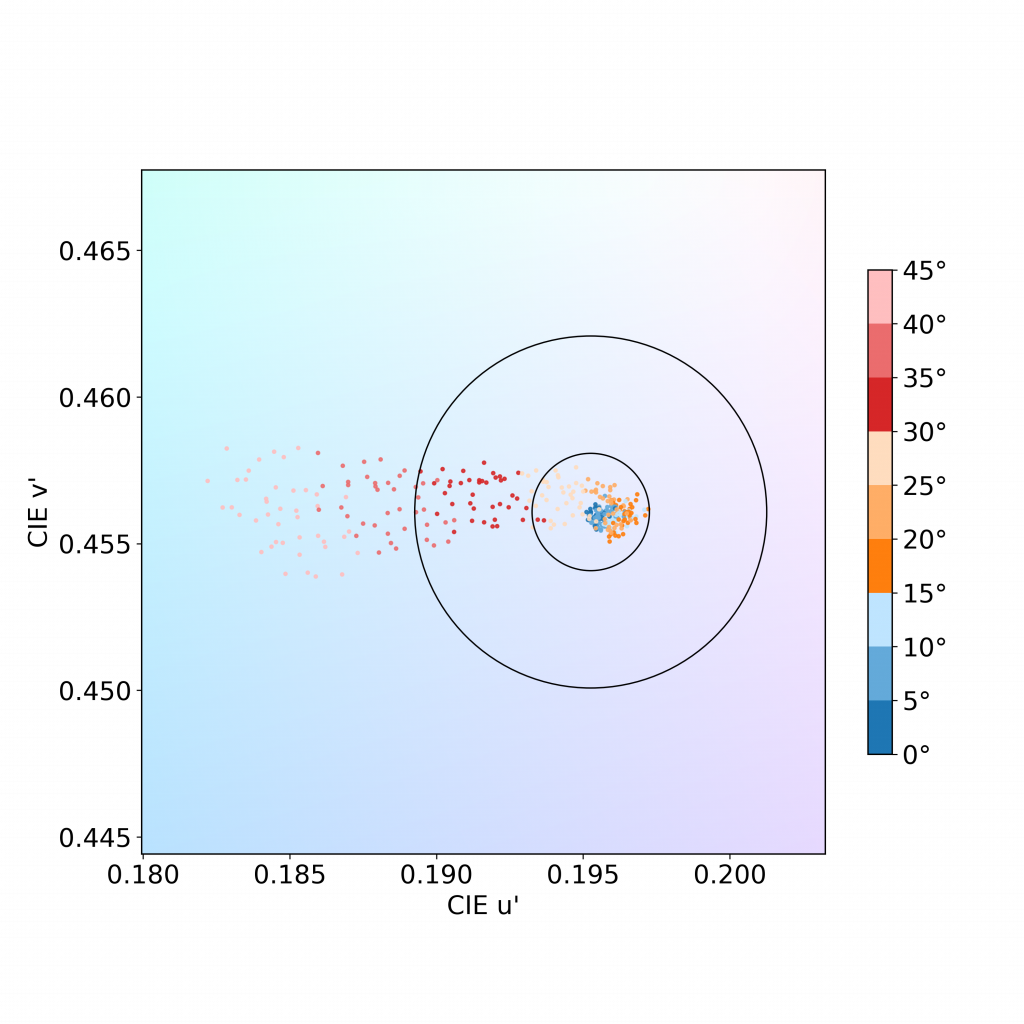
This graph shows the color shift when the screen is at an angle. Each dot represents a measurement at a particular angle. Dots inside the inner circle exhibit no color shift in angle; those between the inner and outer circle have shifts that only trained experts will see; but those falling outside the outer circle are noticeable.

Video
Oppo Find X5
167
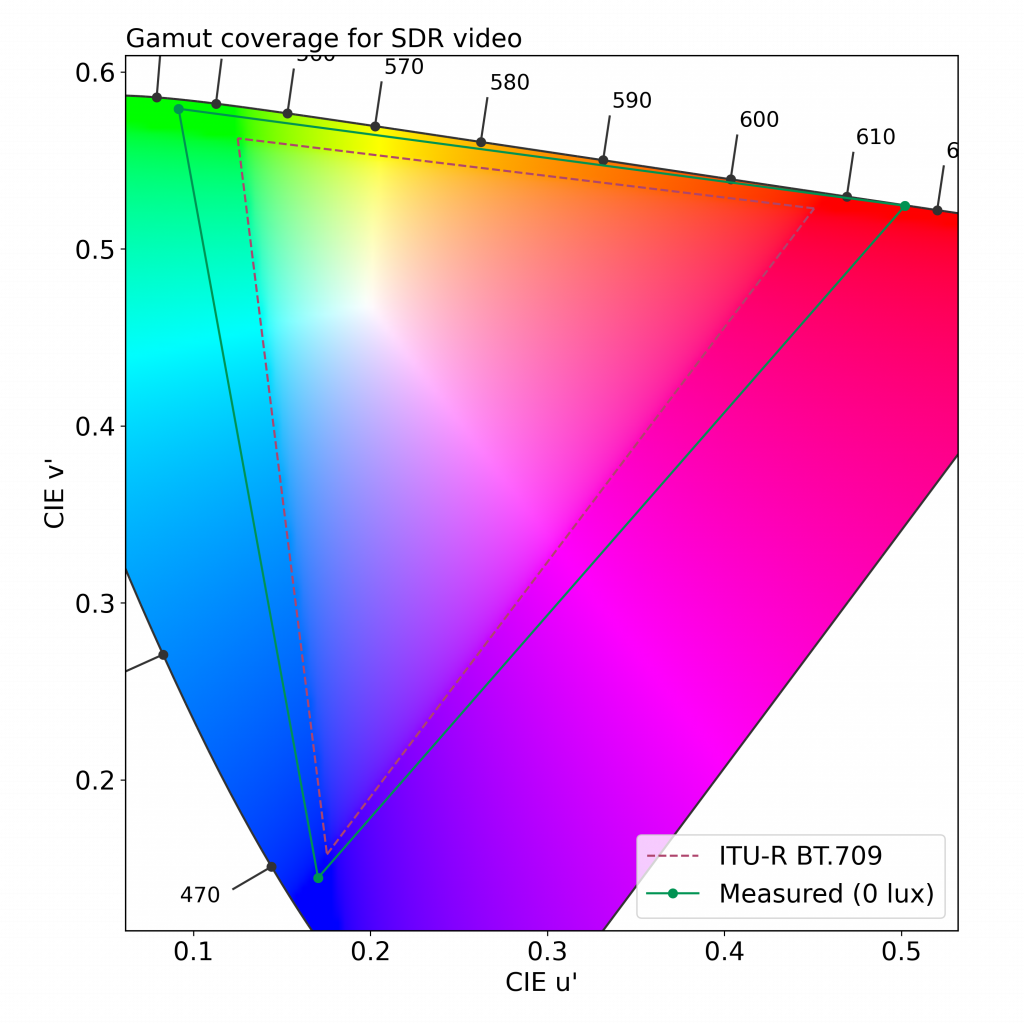
Our video attribute evaluates the Standard Dynamic Range (SDR) and High Dynamic Range (HDR10) video handling of each device in indoor and low light conditions. We measure tone mapping, color gamut, brightness and contrast of the display. We perform perceptual analysis against our professional reference monitor (Sony BVM-HX310) to ensure that the rendering respects the artistic intent.
The primary colors are measured both in HDR10 and SDR. The extracted color gamut shows the extent of the color area that the device can render. To respect the artistic intent, the measured gamut should match the mastering color space of each video.
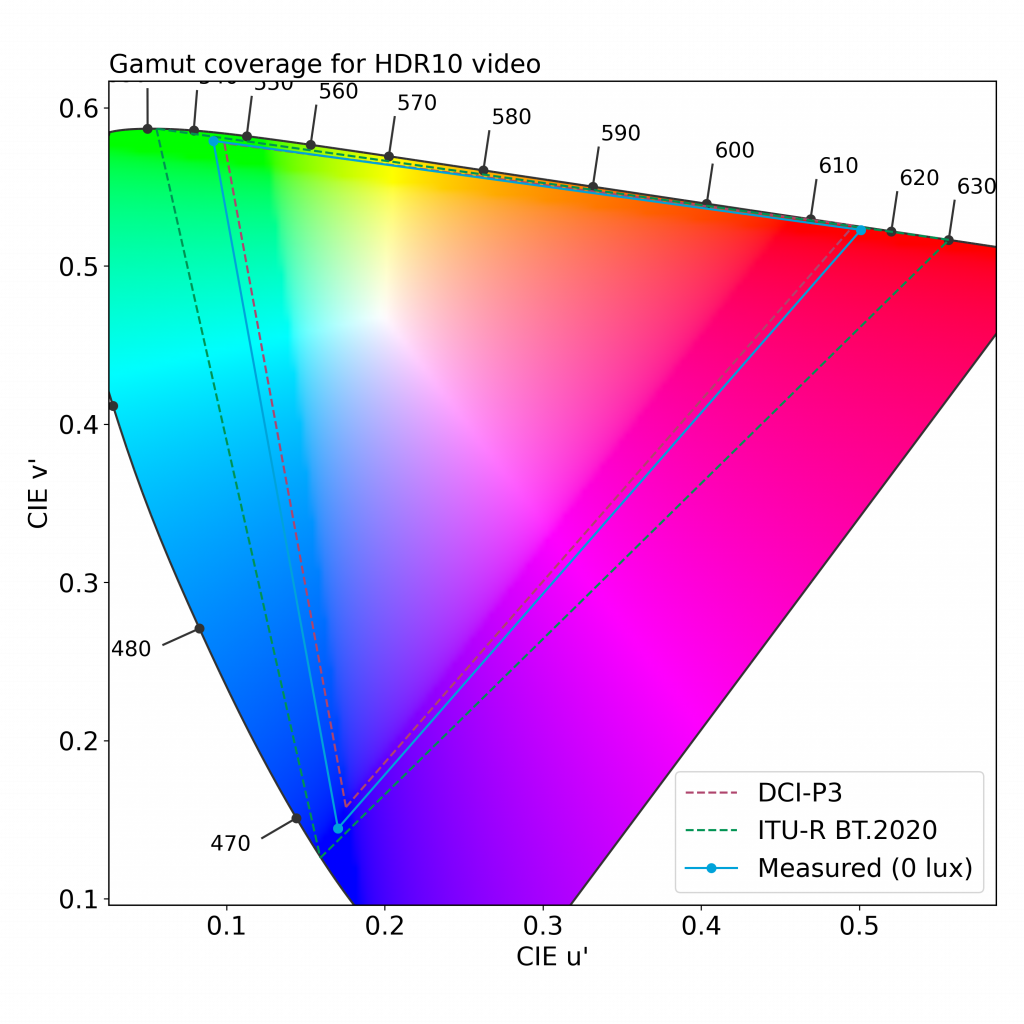
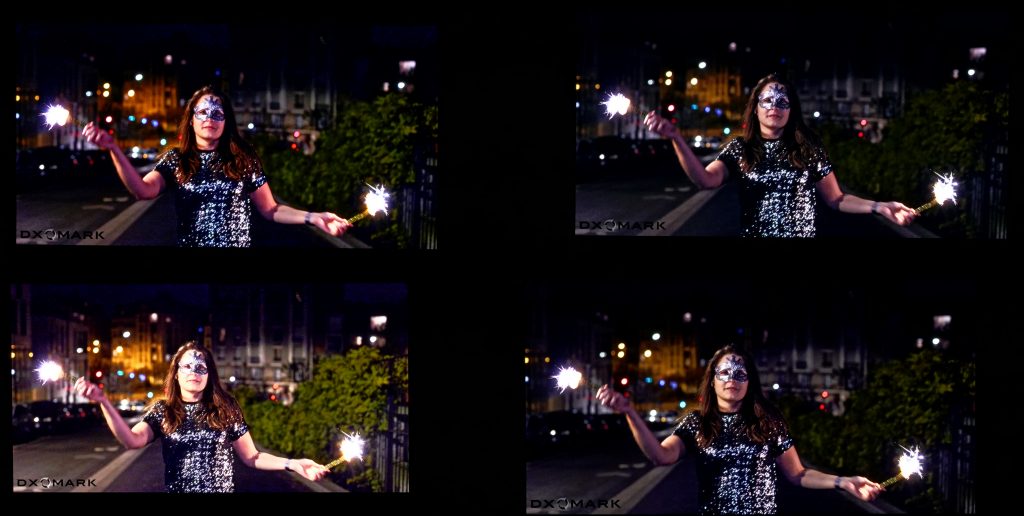
HDR10 content viewed in low light. Clockwise from top left: Oppo Find X5, 0nePlus 9, Google Pixel 6 Pro, Apple iPhone 13.
(Photos for illustration only)
Motion
Oppo Find X5
The motion attribute evaluates the handling of dynamic contents. Frame drops, motion blur, and playback artifacts are scrutinized using games and videos.


This long exposure photo presents the number of frame irregularities in a 30-second video. A good performance shows a regular pattern (either a flat gray image or a pull-down pattern).
Touch
Oppo Find X5
164
To evaluate touch, DXOMARK uses a touch robot and a high-speed camera to play and record a set of scenarios for smoothness, accuracy and response-time evaluation.
This response time test evaluates precisely the time elapsed between the robot touching the screen and the displayed action. This test is applied to activities that require a high reactivity, such as gaming.
Oppo Find X5Artifacts
Evaluating artifacts means checking for the performance, image rendering and motion flaws that can affect the end-user experience. DXOMARK measures precisely the device’s reflectance and the presence of flicker as well as evaluates the residual aliasing when playing videogames, among others.
Measurements above that show the reflection of the device within the visible spectrum range (400 nm to 700 nm). It includes both diffuse and specular reflection
This graph represents the frequencies of lighting variation; the highest peak gives the main flicker frequency.
DXOMARK encourages its readers to share comments on the articles. To read or post comments, Disqus cookies are required. Change your Cookies Preferences and read more about our Comment Policy.