
We put the Samsung Galaxy Book3 Pro 16″ through our rigorous DXOMARK Laptop test suite to measure its performance both at sound, camera and display.
In this review, we will break down how it fared in a variety of tests and several common use cases.
Overview
Key specifications include (as given by the manufacturer):
- Physical specs :1.56 kg,12.5 mm thickness
- Display :120 Hz, 3K AMOLED display (2880×1800),120% DCI-P3 Coverage
- Audio :Quad speakers,Tuned with AKG & Dolby Atmos,Studio Quality Dual Mics
- Webcam :1080p Hi-res Wide-angle Camera
Scoring
Use-case and feature subscores included in the calculations of the global score
Samsung Galaxy Book3 Pro 16"
84
95
84
Pros
- Good laptop speakers’ performance while in video call delivering intelligible voices
- Good control of camera’s visual noise while running video calls
- Duplex functionality well handled
- Very good SDR and HDR video performances with faithful color rendering and wide color gamut
- Good display readability overall with good brightness range
- Good audio dynamics with a good performance at loud volumes
Cons
- Video call experience impacted by an unstable white balance, as well as artifacts such as anamorphosis in all tested conditions
- Low voice intelligibility in capture while in video call mainly due to gating, low sharpness and aggressive noise reduction
- Visible highlight clipping while watching videos at maximum brightness
The Samsung Galaxy Book3 Pro’s overall performance was similar to other premium laptops, but its handling of video calls and multimedia, the two use cases tested in the new protocol, was unbalanced.
With an impressive display and satisfying audio experience, the laptop’s strength was its multimedia performance, making it well adapted for watching videos and HDR content.
For professional communications, users will appreciate the high-performing clear display and the decent voice intelligibility. However, video-calling performance was hindered by the laptop’s built-in camera, which was unable to handle challenging light conditions and provided subpar image quality. Audio quality during a video call was affected by gating issues, which depended on the video-conferencing application.
While the Samsung Galaxy Book3 Pro is capable of handling the occasional work video calls, it really leans more toward the leisure laptop user with its excellent performance in multimedia.
Test summary
About DXOMARK Laptop tests: For scoring and analysis in our laptop reviews, DXOMARK engineers perform a variety of objective tests and undertake more than 20 hours of perceptual evaluations under controlled lab conditions and real-life scenarios.
(For more details about the Laptop protocol, click here.)
The following section gathers key elements of our exhaustive tests and analyses performed in DXOMARK laboratories. Detailed performance evaluations under the form of reports are available upon request. Do not hesitate to contact us.
Video Call
Samsung Galaxy Book3 Pro 16"
144
DXOMARK's Video call use case is a score that evaluates how a device handles video calls and videoconferencing in multiple conditions. This score focuses on the camera performance and the capture and playback rendering of voices. Read more about how we test the use cases of Video call score here.
The Galaxy Book3 Pro showed a below-average performance in Video Call, scoring below its competitors. While Video Calls are still possible with this laptop, users may be disappointed by the camera performance. Even though visual noise is kept to a minimum and exposure is acceptable in simple scenarios, the laptop is hindered by poor color reproduction and the presence of numerous artifacts. Our testing showed an unstable white balance, resulting in unexpected changes in color temperature, as well as artifacts in most tested conditions such as anamorphosis, hue shift, and color shading.
Audio performance is not excellent but acceptable in most calling situations, with good intelligibility of voices, which is further helped by a strong noise reduction that results in a strong Signal-to-Noise ratio. This noise reduction algorithm’s tuning is a bit aggressive and sometimes triggers noise cancellation of some spoken words, resulting in a noticeable and unwanted gating.
Camera
Samsung Galaxy Book3 Pro 16"
135
The following chart presents the camera subscores for the video call use case:
The following graphs show the objective measurements performed in our camera labs:
Audio
Samsung Galaxy Book3 Pro 16"
144
The following chart presents the capture subscores for the video call use case:
The following graphs show the frequency response, distortion and directivity in capture, recorded in our semi-anechoic room:
Music & Video
Samsung Galaxy Book3 Pro 16"
154
DXOMARK's Video and Music use case score evaluates the capability of a device to reproduce multimedia usages such as videos, movies and music playback in indoor conditions. This score focuses on the display performance and audio-playback rendering. Read more about how we test this use case here.
The Samsung Galaxy Book3 Pro performed much better as a device used for watching movies, listening to music or browsing pictures. It ranked third in the multimedia use case in the initial batch of laptops tested, and behind two Apple MacBooks.
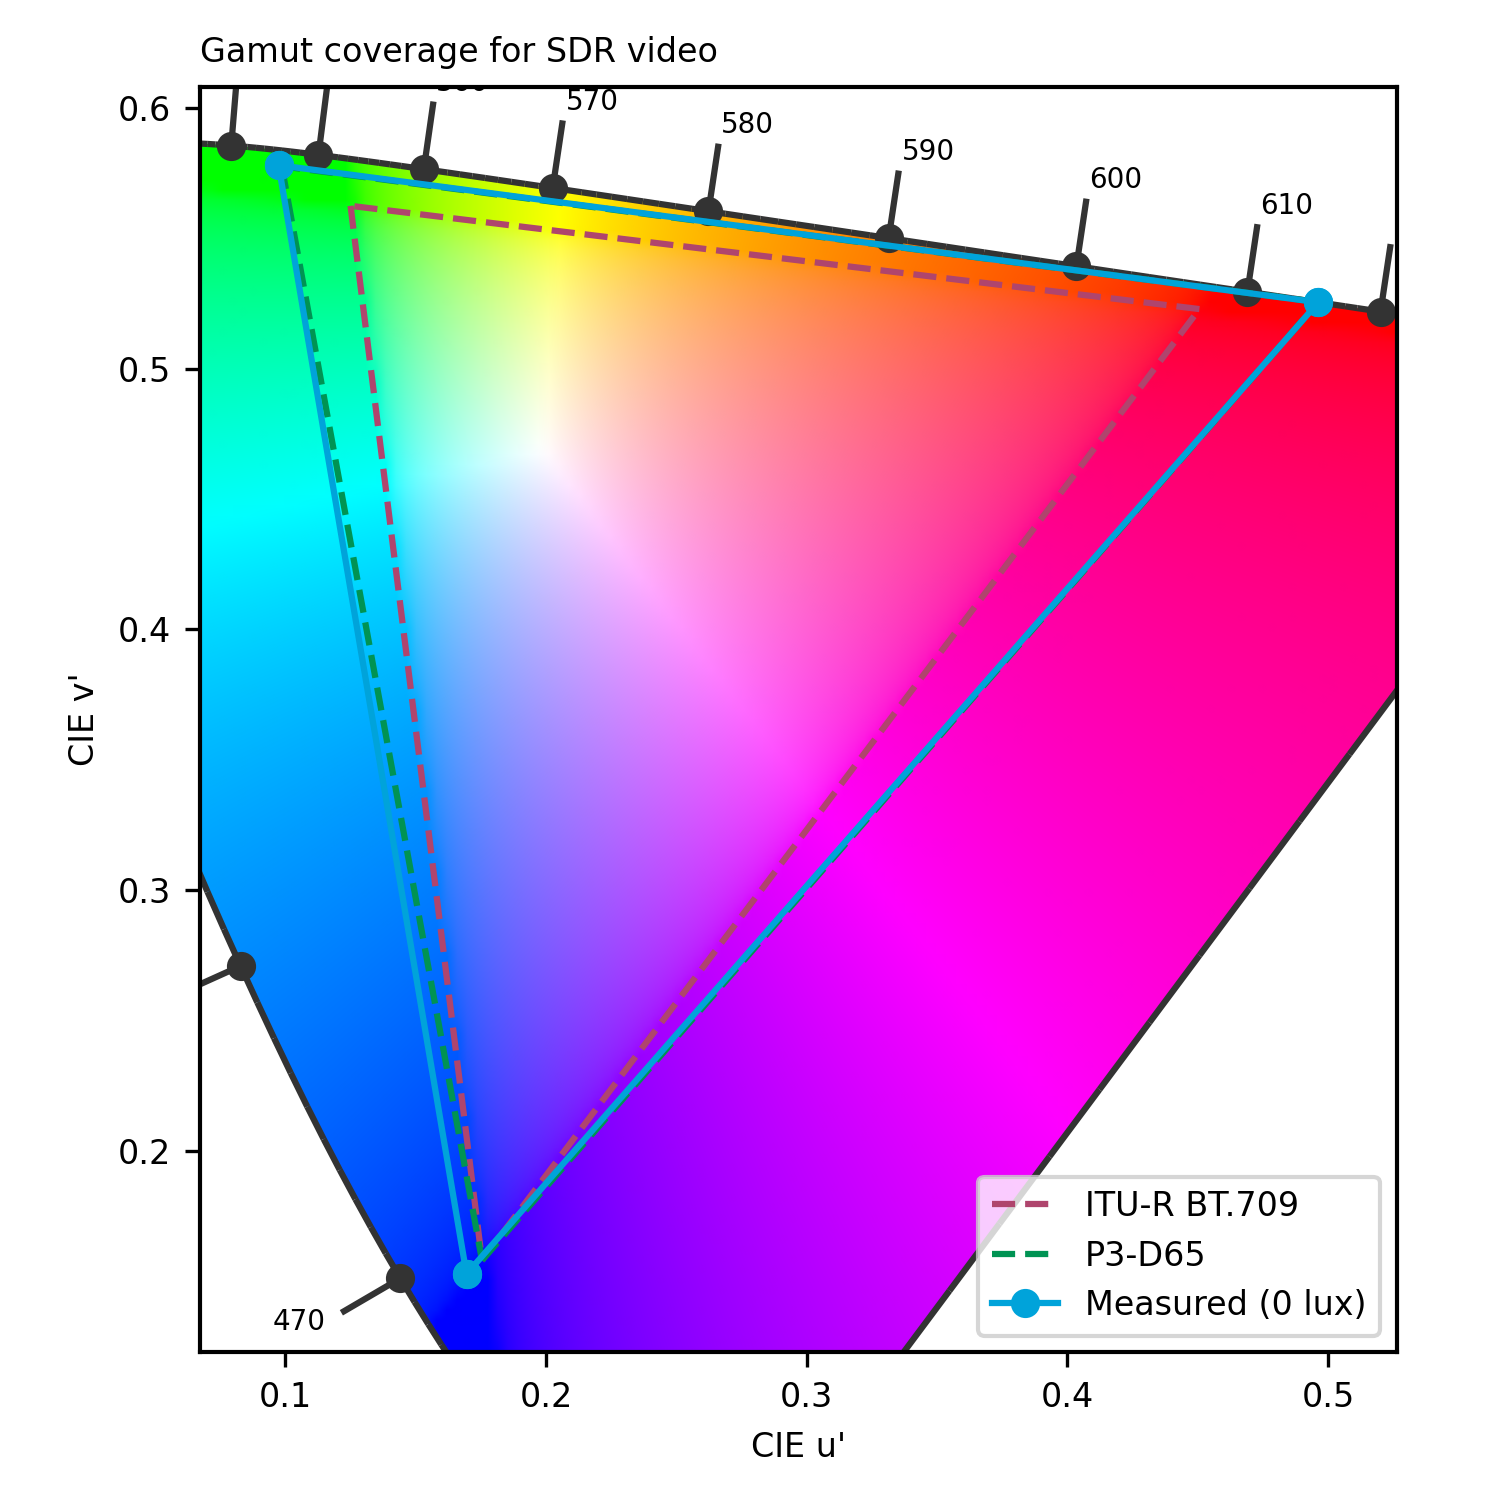
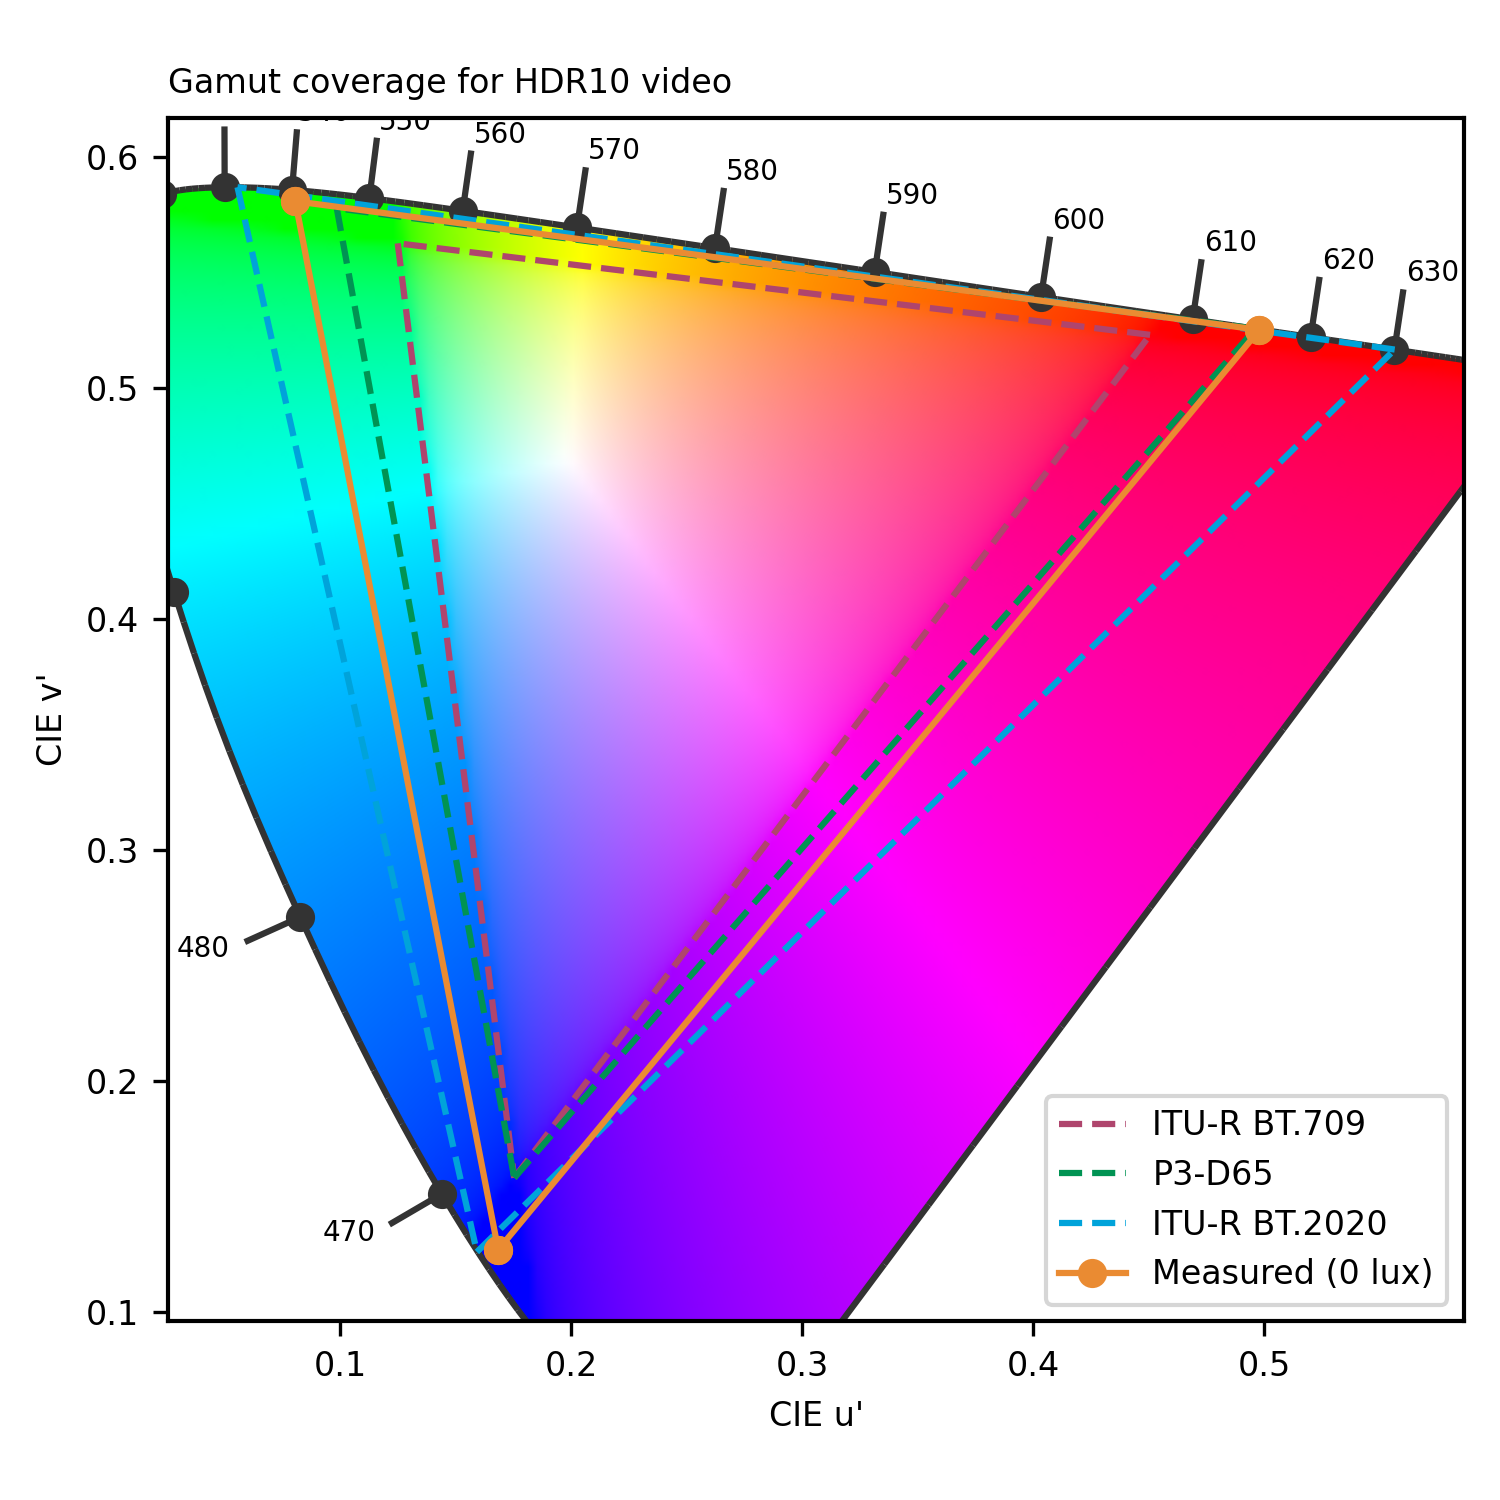
The Galaxy Book3 Pro’s strong showing is due to its display performance, particularly its good SDR. Even if its colors are over-saturated, its gamma curve is excellent. The HDR-compatible screen that displays mostly accurate colors and a decent OETF curve results in an overall very satisfying experience when watching multimedia content.
(Note that as with all laptops tested running Windows 11, the EOTF at maximum brightness results in excessive clipping in the highlights. Setting the screen to 50% brightness setting greatly improved the EOTF.
On the audio side, the performance is also good, ranking above average in multimedia uses, thanks to a pleasant timbre tuning. This timbre could, however, benefit from a bit more brightness to help having more clarity on difficult audio content. Users may want to limit the volume a bit, however, as setting the laptop to its maximum volume level results in brighter sound, but also induces heavy pumping (noticeable temporal compression), which could impair the experience on bass-heavy contents, such as action movies or electronic music.
Display
Samsung Galaxy Book3 Pro 16"
156
The following chart presents the display subscores for the multimedia use case:
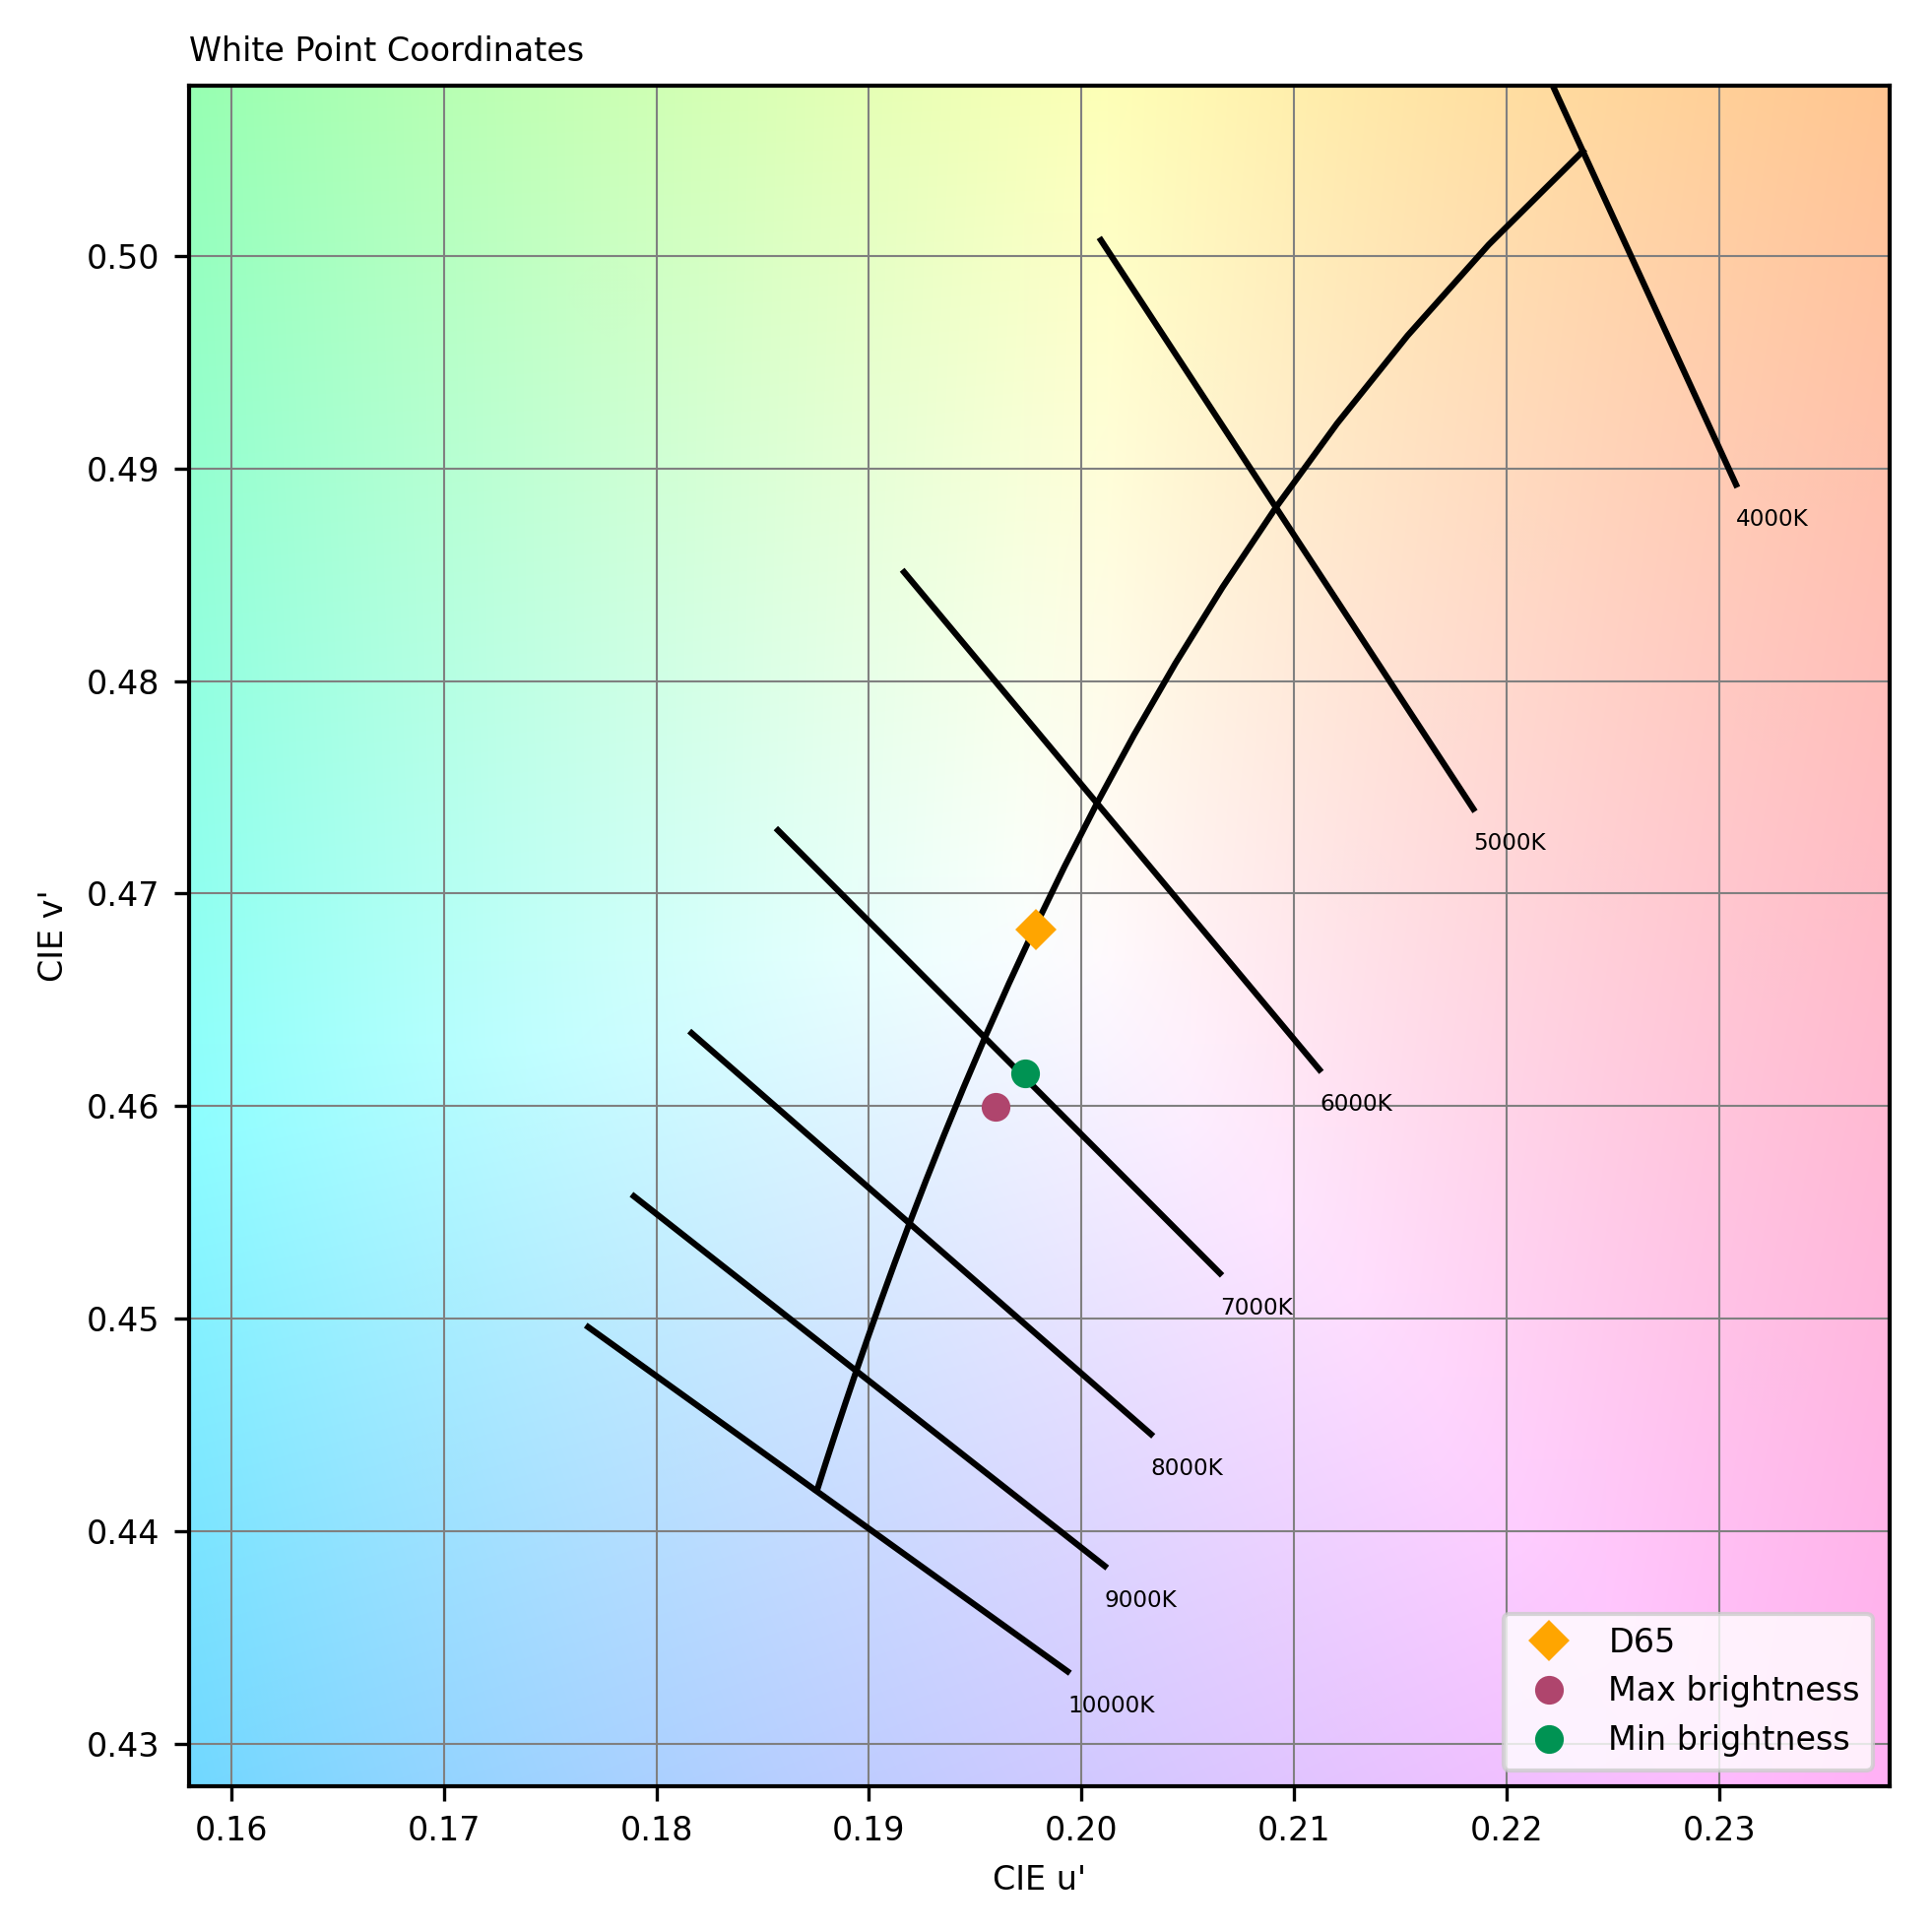
The following graphs show the objective measurements performed in our display lab:
cd/m²
cd/m²
cd/m²
cd/m²
cd/m²
cd/m²
cd/m²
cd/m²
cd/m²
 Distribution of brightness (min)
cd/m²
cd/m²
cd/m²
cd/m²
cd/m²
cd/m²
cd/m²
cd/m²
cd/m²
Distribution of brightness (max)
Audio
Samsung Galaxy Book3 Pro 16"
152
The following chart presents the playback for the multimedia use case:
The following graphs show the frequency response, distortion and directivity in multimedia playback, recorded in our semi-anechoic room:
DXOMARK encourages its readers to share comments on the articles. To read or post comments, Disqus cookies are required. Change your Cookies Preferences and read more about our Comment Policy.