We put the Samsung Galaxy S24 through our rigorous DXOMARK Display test suite to measure its performance across six criteria. In this test results, we will break down how it fared in a variety of tests and several common use cases.
Overview
Key display specifications:
- 6.2 inches Dynamic AMOLED 2X (~89.9% screen-to-body ratio)
- Dimensions: 147.0 x 70.6 x 7.6 mm (5.79 x 2.78 x 0.30 inches)
- Resolution: 1080 x 2340 pixels, (~416 ppi density)
- Aspect ratio: 19.5:9
- Refresh rate: 120 Hz
Scoring
Sub-scores and attributes included in the calculations of the global score.
 Samsung Galaxy S24

154
display
157
Samsung Galaxy S24 Ultra
Best: Samsung Galaxy S24 Ultra (164)
149
Google Pixel 8
Best: Google Pixel 8 (165)
157
Samsung Galaxy S25 Ultra
Best: Samsung Galaxy S25 Ultra (167)
145
Google Pixel 7 Pro
Best: Google Pixel 7 Pro (164)
Position in Global Ranking

11
th
1. Samsung Galaxy S25 Ultra
160
2. Samsung Galaxy S25 Edge
158
9. Samsung Galaxy S24 Ultra
155
11. Samsung Galaxy Z Fold6
154
11. Samsung Galaxy S24+ (Exynos)
154
11. Samsung Galaxy S24 (Exynos)
154
18. Google Pixel 9 Pro Fold
152
20. Apple iPhone 15 Pro Max
151
25. Apple iPhone 16 Pro Max
150
25. Samsung Galaxy Z Flip6
150
33. Samsung Galaxy S23 Ultra
148
39. Samsung Galaxy A55 5G
147
42. Apple iPhone 14 Pro Max
146
44. Samsung Galaxy S24 FE
145
48. Samsung Galaxy Z Flip5
144
50. Asus Zenfone 11 Ultra
143
50. Samsung Galaxy A35 5G
143
55. Apple iPhone 13 Pro Max
142
55. Samsung Galaxy Z Fold5
142
61. Samsung Galaxy S23 FE
140
66. Xiaomi Redmi Note 14 Pro+ 5G
139
67. Honor Magic4 Ultimate
138
78. Samsung Galaxy S22 Ultra (Snapdragon)
135
78. Xiaomi Redmi Note 13 Pro Plus 5G
135
83. Samsung Galaxy S22+ (Exynos)
134
86. Samsung Galaxy Z Flip4
133
86. Samsung Galaxy S22 Ultra (Exynos)
133
86. Samsung Galaxy S22 (Snapdragon)
133
86. Vivo X80 Pro (MediaTek)
133
91. Samsung Galaxy S22 (Exynos)
132
96. Samsung Galaxy S21 Ultra 5G (Exynos)
131
96. Vivo X80 Pro (Snapdragon)
131
100. Apple iPhone 13 mini
130
100. Samsung Galaxy Z Fold4
130
100. Samsung Galaxy S21 Ultra 5G (Snapdragon)
130
100. Samsung Galaxy S21 FE 5G (Snapdragon)
130
111. Samsung Galaxy A54 5G
129
115. Apple iPhone 12 Pro Max
127
119. Vivo X60 Pro 5G (Snapdragon)
126
136. Motorola Edge 30 Pro
123
140. Apple iPhone 11 Pro Max
122
140. Motorola Edge 40 Pro
122
144. Apple iPhone SE (2022)
120
150. Samsung Galaxy A52 5G
114
152. Motorola Razr 40 Ultra
113
155. Crosscall Stellar-X5
109
156. Samsung Galaxy A53 5G
108
160. Crosscall Stellar-M6
101
163. Samsung Galaxy A22 5G
82
Position in Premium Ranking
3
rd
3. Samsung Galaxy S24 (Exynos)
154
14. Samsung Galaxy S22 (Snapdragon)
133
15. Samsung Galaxy S22 (Exynos)
132
17. Samsung Galaxy S21 FE 5G (Snapdragon)
130
23. Vivo X60 Pro 5G (Snapdragon)
126
Pros
- Good readability under sunlight thanks to a very high peak brightness
- Accurate color rendering in most lighting environments
- Excellent management of frame mismatches when watching videos or playing video games
Cons
- Excessively high brightness levels in HDR video playback
- Lack of brightness and details in indoor lighting environment
- Poor management of involuntary touches
The Samsung Galaxy S24 nearly matched the display performance of the top-of-the-line S24 Ultra, thanks to achieving two top scores in readability and touch, but the smaller device was held back due to its management of artifacts.
Even though the devices have key differences, mainly in size, chipset, and glass, the Galaxy S24’s display behavior was very similar to that of the Ultra version. The 6.2-inch S24, like the 6.7-inch S24+, was released with the latest version of Samsung’s in-house chip, Exynos 2400, while the 6.8-inch S24 Ultra sports Qualcomm’s Snapdragon 8 Gen 3. The S24’s glass protection is the same as the one used on the S23 series, whereas the S24 Ultra’s display has glass reinforced with anti-reflective properties, which played a role in artifacts management.
While the lack of an anti-reflective screen cost the S24 significant points in artifacts, due to poor reflection management, it could also be said that the older glass was a contributing factor in S24 attaining a top score in readability. When it came to luminance, the S24 achieved a slightly higher peak than the already-impressive peak of the S24 Ultra, making the S24 a very readable screen in sunlight. Peak brightness, better gamma management under sunlight, and a more uniform screen all helped the device achieve a top score in the readability attribute.
In our display evaluation, our testers found the S24’s screen colors to be a huge improvement over the predecessor S23. The colors on the S24 were much more accurate than on previous S-series models, particularly outdoors, correcting the color artifact noticed on the S23 series. The S24 series’ new type of color signature, with the same color rendering across all three models, offers much more of a “natural” rendering compared to the previous series. However, when viewing the S24 screen on an angle, screen colors did change, but not as much as they did on the S24 Ultra, a factor that helped the S24 achieve a slightly better score in the color attribute.
An overly bright screen can make watching videos in a dark environment quite uncomfortable if the device does not sufficiently decrease brightness. In our tests, the S24’s screen, like on the S24 Ultra, lost some points here for remaining much too bright when viewing videos.
In the motion attribute, stutter was visible when resuming the video in playback, showing that the S24 was a bit slower than the S24 Ultra in execution.
The S24 reached a top score for its touch interactions, which were accurate and smooth, with a fast response time.
The S24’s impressive display performance earned it the top spot so far among devices in the Premium segment.
Test summary
About DXOMARK Display tests: For scoring and analysis in our smartphone and other display reviews, DXOMARK engineers perform a variety of objective and perceptual tests under controlled lab and real-life conditions. Note that we evaluate display attributes using only the device’s built-in display hardware and its still image (gallery) and video apps at their default settings. (For in-depth information about how we evaluate smartphone and other displays, check out our articles, “How DXOMARK tests display quality” and “A closer look at DXOMARK Display testing.”
The following section gathers key elements of our exhaustive tests and analyses performed in DXOMARK laboratories. Detailed performance evaluations under the form of reports are available upon request. Do not hesitate to contact us.
Readability
157
Samsung Galaxy S24 Ultra
Samsung Galaxy S24 Ultra
How Display Readability score is composed
Readability evaluates how easily and comfortably users can read still content (photos & web) on the display under different real-life conditions. DXOMARK uses its Display Bench to recreate ambient light conditions ranging from total darkness to bright sunlight. In addition to laboratory tests, perceptual analysis is also made in real-life environments.
Luminance under various lighting conditions
Readability in an indoor (1000 lux) environment
From left to right: Samsung Galaxy S24, Samsung Galaxy S23, Apple iPhone 15, Google Pixel 8
(Photos for illustration only)
Readability in an outdoor (20 000 lux) environment
From left to right: Samsung Galaxy S24, Samsung Galaxy S23, Apple iPhone 15, Google Pixel 8
(Photos for illustration only)
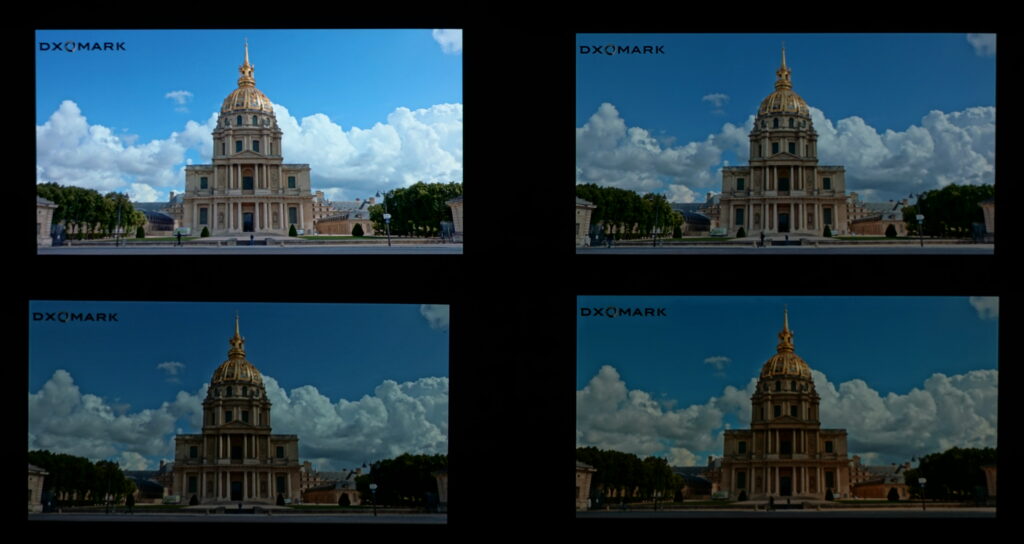
Readability in a sunlight (>90 000 lux) environment
From left to right: Samsung Galaxy S24, Samsung Galaxy S23, Apple iPhone 15, Google Pixel 8
(Photos for illustration only)
Readability at a 45° angle

From left to right: Samsung Galaxy S24, Samsung Galaxy S23, Apple iPhone 15, Google Pixel 8
(Photos for illustration only)
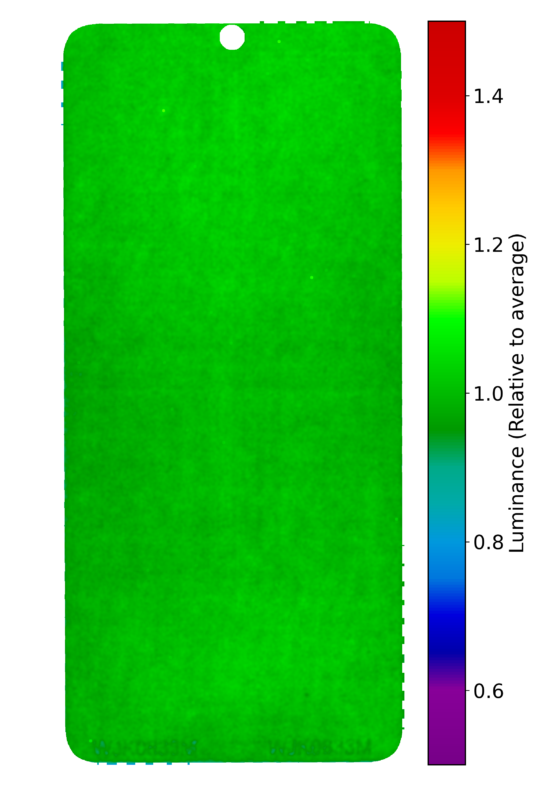
Luminance uniformity measurement
This graph shows the uniformity of the display with a 20% gray pattern. The more visible the green color, the more uniform the display.
Color
149
Google Pixel 8
Google Pixel 8
How Display Color score is composed
The color attribute evaluates the capacity of the device to accurately reproduce colors. The measurements taken are for fidelity, white point color, and gamut coverage. We perform color evaluations for different lighting conditions to see how well the device can manage color in the surrounding environment. Colors are measured using a spectrophotometer in a controlled lighting environment. Perceptual analysis of color rendering is against the reference pattern displayed on a calibrated professional monitor.
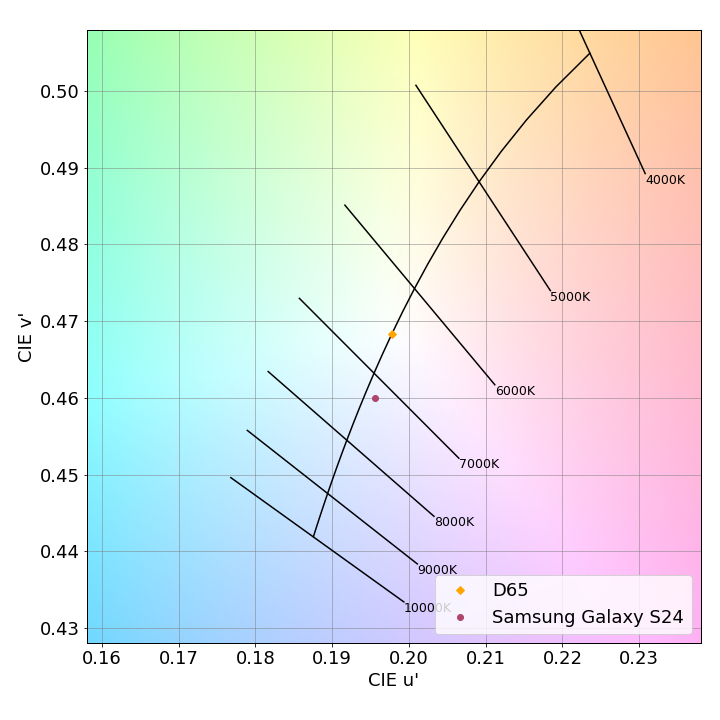
White point under D65 illuminant at 1000 lux
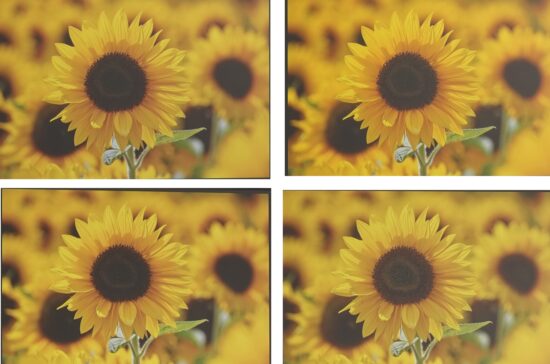
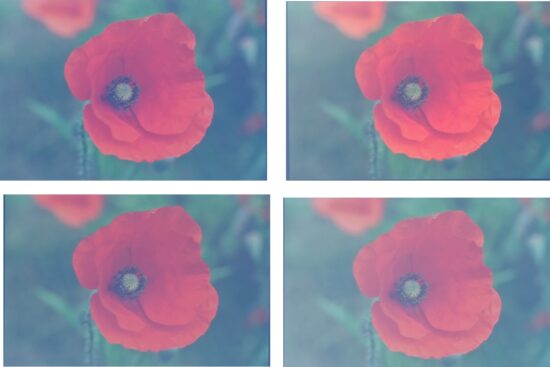
Color rendering indoors (1000 lux)
Clockwise from top left: Samsung Galaxy S24, Samsung Galaxy S23, Apple iPhone 15, Google Pixel 8
(Photos for illustration only)
Color rendering outdoors (20 000 lux)
Clockwise from top left: Samsung Galaxy S24, Samsung Galaxy S23, Apple iPhone 15, Google Pixel 8
(Photos for illustration only)
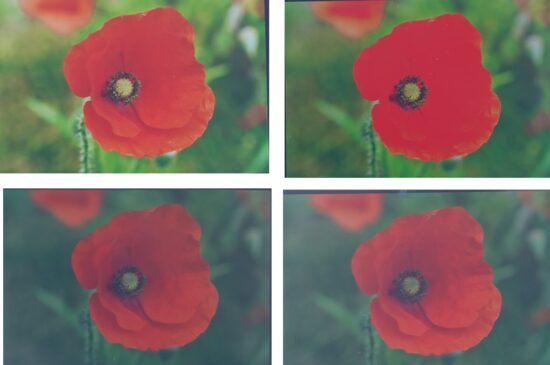
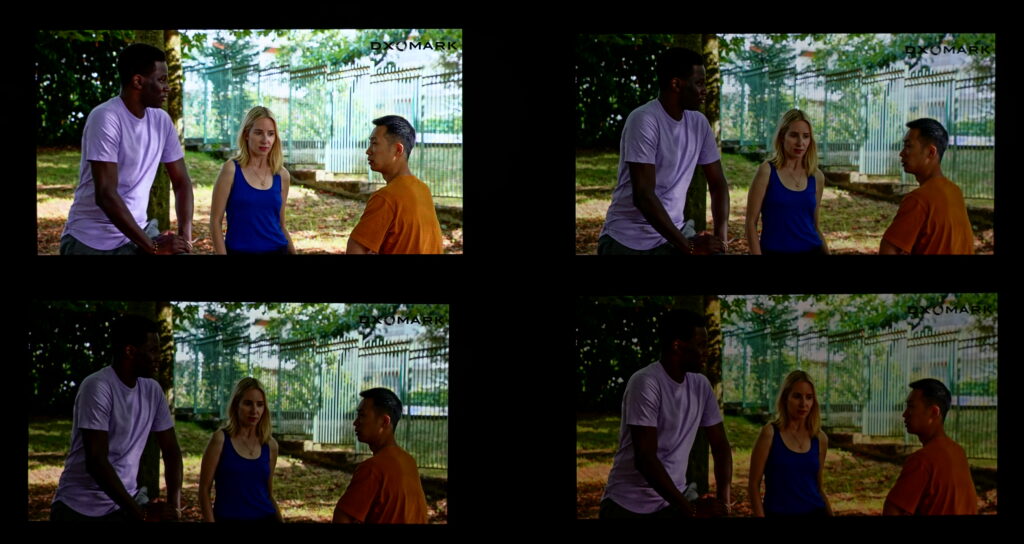
Color rendering in sunlight (>90 000 lux)
Clockwise from top left: Samsung Galaxy S24, Samsung Galaxy S23, Apple iPhone 15, Google Pixel 8
(Photos for illustration only)
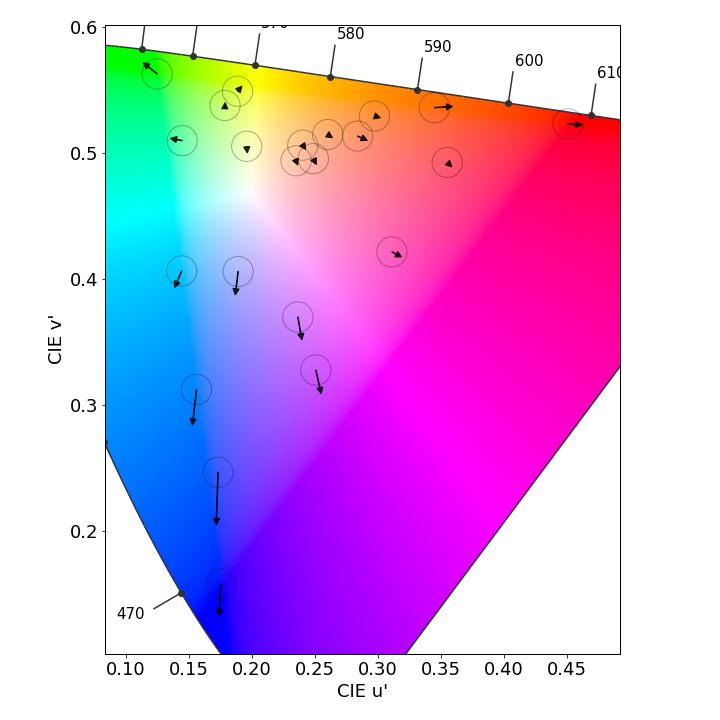
Color fidelity measurements
Samsung Galaxy S24, color fidelity at 1000 lux in the sRGB color space
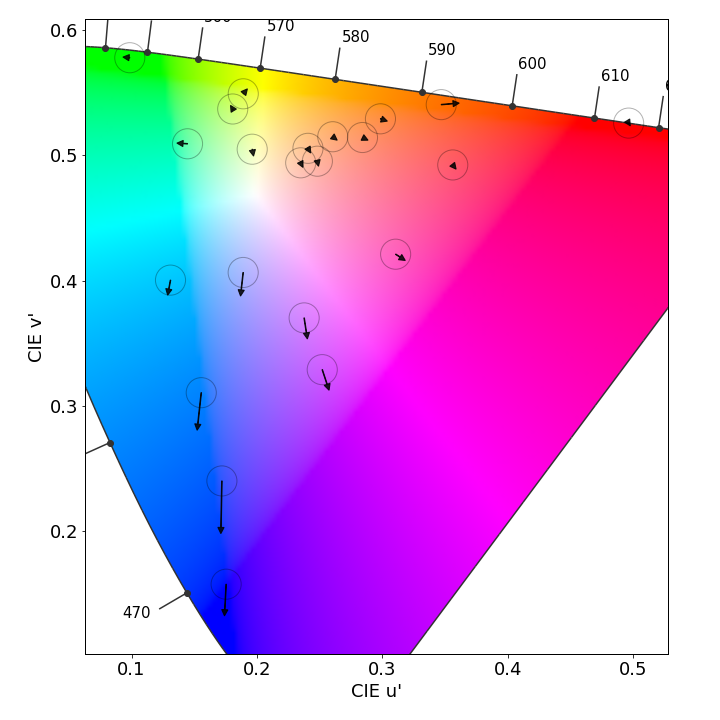
Samsung Galaxy S24, color fidelity at 1000 lux in the Display-P3 color space
Each arrow represents the color difference between a target color pattern (base of the arrow) and its actual measurement (tip of the arrow). The longer the arrow, the more visible the color difference is. If the arrow stays within the circle, the color difference will be visible only to trained eyes.
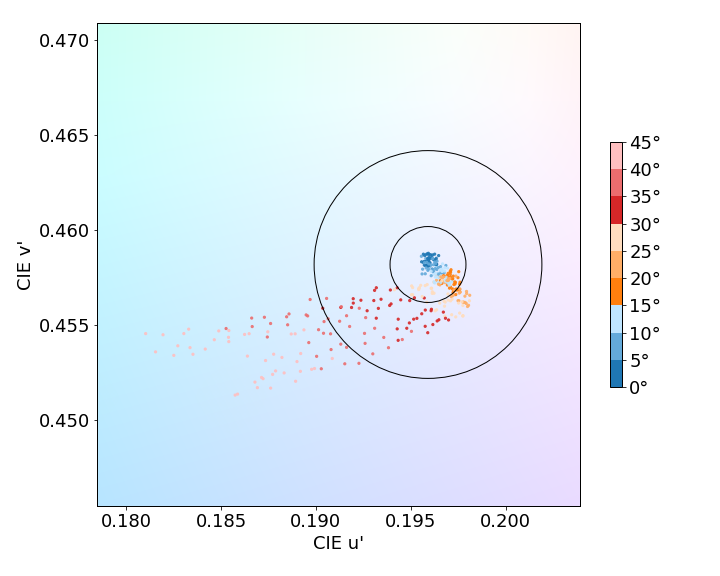
Color behavior on angle
This graph shows the color shift when the screen is at an angle. Each dot represents a measurement at a particular angle. Dots inside the inner circle exhibit no color shift in angle; those between the inner and outer circle have shifts that only trained experts will see; but those falling outside the outer circle are noticeable.
Color shift on angle
From left to right: Samsung Galaxy S24, Samsung Galaxy S23, Apple iPhone 15, Google Pixel 8
(Photos for illustration only)
Video
157
Samsung Galaxy S25 Ultra
Samsung Galaxy S25 Ultra
How Display Video score is composed
Our video attribute evaluates the Standard Dynamic Range (SDR) and High Dynamic Range (HDR10) video handling of each device in indoor and low-light conditions. We measure tone mapping, color gamut, brightness and contrast of the display. We perform perceptual analysis against our professional reference monitor (Sony BVM-HX310) to ensure that the rendering respects the artistic intent.
Video brightness at 10% APL in the dark ( < 5 lux)
Video rendering in a low-light (0 lux) environment
Clockwise from top left: Samsung Galaxy S24, Samsung Galaxy S23, Apple iPhone 15, Google Pixel 8
(Photos for illustration only)
Clockwise from top left: Samsung Galaxy S24, Samsung Galaxy S23, Apple iPhone 15, Google Pixel 8
(Photos for illustration only)
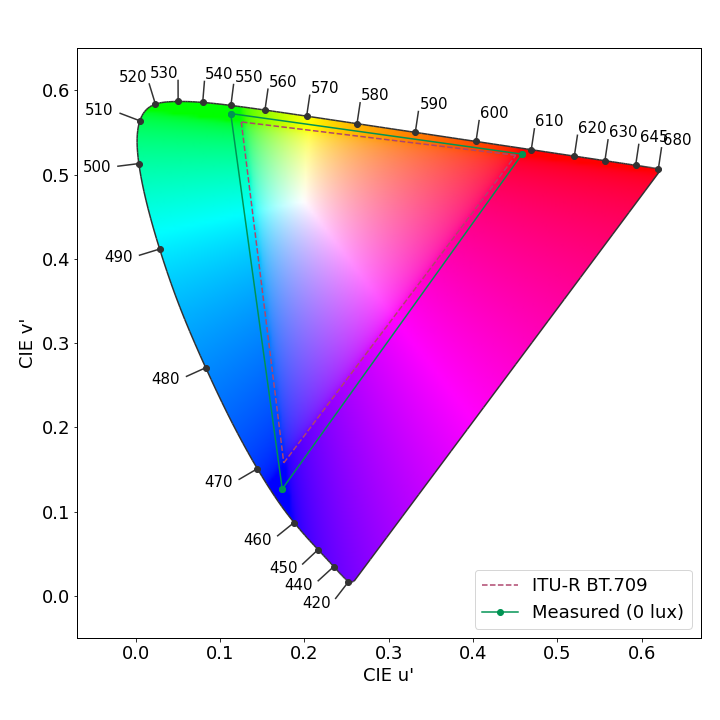
Gamut coverage for video content
The primary colors are measured both in HDR10 and SDR. The extracted color gamut shows the extent of the color area that the device can render. To respect the artistic intent, the measured gamut should match the master color space of each video.
How Display Motion score is composed
The motion attribute evaluates the handling of dynamic contents. Frame drops, motion blur, and playback artifacts are scrutinized using games and videos.
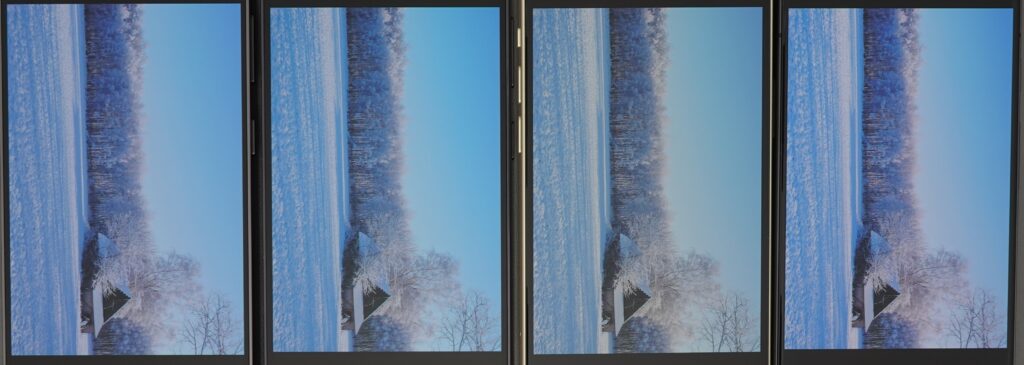
Video frame drops
These long exposure photos present the number of frame irregularities in a 30-second video. A good performance shows a regular pattern (either a flat gray image or a pull-down pattern).
Touch
145
Google Pixel 7 Pro
Google Pixel 7 Pro
How Display Touch score is composed
To evaluate touch, DXOMARK uses a touch robot and a high-speed camera to play and record a set of scenarios for smoothness, accuracy and response-time evaluation.
Average Touch Response Time Samsung Galaxy S24
This response time test precisely evaluates the time elapsed between a single touch of the robot on the screen and the displayed action. This test is applied to activities that require high reactivity, such as gaming.
How Display Artifacts score is composed
Evaluating artifacts means checking for the performance, image rendering and motion flaws that can affect the end-user experience. DXOMARK measures precisely the device’s reflectance and the presence of flicker, and assesses the impact of residual aliasing when playing video games, among other characteristics.
Average Reflectance (SCI) Samsung Galaxy S24
SCI stands for Specular Component Included, which measures both the diffuse reflection and the specular reflection. Reflection from a simple glass sheet is around 4%, while it reaches about 6% for a plastic sheet. Although smartphones’ first surface is made of glass, their total reflection (without coating) is usually around 5% due to multiple reflections created by the complex optical stack.
Reflectance (SCI)
Measurements above show the reflection of the device within the visible spectrum range (400 nm to 700 nm). It includes both diffuse and specular reflection.
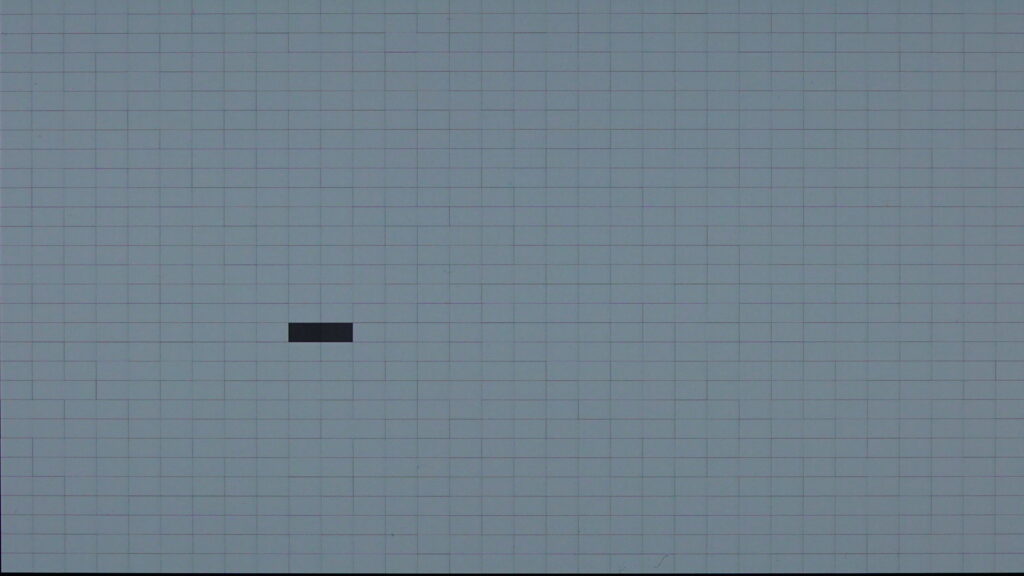
PWM Frequency Samsung Galaxy S24
480 Hz
Bad
Good
Bad
Great
Pulse width modulation is a modulation technique that generates variable-width pulses to represent the amplitude of an analog input signal. This measurement is important for comfort because flickering at low frequencies can be perceived by some individuals, and in the most extreme cases, can induce seizures. Some experiments show that discomfort can appear at a higher frequency. A high PWM frequency (>1500 Hz) tends to be less disturbing for users.
Temporal Light Modulation
This graph represents the frequencies of lighting variation; the highest peak gives the main flicker frequency. The combination of a low frequency and a high peak is susceptible to inducing eye fatigue. Displays flicker for 2 main reasons: refresh rate and Pulse Width Modulation. This measurement is important for comfort because flickering at low frequencies can be perceived by some individuals, and in the most extreme cases, can induce seizures. Some experiments show that discomfort can appear at a higher frequency. A high PWM frequency (>1500 Hz) tends to be safer for users.
Aliasing (closeup)
Samsung Galaxy S24
(Photos for illustration only)