We put the Samsung Galaxy S25 Ultra through our rigorous DXOMARK Camera test suite to measure its performance in photo, video, and zoom quality from an end-user perspective. This article breaks down how the device fared in a variety of tests and several common use cases and is intended to highlight the most important results of our testing with an extract of the captured data.
Overview
Key camera specifications:
- Primary: 200MP 1/1.3″ sensor, 24mm equivalent f/1.7-aperture lens, multi-directional PDAF, OIS
- Ultra-wide: 50MP sensor, 120˚ f/1.9-aperture lens, dual pixel PDAF, Super Steady video
- Tele 1: 10MP 1/3.52″ sensor, 67mm equivalent f/2.4-aperture lens, PDAF, OIS
- Tele 2: 50MP 1/2.52″ sensor, 111mm equivalent f/3.4-aperture lens, (periscope design), PDAF, OIS
Scoring
Sub-scores and attributes included in the calculations of the global score.
Samsung Galaxy S25 Ultra
Use cases & Conditions
Use case scores indicate the product performance in specific situations. They are not included in the overall score calculations.
Portrait
Portrait photos of either one person or a group of people
Outdoor
Photos & videos shot in bright light conditions (≥1000 lux)
Indoor
Photos & videos shot in good lighting conditions (≥100lux)
Lowlight
Photos & videos shot in low lighting conditions (<100 lux)
Zoom
Photos and videos captured using zoom (more than 1x)
Pros
- Good detail in zoom shots, especially at long range
- Good exposure and wide dynamic range in bright light video
- Good photo and video detail in most conditions
- Natural skin tones in non-challenging scenes
- Natural video color rendering with neutral white balance in bright light and indoors
The Samsung Galaxy S25 Ultra delivered a solid performance in the DXOMARK Camera tests but was unable to secure a position among the very best in our ranking. An upgraded chipset (Snapdragon 8 Elite vs Snapdragon 8 Gen 2) and a higher pixel count on the ultra-wide camera (50MP vs 12MP) aside, the camera hardware specifications are very similar to the predecessor Galaxy S24 Ultra. Imaging performance improvements over the predecessor were only modest, despite slight improvements in software processing and some additional AI features.
While the S25 Ultra maintained its predecessor’s solid overall image quality, some issues were noticeable. In bright light, our testers observed some slight highlight clipping. While the camera produced vivid colors with natural skin tones in most tested scenes, we noticed occasional white balance shifts that resulted in slight color casts especially in low light. Image noise was one of the S25 Ultra’s main areas for improvement, with grain particularly noticeable in high-contrast and low-light scenes. Our testers also observed some noise reduction instabilities across consecutive shots. In terms of detail, the S25 Ultra’s sharpness was slightly better than last year’s model in lowlight conditions. When tested under our new DXOMARK Camera v6 protocol, the Samsung Galaxy S25 Ultra revealed more clearly its limitations in meeting user preferences, particularly in challenging scenes. The device often produced low-contrast images, and its HDR processing occasionally failed, leading to inconsistent rendering of color, contrast, and noise. These shortcomings became even more noticeable in portrait photography, where skin tones shifts toward colder hues, such as pink or purple, particularly under mixed or difficult lighting. While the S25 Ultra performs well in many scenarios, these issues prevent it from consistently delivering the level of image quality expected from a flagship device, especially when compared to the best-in-class performers.
In our zoom tests, the Samsung stood out at long-range tele settings, but also provided good image quality at close and medium range. The new ultrawide camera with its higher resolution sensor matched the image quality of the predecessor.
Like for stills, the Samsung Galaxy S25 Ultra did not introduce any groundbreaking improvements in overall video performance. This said, video results remained strong. The camera was taking full advantage of its HDR capabilities to provide video footage with well-balanced highlights and shadows. In good light, video detail levels were high, with accurate exposure management and natural colors, making for an overall pleasant viewing experience. However, some struggles became apparent in dimmer conditions, with more intrusive noise, particularly in the shadows, and some quite pronounced color casts. Our testers also noticed objectionable autofocus and exposure adaptation instabilities. Video stabilization remained largely unchanged from the previous generation, providing a reliable experience. This said, it did not quite match the level of smoothness of the best-in-class iPhone 16 Pro Max.
While in low light, most photos were exposed well, but in some scenes, subjects could be slightly underexposed. Our testers also observed noise and detail inconsistencies between consecutive shots when shooting in low-light scenes. White balance was generally accurate but could appear unnatural at times under challenging illuminants. Overall, the camera provided good rendering but lacked consistency across lighting conditions, particularly in terms of noise and exposure accuracy.

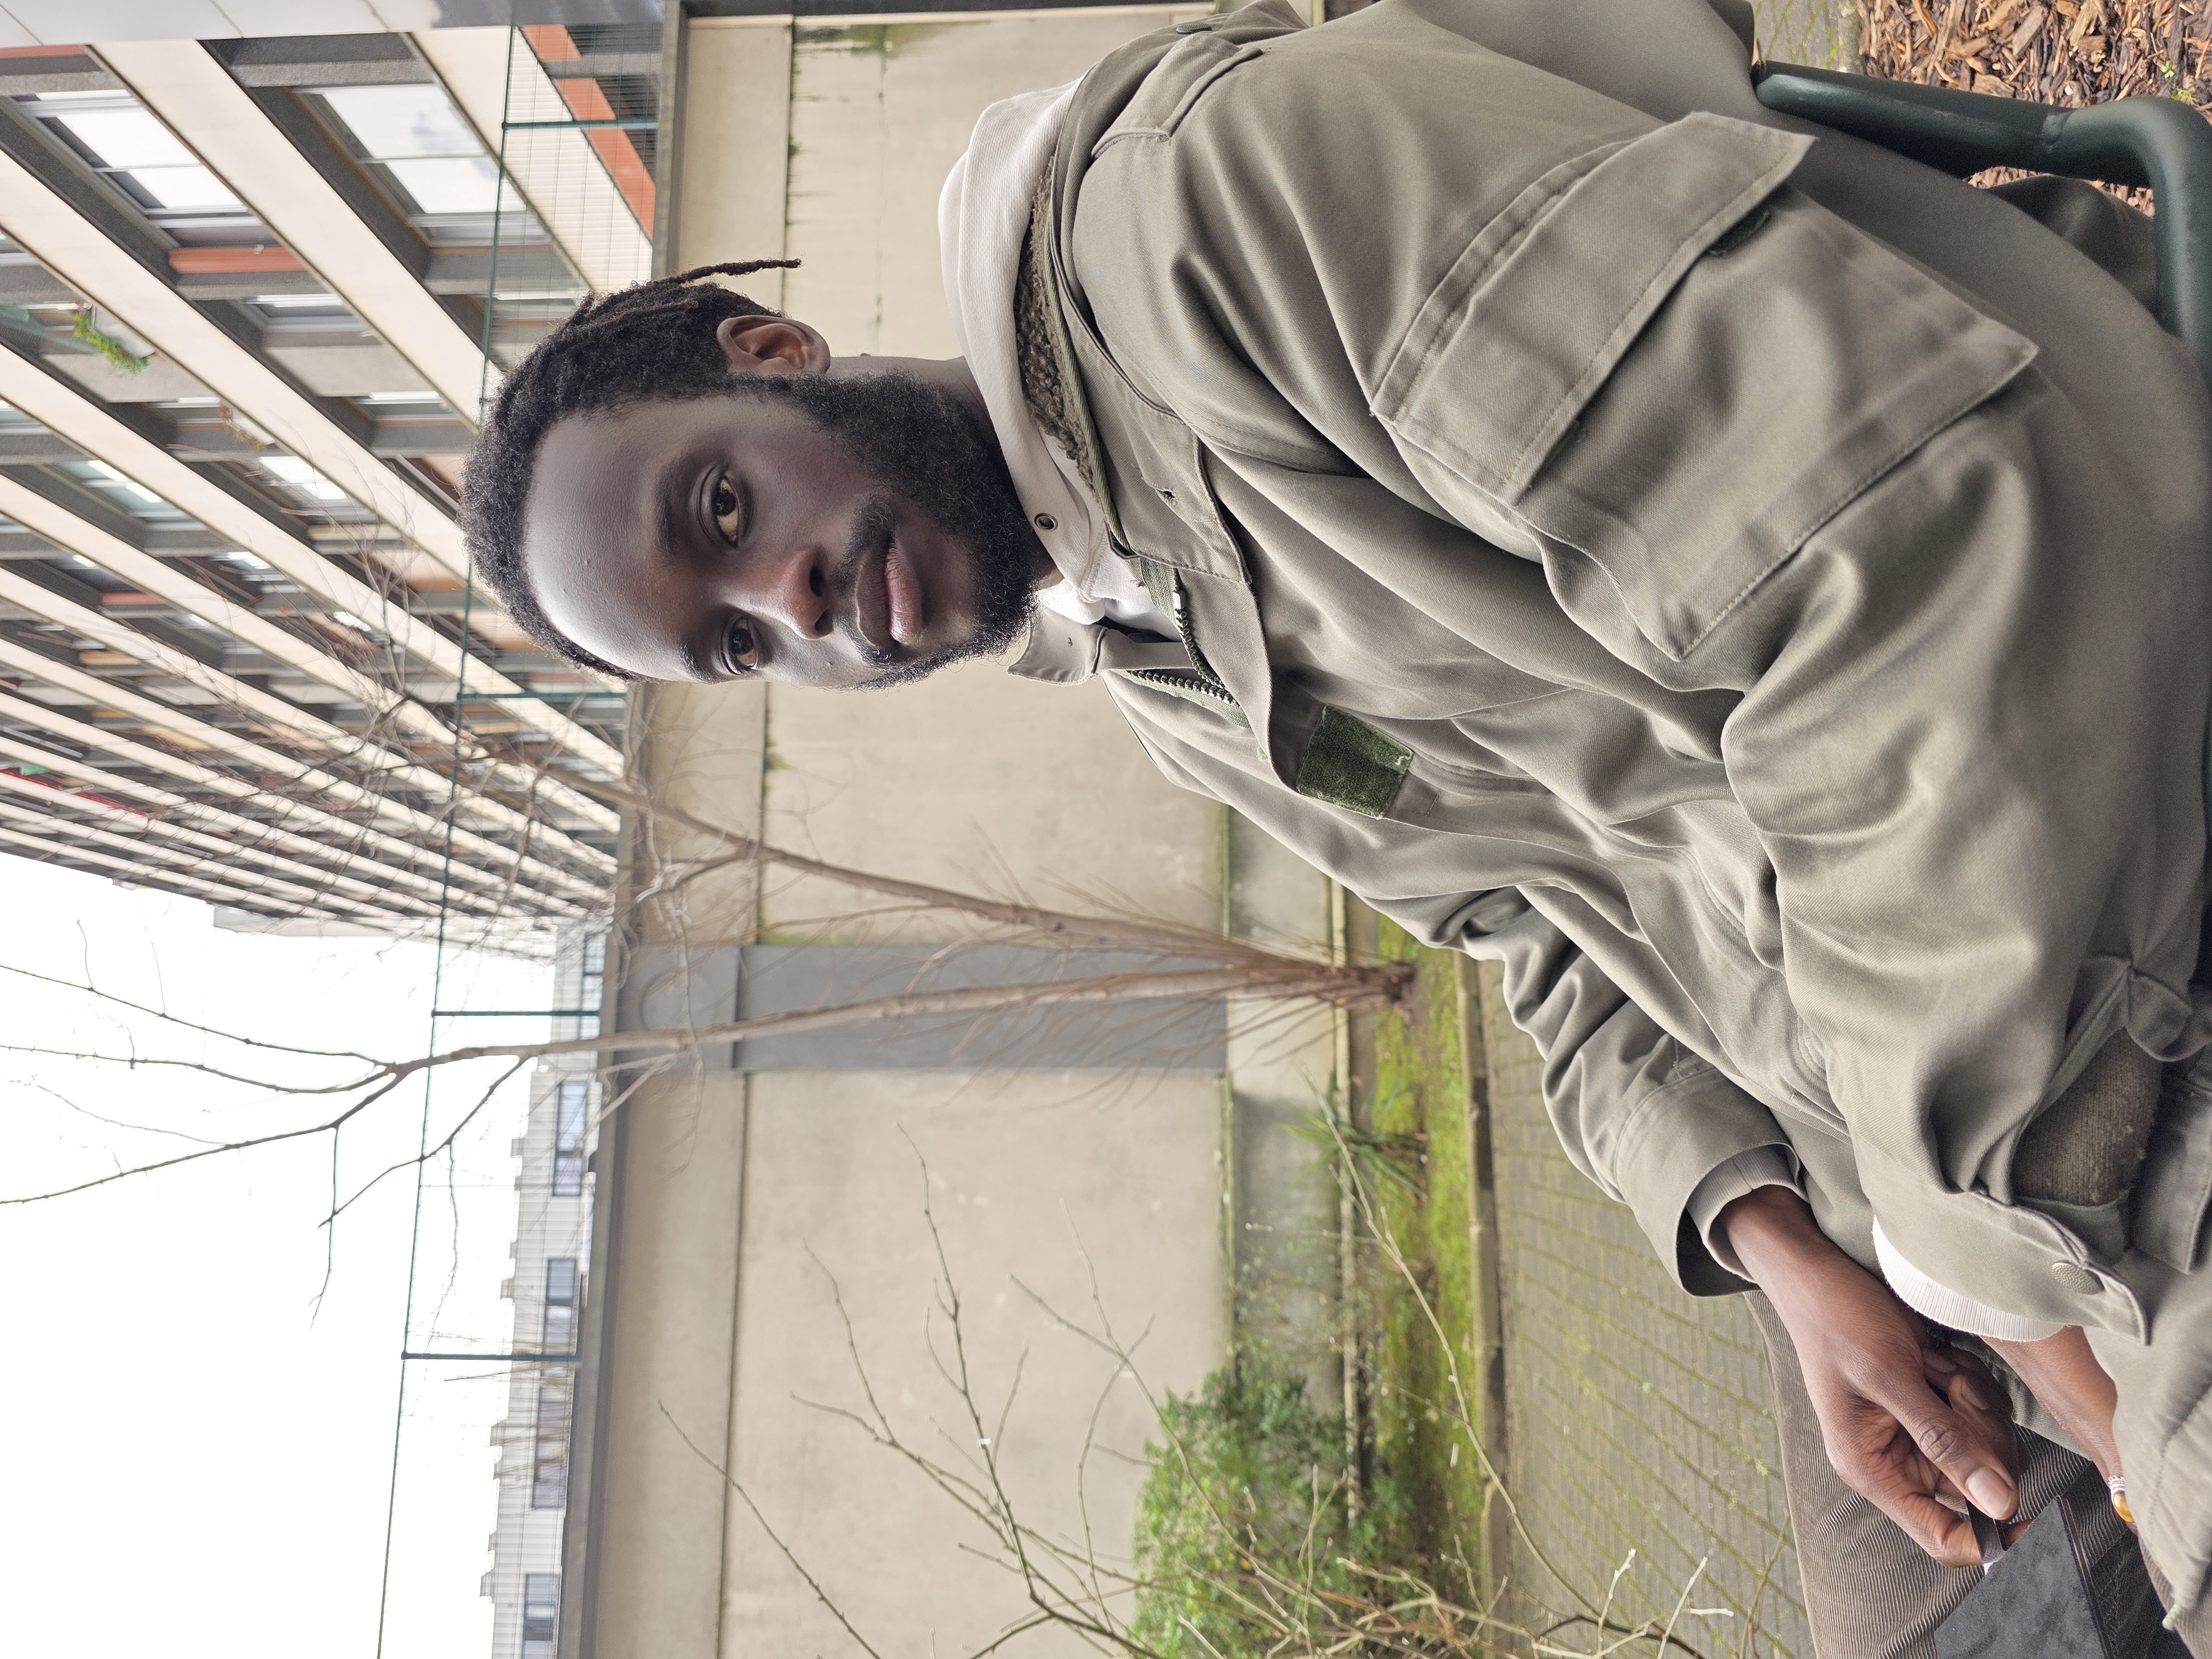
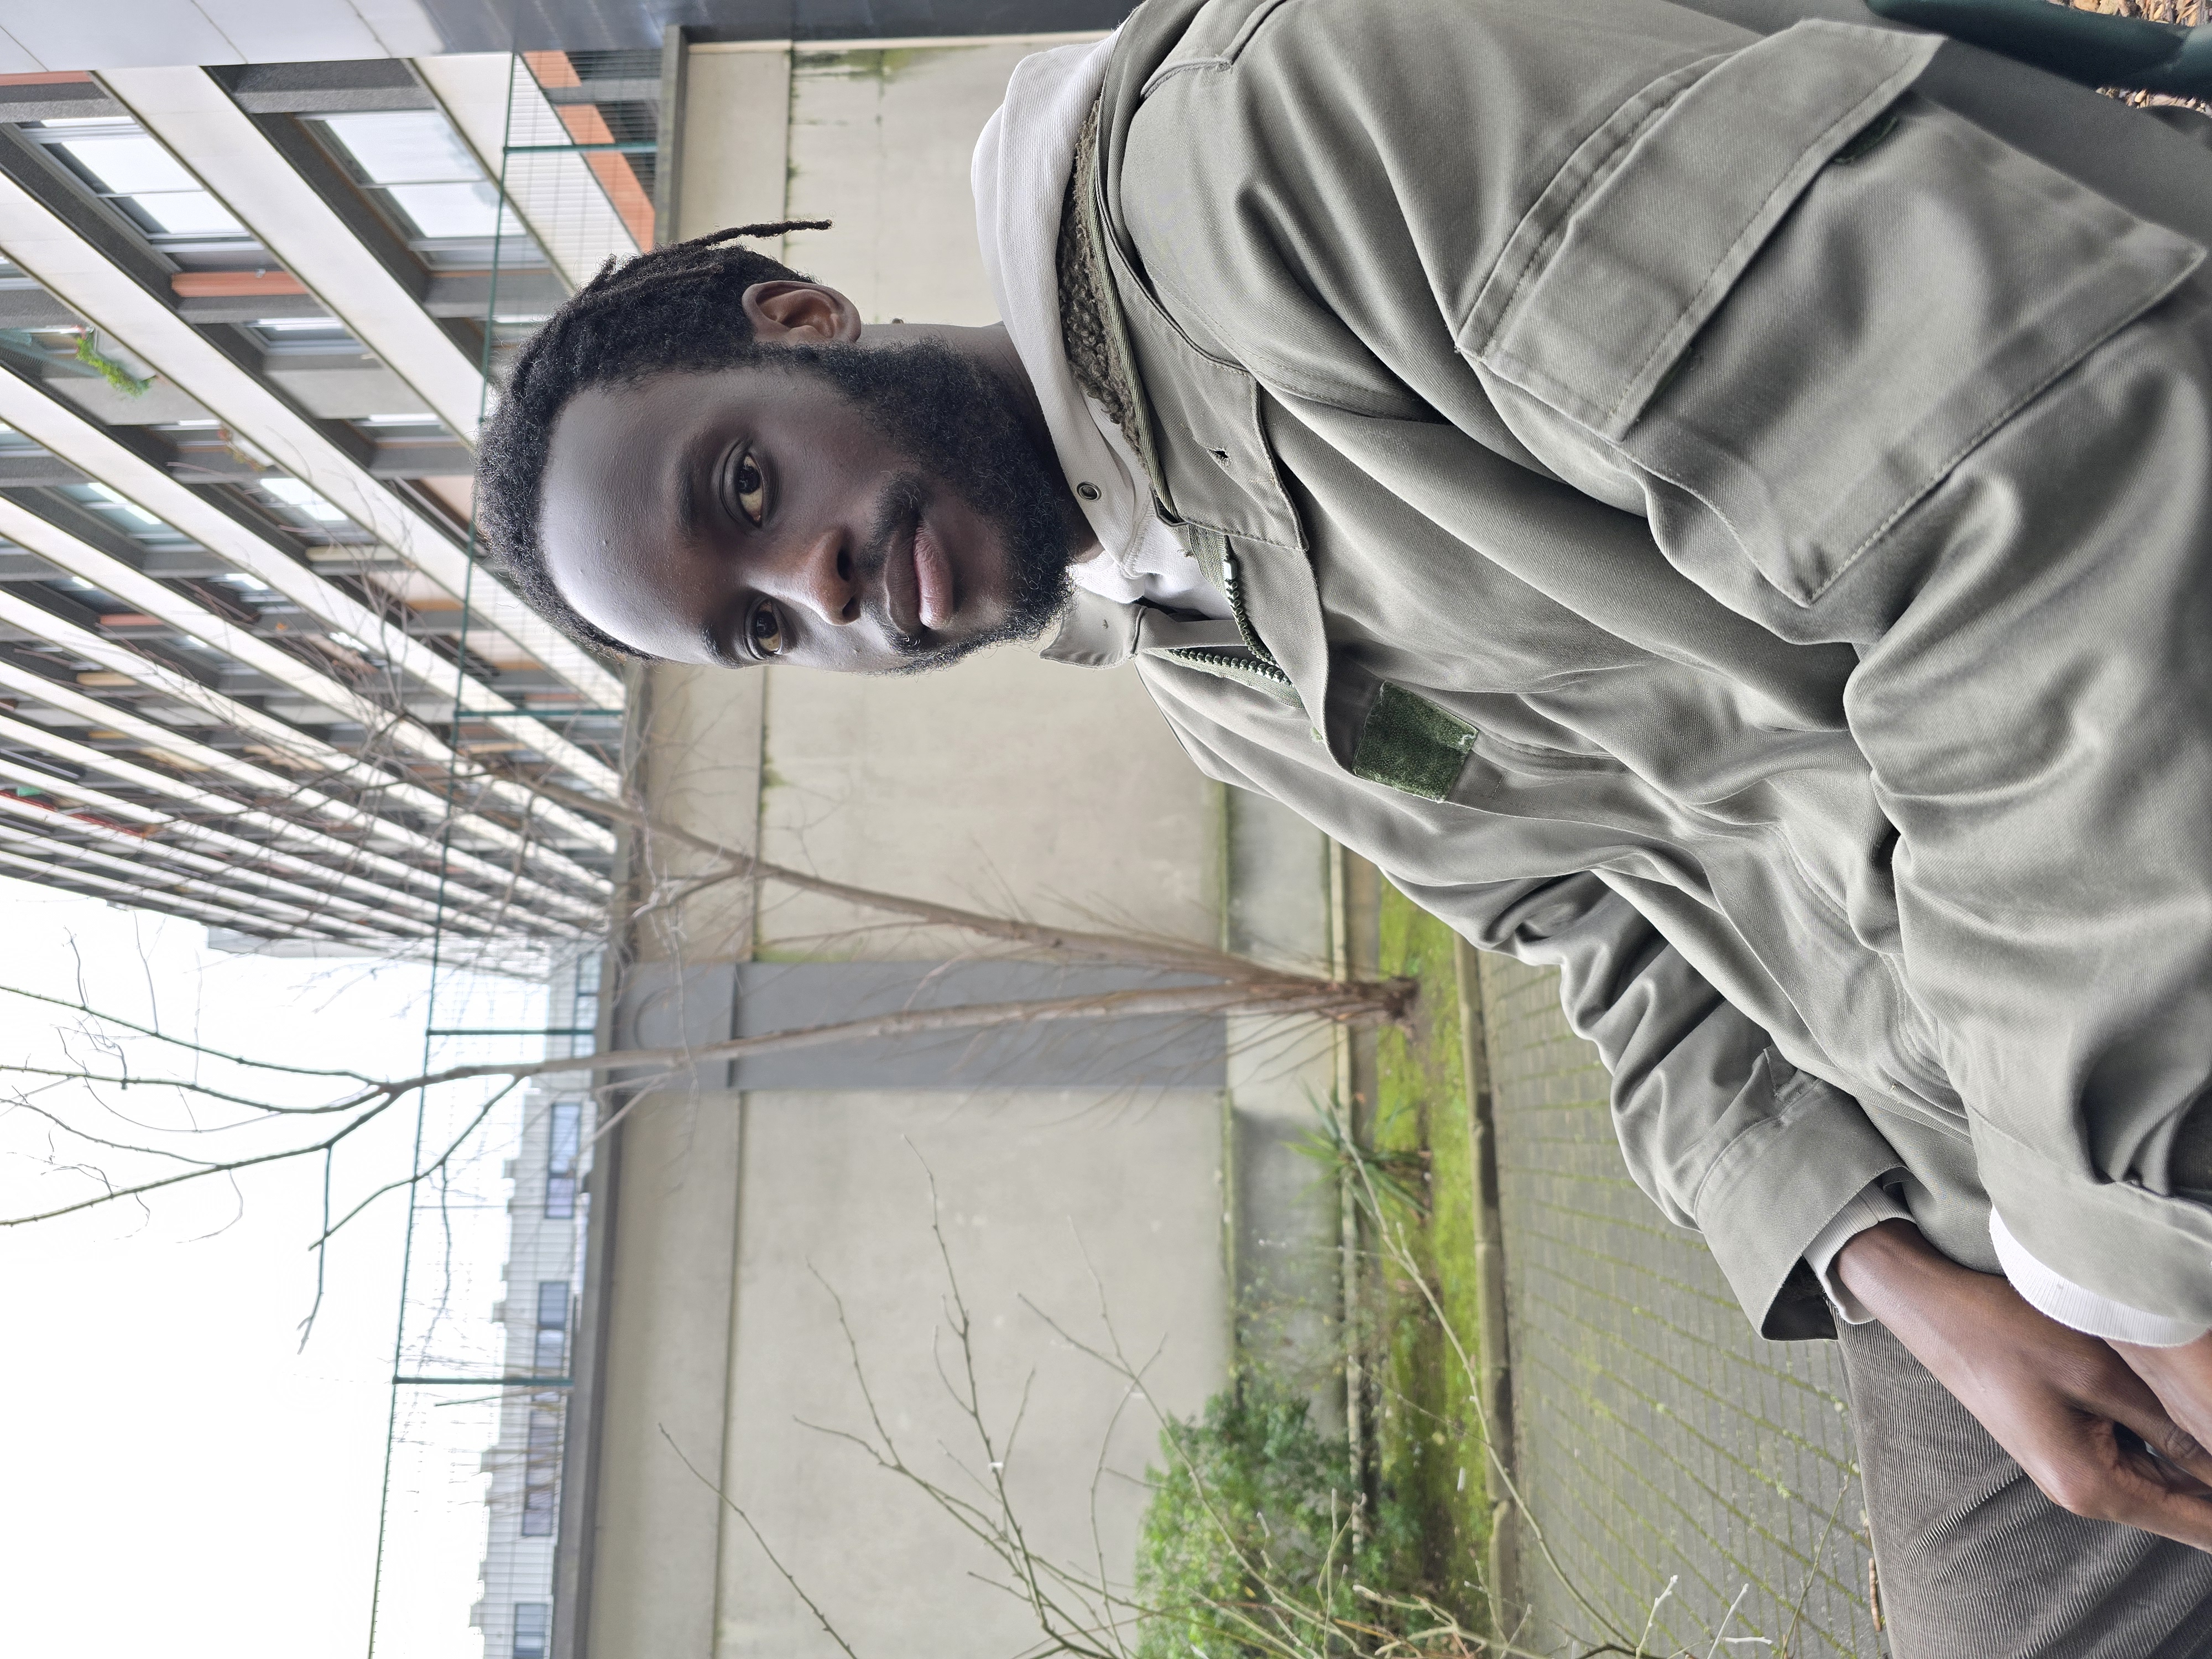
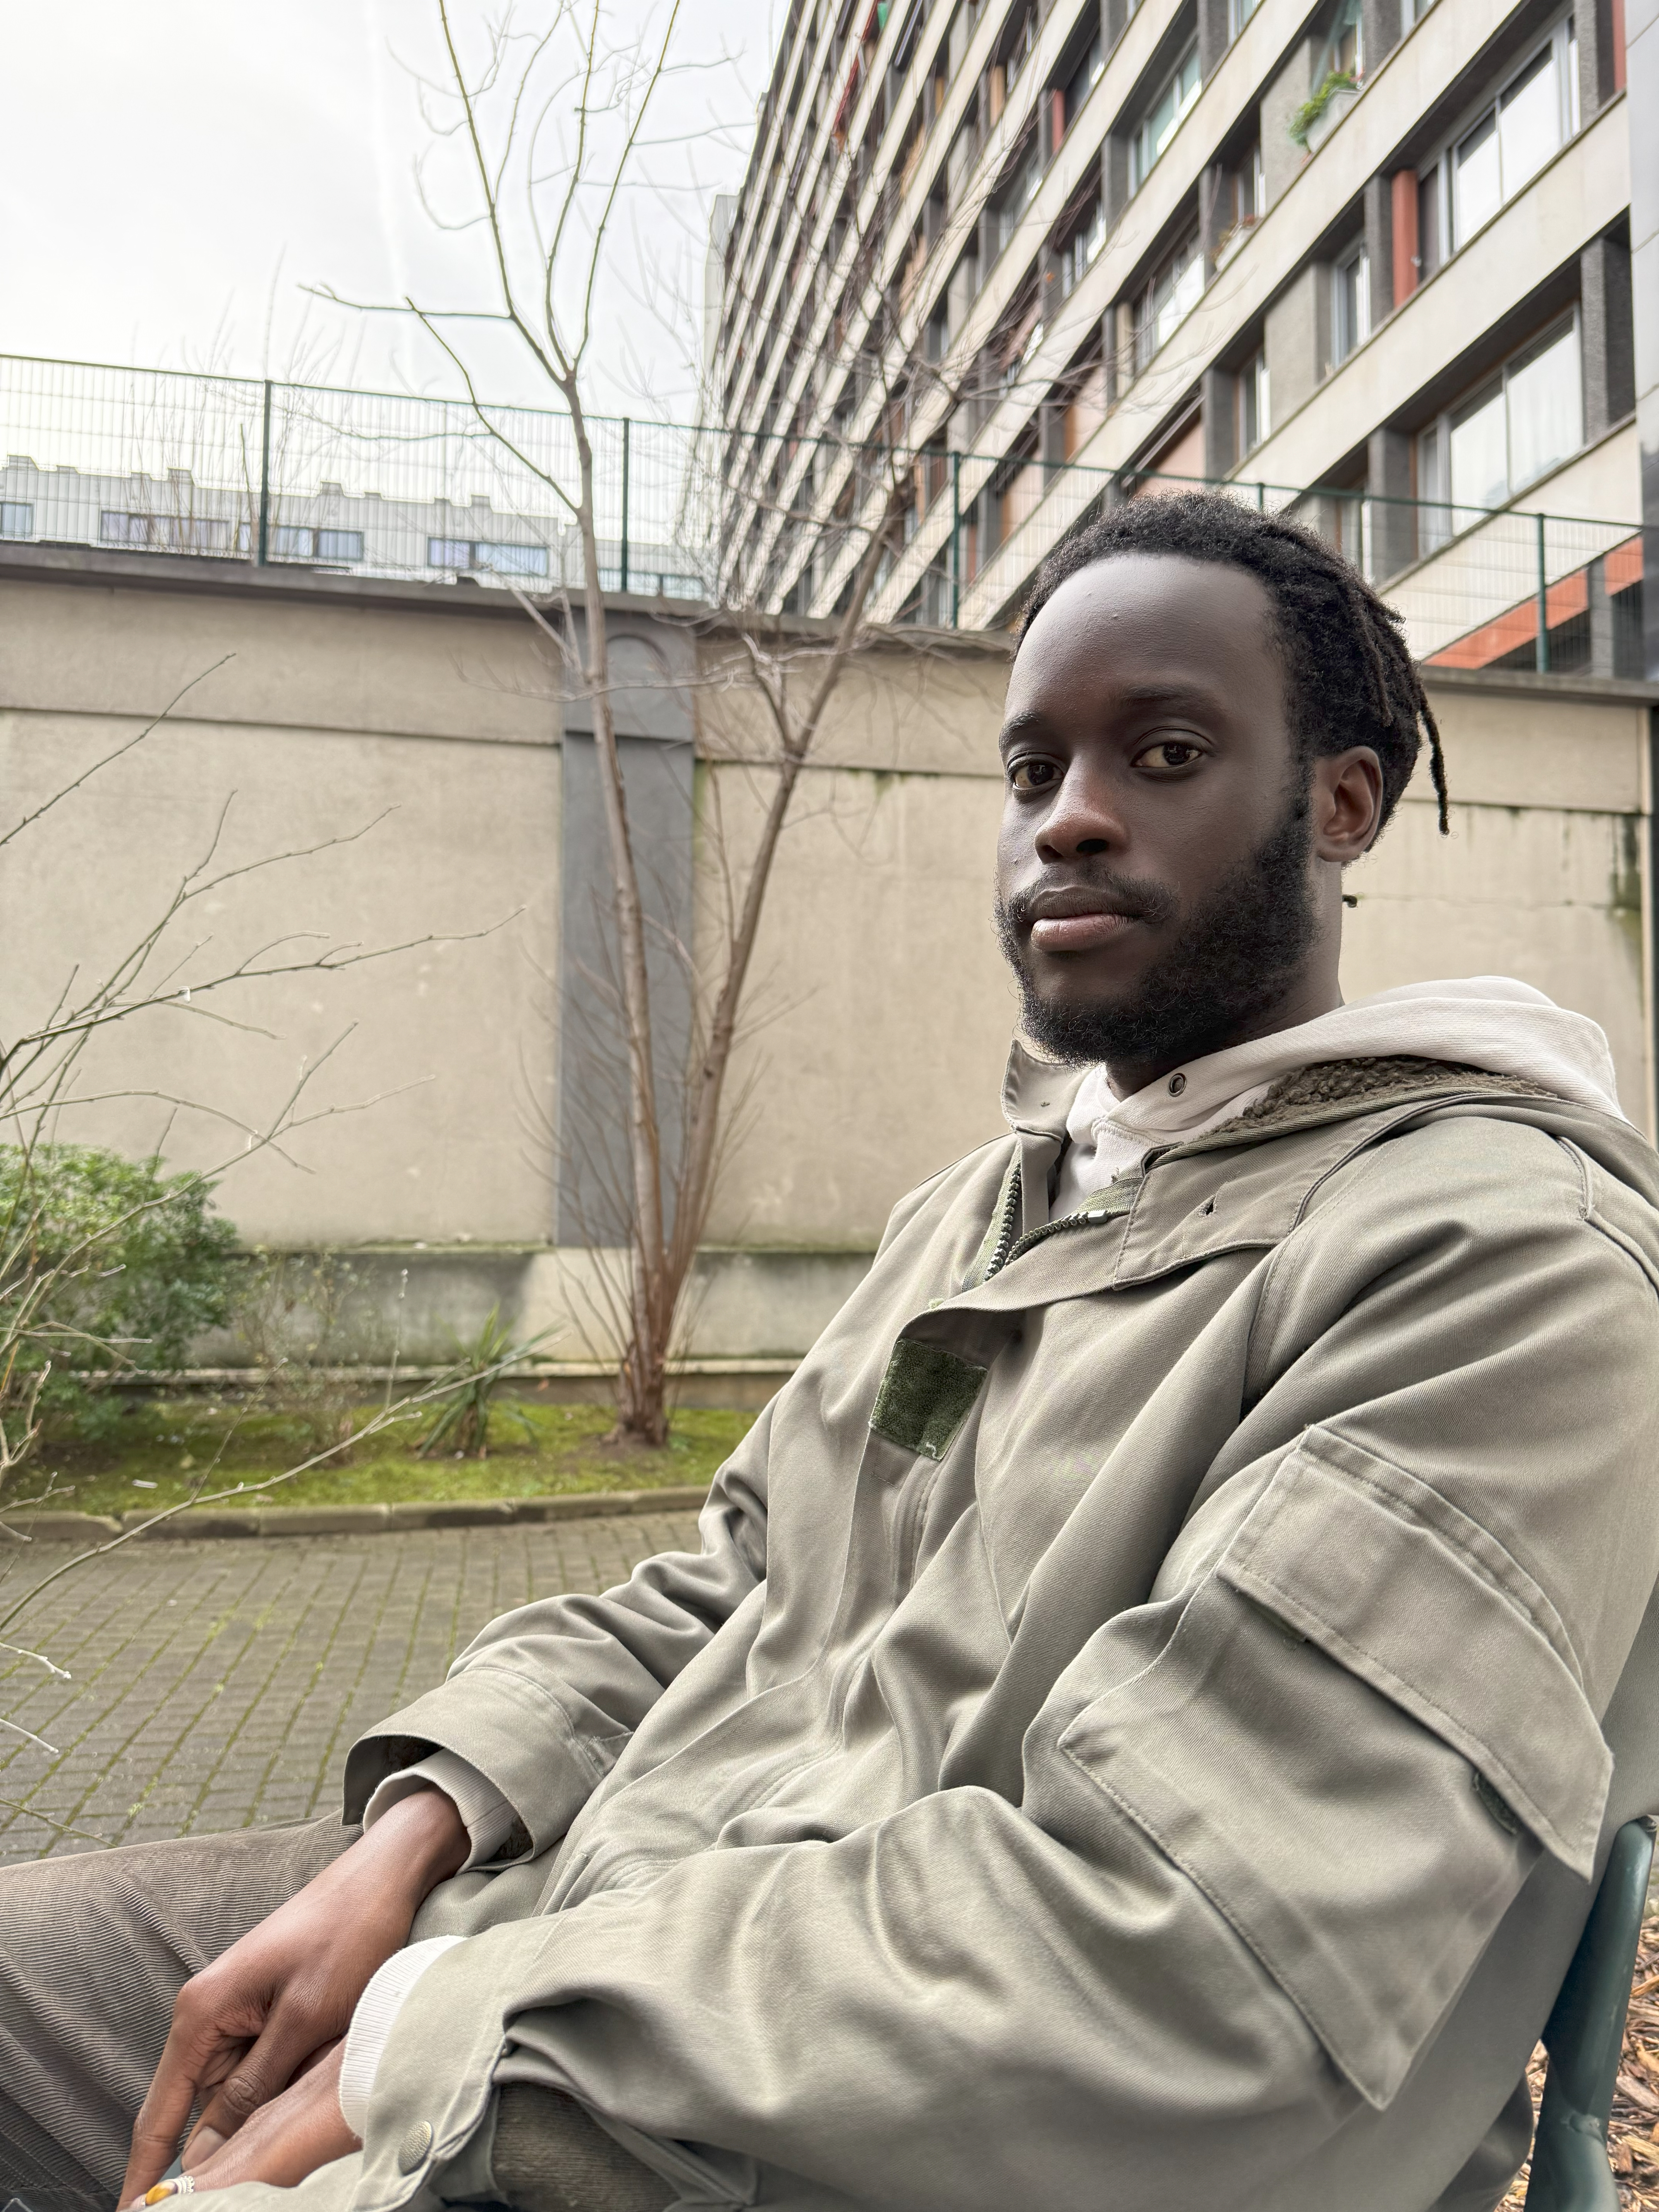
The Samsung Galaxy S25 Ultra delivers strong portrait photography performance across default, bokeh, and tele modes, with good subject detail, accurate edge detection, and versatile features like realistic blur effects and adjustable lighting. However, while results are generally pleasing, portrait images can sometimes appear flat due to low contrast, especially in challenging lighting conditions. Additionally, color rendering is not always consistent, with occasional skin tone shifts, affecting the natural look of the subject. In HDR scenes, visible processing artifacts may lead to contrast inconsistencies and tonal imbalances, particularly in high-dynamic-range backgrounds. Although the S25 Ultra performs well overall, when pushed in difficult portrait scenarios, it falls slightly behind top competitors such as the Oppo Find X8 Ultra, which maintains better tonal precision, color accuracy, and rendering stability under the same conditions.

The Samsung Galaxy S25 Ultra delivers impressive telephoto performance, leveraging its versatile periscope zoom system to provide sharp, detailed images at medium to long zoom levels (up to 10×). It maintains good texture and contrast, making it well-suited for capturing distant subjects and portraits with natural perspective compression. Autofocus is fast and reliable across zoom ranges. However, at the extreme telephoto end, some softness and noise become more noticeable, especially in low-light conditions, and fine detail retention can drop compared to competitors. Overall, the S25 Ultra’s telephoto module balances versatility and image quality effectively, though it occasionally falls short of the very best zoom performance found in rivals like the Oppo Find X8 Ultra and Xiaomi 15 Ultra.
Test summary
About DXOMARK Camera tests: DXOMARK’s camera evaluations take place in laboratories and real-world situations using a wide variety of use-cases. The scores rely on objective tests for which the results are calculated directly using measurement software in our laboratory setups, and on perceptual tests where a sophisticated set of metrics allow a panel of image experts to compare aspects of image quality that require human judgment. Testing a smartphone involves a team of engineers and technicians for about a week. Photo and Video quality are scored separately and then combined into an overall score for comparison among the cameras in different devices. For more information about the DXOMARK Camera protocol, click here. More details on smartphone camera scores are available here. The following section gathers key elements of DXOMARK’s exhaustive tests and analyses. Full performance evaluations are available upon request. Please contact us on how to receive a full report.
Photo
Samsung Galaxy S25 Ultra
180
For scoring and analysis, DXOMARK engineers capture and evaluate more than 3,800 test images in controlled lab environments as well as outdoor, indoor and low-light natural scenes, using the camera’s default settings. The photo protocol is designed to take into account the main use cases and is based on typical shooting scenarios, such as portraits, landscape and zoom photography. The evaluation is performed by visually inspecting images against a reference of natural scenes, and by running objective measurements on images of charts captured in the lab under different lighting conditions from 0.1 to 10,000+ lux and color temperatures from 2,300K to 6,500K.

Main
Samsung Galaxy S25 Ultra
184
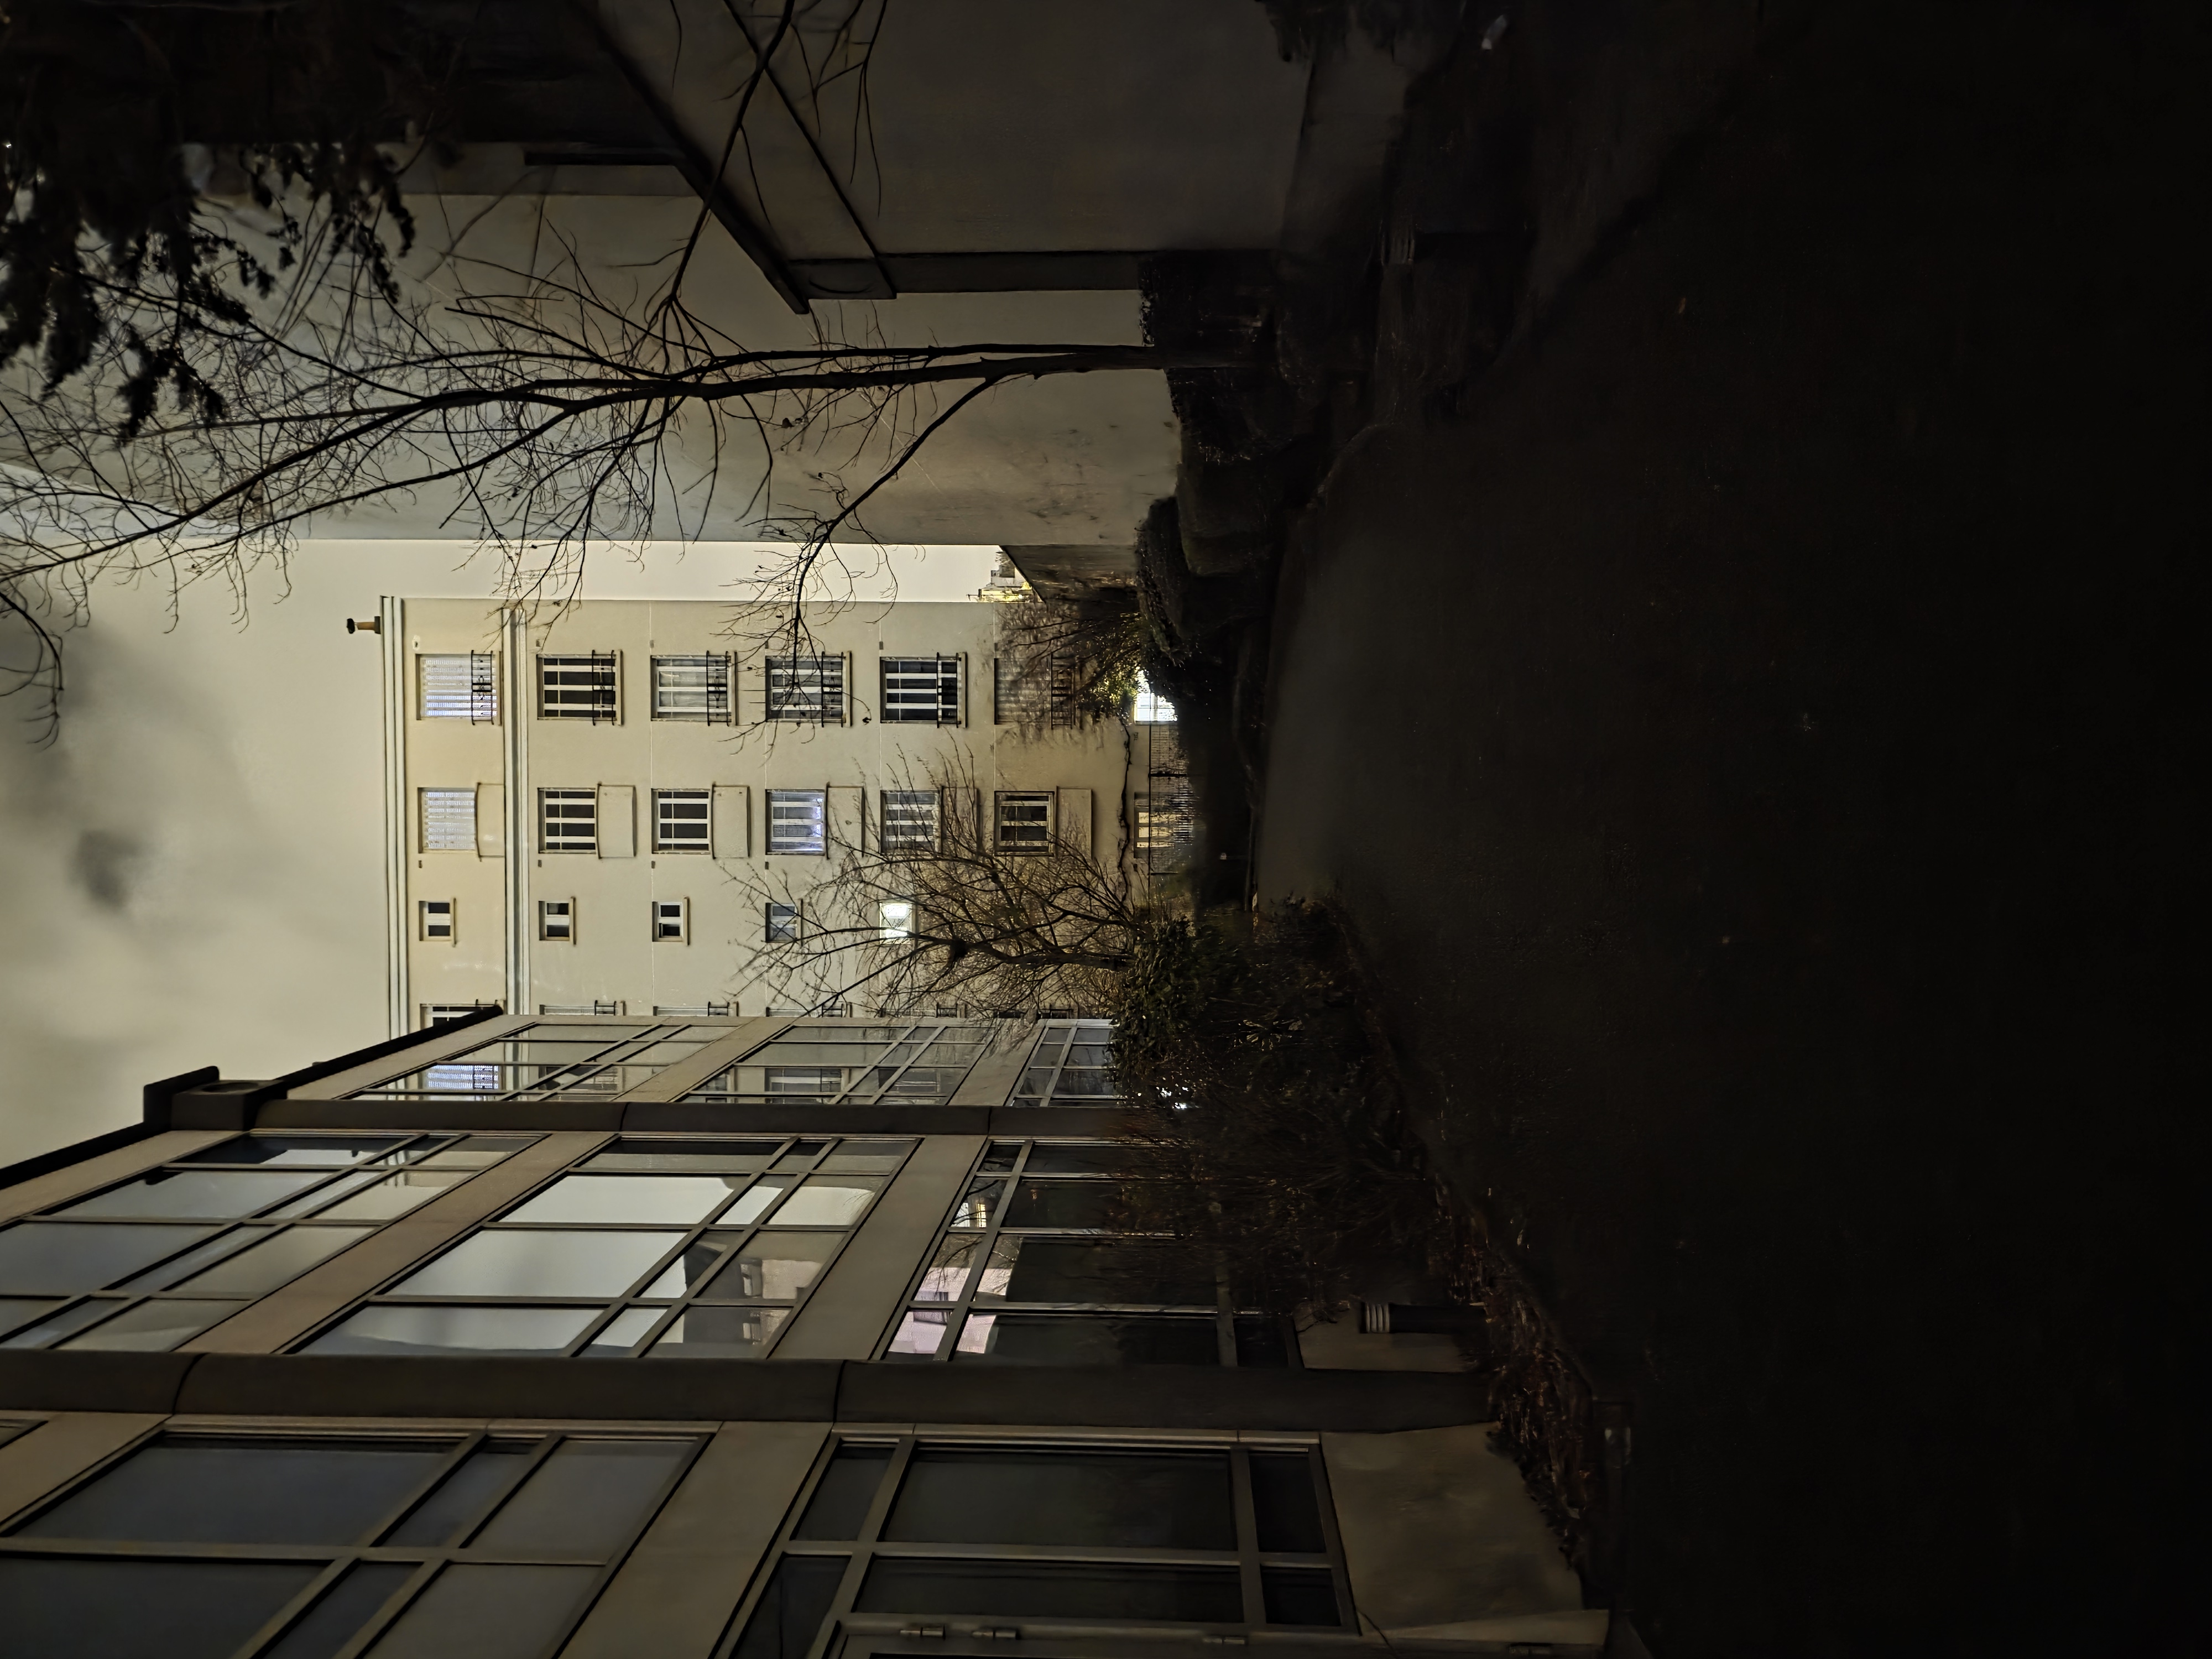
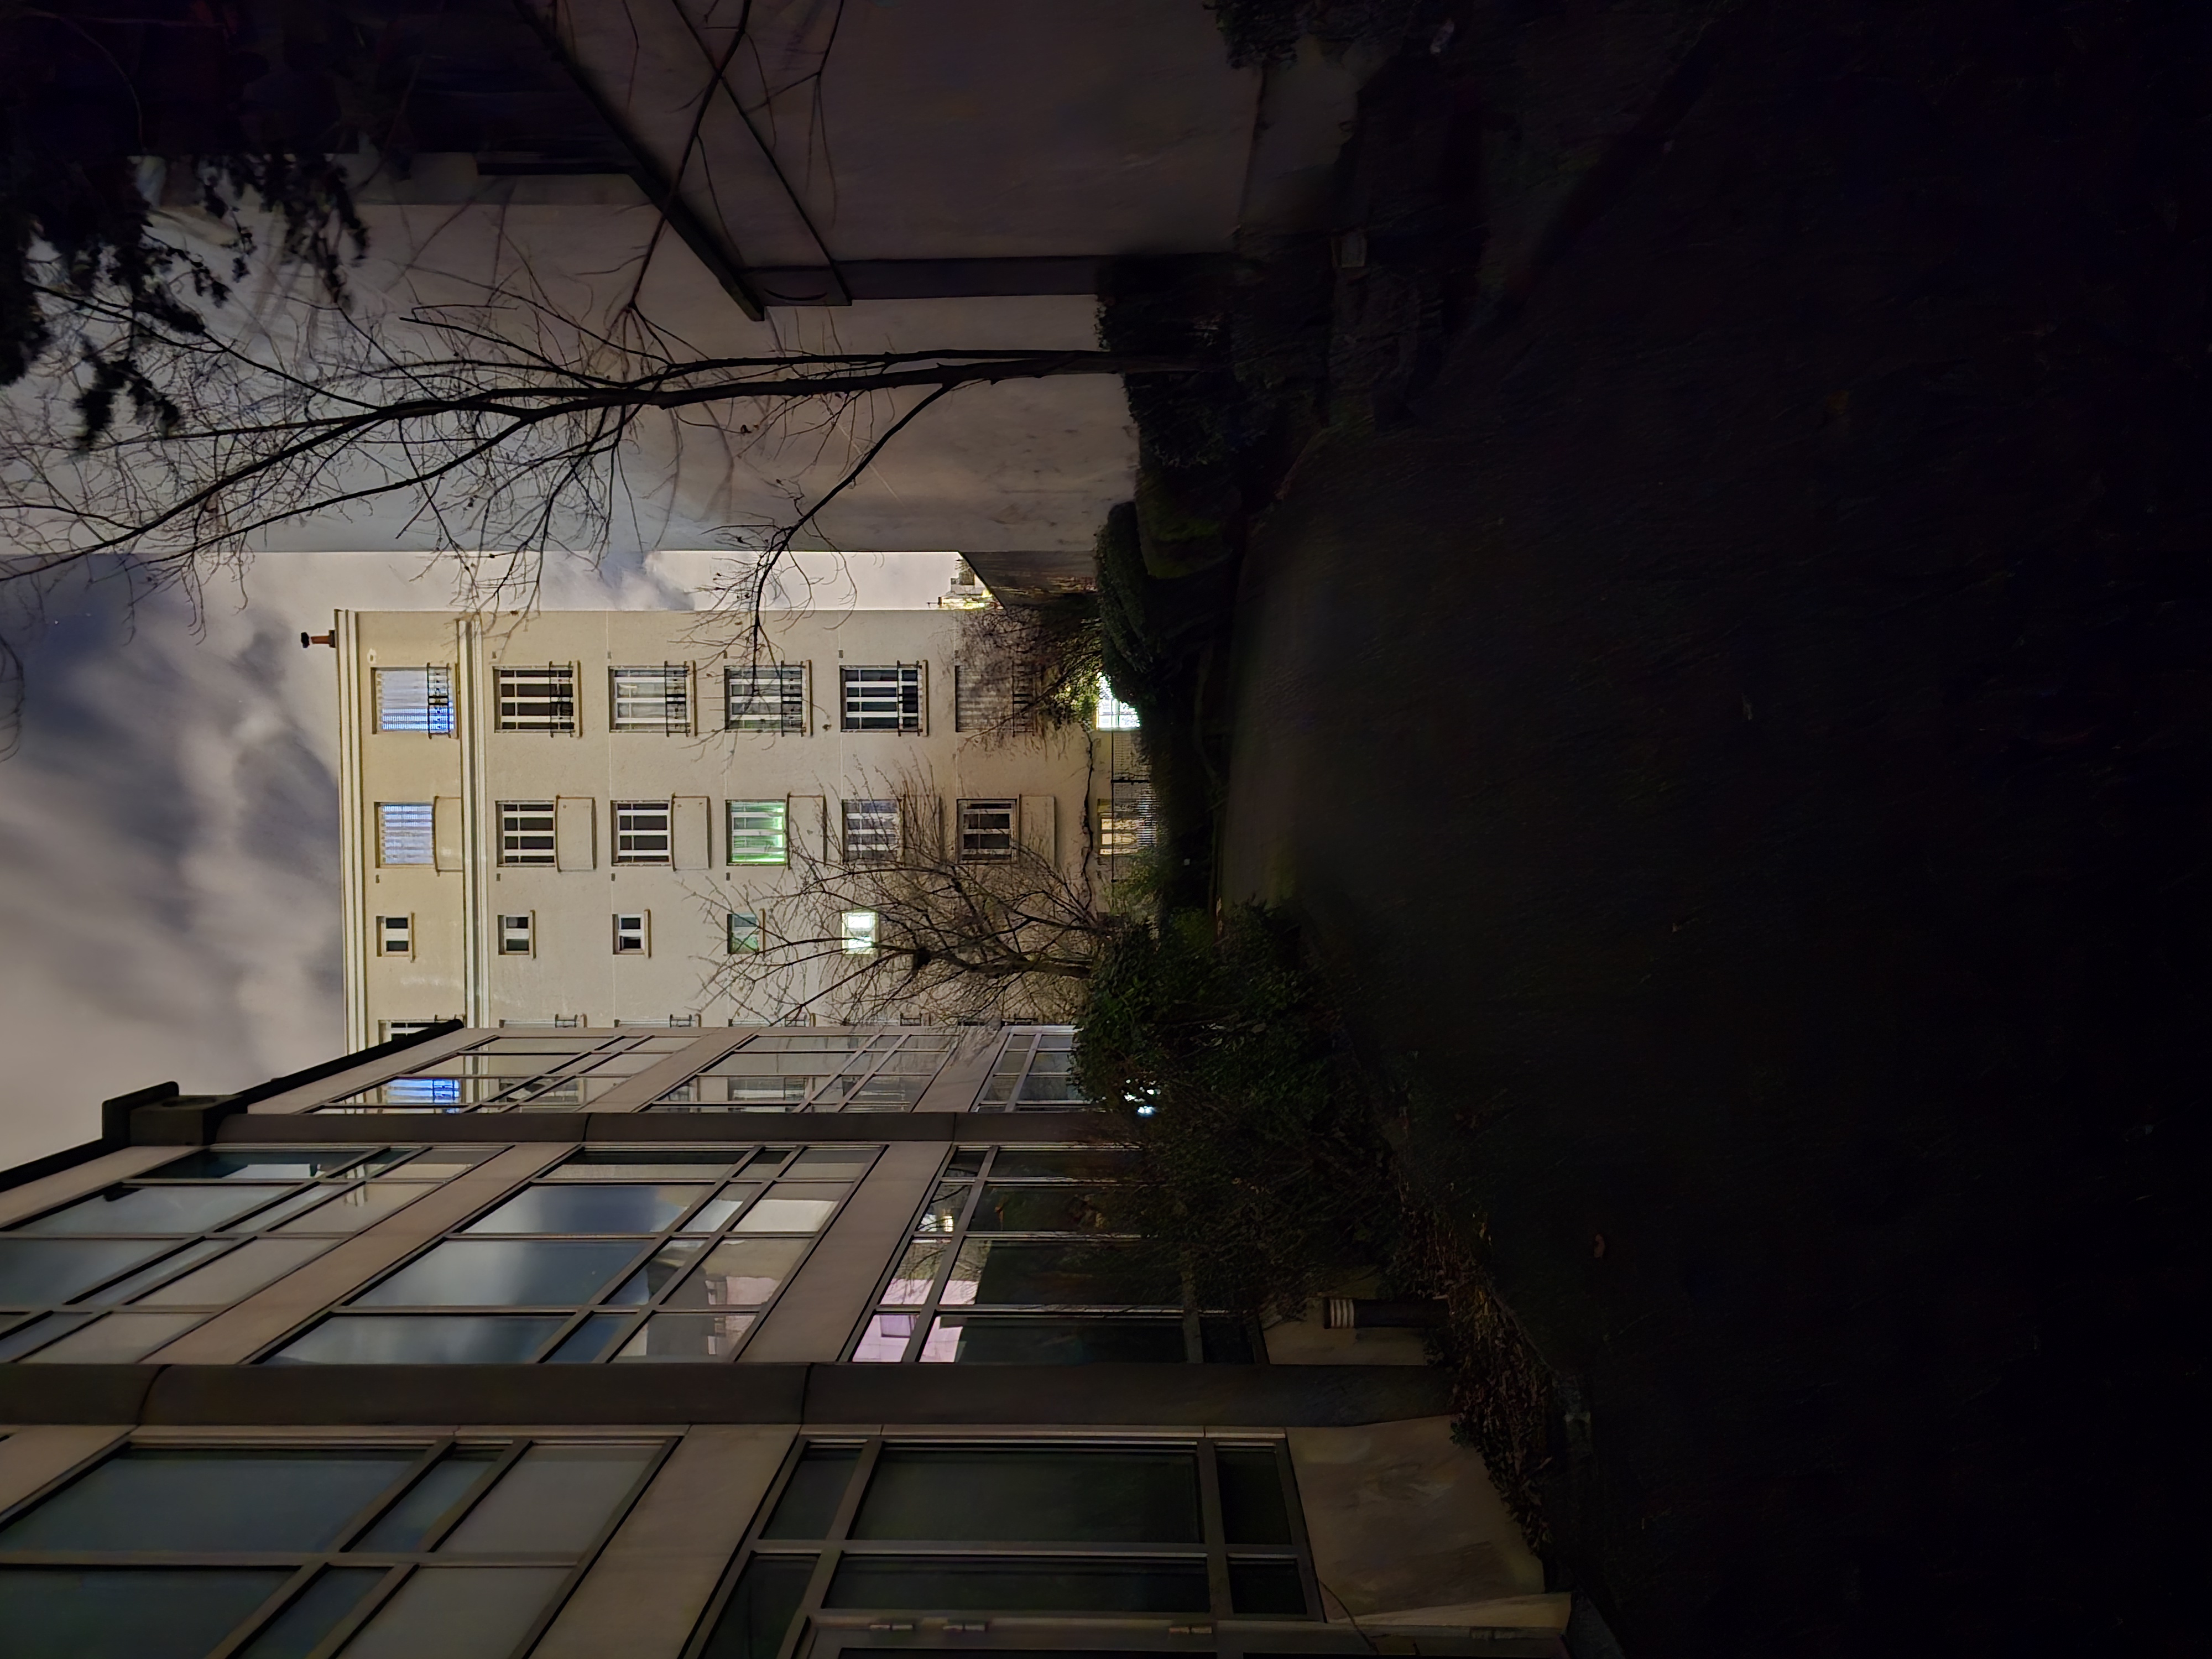
While the Samsung Galaxy S25 Ultra’s camera hardware remains largely unchanged from the S24 Ultra and the new model uses a very similar HDR rendering process as its predecessor, our testers did occasionally observe a slight performance regression on the new model, for example in terms of exposure and noise.
When viewed on a compatible display, the S25 Ultra’s HDR images were vibrant and pleasantly bright, with generally pleasant brightness in non-challenging scenes. However, highlight clipping could be more noticeable than on the S24 Ultra. White balance was neutral, but color casts could make an appearance, mostly in low-light or night scenes. Apart from some exceptions in low light and night conditions were it struggles to preserve fine details the S25 Ultra is usually able to retain texture from the scenes. However, image noise was more pronounced than on the predecessor, particularly in high-contrast scenes with strong backlighting.
Close-Up
The Samsung Galaxy S25 Ultra offers solid macro photography capabilities, allowing users to capture close-up shots with good detail and sharpness at short distances. Its autofocus system performs reliably in macro mode, helping to keep small subjects crisp and well-defined. Color reproduction remains natural, and noise is generally well-controlled in good lighting conditions. However, the device sometimes struggles with depth-of-field management in very close shots, occasionally resulting in parts of the subject falling out of focus. In challenging lighting or extremely tight macro scenarios, slight softness and noise can become more apparent.

Exposure
Samsung Galaxy S25 Ultra
134
Exposure is one of the key attributes for technically good pictures. The main attribute evaluated is the brightness level of the main subject through various use cases such as landscape, portrait, or still life. Other factors evaluated are the global contrast and the ability to render the dynamic range of the scene (ability to render visible details in both bright and dark areas). When the camera provides Photo HDR format, the images are analyzed with a visualization on an HDR reference monitor, under reference conditions specified in the ISO-22028-5 standard. Repeatability is also important because it demonstrates the camera's ability to provide the same rendering when shooting several images of the same scene.
The Samsung Galaxy S25 Ultra delivered a decent performance in the exposure category, benefiting from Samsung’s HDR format and image processing. Overall performance was close to the predecessor, but our testers noted a slight regression in certain scenes. For example, in challenging light conditions, highlight clipping was more noticeable. While colors appeared more vibrant, they occasionally veered towards being overly saturated, resulting in a slightly unnatural appearance in some instances.


Samsung Galaxy S25 Ultra 133
Color
Color is one of the key attributes for technically good pictures. The image quality attributes analyzed are skin-tone rendering, white balance, color shading, and repeatability. For color and skin tone rendering, we penalize unnatural colors according to results gathered in various studies and consumer insights while respecting the manufacturer's choice of color signature.
In terms of color rendering and white balance, our testers observed noticeable differences to the S24 Ultra, and the color reproduction has set debate over our Insights studies showing that a large set of panelists often rejected Samsung Galaxy S25 Ultra for its color reproduction. Colors were generally nice when capturing bright outdoor scenes, but color casts could result in a slightly unnatural look, especially in low light.
Samsung Galaxy S25 Ultra 135
Sharpness & Timing
Autofocus tests concentrate on focus accuracy, focus repeatability, shooting time delay, and depth of field. Shooting delay is the difference between the time the user presses the capture button and the time the image is actually taken. It includes focusing speed and the capability of the device to capture images at the right time, what is called 'zero shutter lag' capability. Even if a shallow depth of field can be pleasant for a single subject portrait or close-up shot, it can also be a problem in some specific conditions such as group portraits; Both situations are tested. Focus accuracy is also evaluated in all the real-life images taken, from infinity to close-up objects and in low light to outdoor conditions.
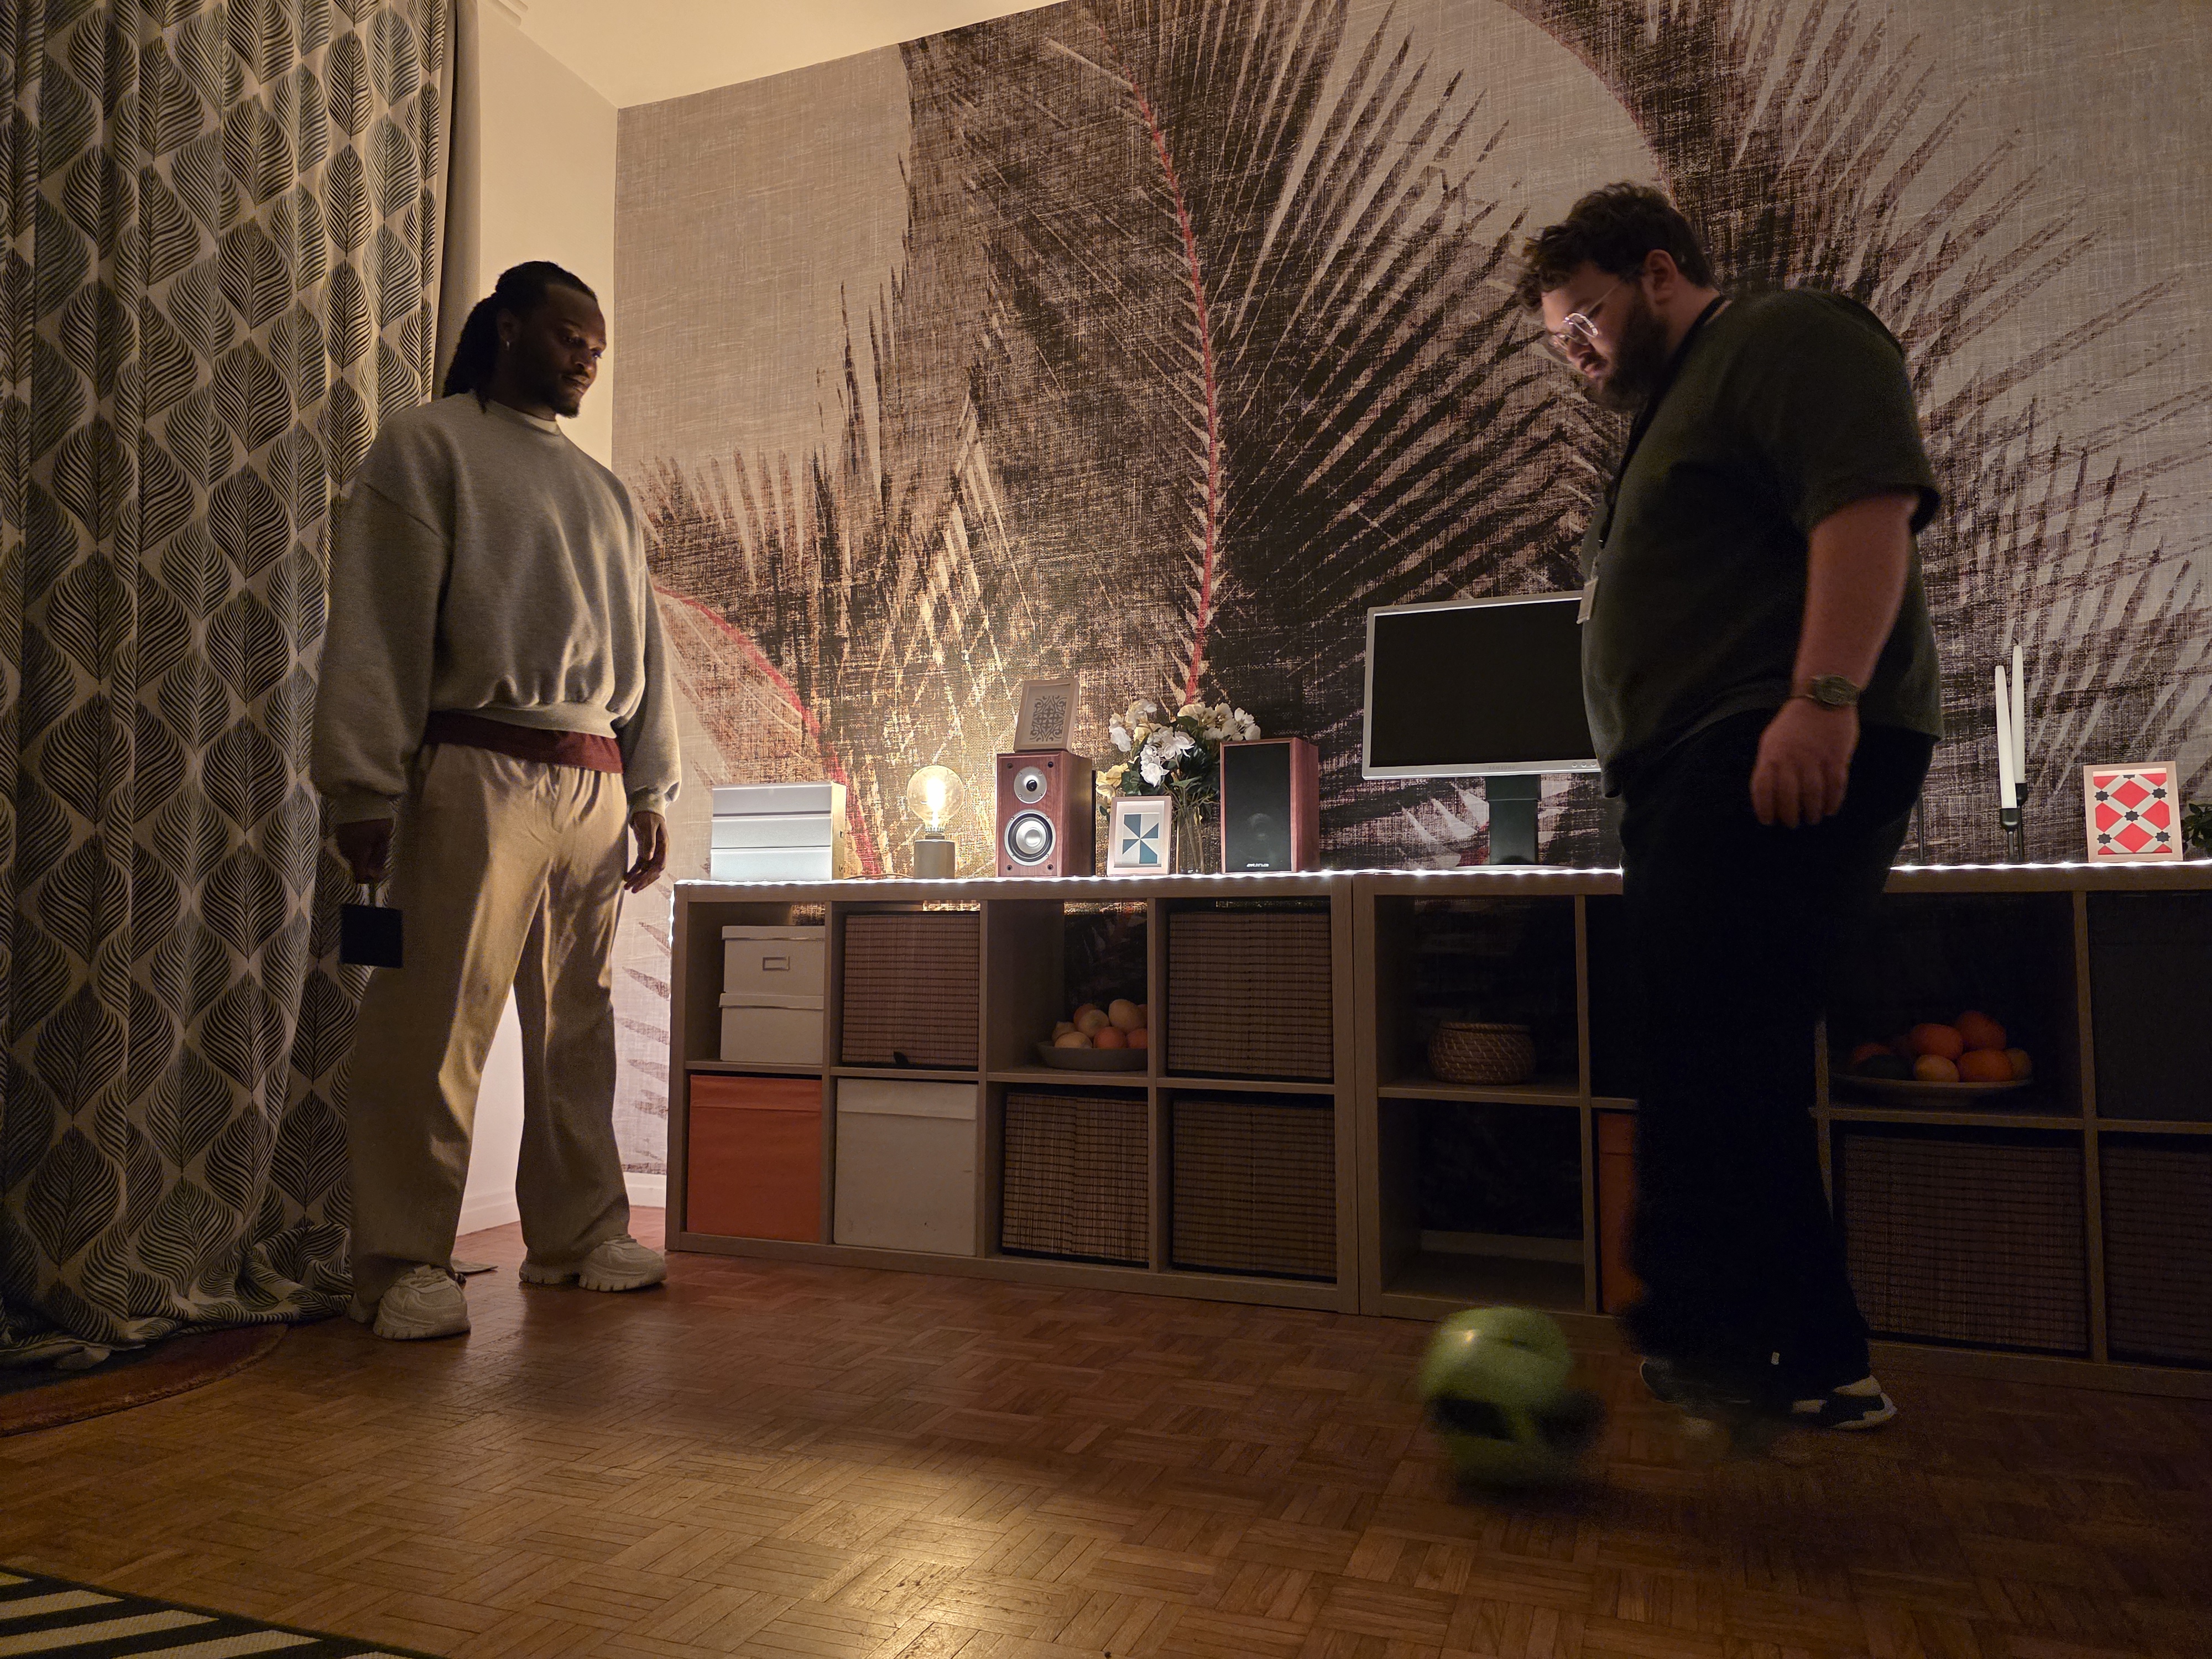
During autofocus testing, our experts noticed that the delay between pressing the shutter and capturing the image had been reduced when compared to the S24 Ultra, across a variety of shooting conditions but particularly in high-contrast scenes. The autofocus was precise and stable. However, the depth of field could occasionally be shallower than on the S24 Ultra, resulting in a blurrier middle plane (background model in the shots below) in some shots.
Samsung Galaxy S25 Ultra 132
Texture
Texture tests analyze the level of details and the texture of subjects in the images taken in the lab as well as in real-life scenarios. For natural shots, particular attention is paid to the level of details in the bright and dark areas of the image. Objective measurements are performed on chart images taken in various lighting conditions from 0.1 to 10,000+ lux and different kinds of dynamic range conditions. The charts used are the proprietary DXOMARK chart (DMC), and the Dead Leaves chart. We also have an AI based metric for the level of details on our realistic mannequins Eugene and Diana.
Overall, the level of detail captured by the S25 Ultra camera was quite comparable to the S24 Ultra. However, in some of our test scenes, the S25 Ultra preserved better detail, particularly in low light.


Noise
Samsung Galaxy S25 Ultra
129
Noise tests analyze various attributes of noise such as intensity, chromaticity, grain, structure on real-life images as well as images of charts taken in the lab. For natural images, particular attention is paid to the noise on faces, landscapes, but also on dark areas and high dynamic range conditions. Noise on moving objects is also evaluated on natural images. Objective measurements are performed on images of charts taken in various conditions from 0.1 to 10000 lux and different kinds of dynamic range conditions. The chart used is the Dead Leaves chart and the standardized measurement such as Visual Noise derived from ISO 15739.
In bright light, image noise was well under control. However, in scenes with strong backlighting and in low light, noise was more intrusive than on the S24 Ultra. In addition, our experts noticed unpleasant chroma noise and some noise reduction instabilities across consecutive shots of the same scene when shooting high-contrasted scenes.


Artifacts
Samsung Galaxy S25 Ultra
81
The artifacts evaluation looks at flare, lens shading, chromatic aberrations, geometrical distortion, edges ringing, halos, ghosting, quantization, unexpected color hue shifts, among others type of possible unnatural effects on photos. The more severe and the more frequent the artifact, the higher the point deduction on the score. The main artifacts observed and corresponding point loss are listed below.

Bokeh
Samsung Galaxy S25 Ultra
175
Bokeh is tested in one dedicated mode, usually portrait or aperture mode, and analyzed by visually inspecting all the images captured in the lab and in natural conditions. The goal is to reproduce portrait photography comparable to one taken with a DLSR and a wide aperture. The main image quality attributes paid attention to are depth estimation, artifacts, blur gradient, and the shape of the bokeh blur spotlights. Portrait image quality attributes (exposure, color, texture) are also taken into account.
Like the S24 Ultra, the S25 Ultra uses its short telephoto camera in bokeh mode. The longer focal length, with its compressed perspective, proves to be a better option for capturing portrait images when compared to the wide-angle lenses used by many competitors. In our tests, bokeh performance was very similar to that of its predecessor, with good subject isolation. This said, we found the feature to be somewhat unstable. The bokeh effect did not work every time.


Tele
Samsung Galaxy S25 Ultra
169
All image quality attributes are evaluated at focal lengths from approximately 40 mm to 300 mm, with particular attention paid to texture and detail. The score is derived from a number of objective measurements in the lab and perceptual analysis of real-life images.
The Samsung Galaxy S25 Ultra features a dual optical zoom setup, with 3x and 5x magnifications. In our zoom tests, the Samsung provided reliable image quality at close and medium range settings. Long range was exceptional, capturing high levels of detail, especially when shooting in bright light. In low light conditions, noise could be quite noticeable, though. When using the tele zoom, performance was generally good at close and medium-range settings, but in some scenes, our testers noticed a slight lack of detail. The device really started to shine after switching to the 5x zoom module. This is when long-range performance significantly improved, delivering very good texture and clarity in distant subjects when shooting in bright conditions.


Samsung Galaxy S25 Ultra 169
UltraWide
These tests analyze the performance of the ultra-wide camera at several focal lengths from 12 mm to 20 mm. All image quality attributes are evaluated, with particular attention paid to such artifacts as chromatic aberrations, lens softness, and distortion. Pictures below are an extract of tested scenes.
The Samsung Galaxy S25 Ultra features a new 50MP ultra-wide camera that maintains the same field of view as on previous models. In our tests, the image output was very similar to the S24 Ultra in terms of exposure and color, but we noticed that noise on the other hand was managed better and less intrusive, especially when shooting indoors or in low light. The device does not always get the best of its new 50MP sensor, and some images in bright light conditions actually showed a level of detail very close to what was seen on S24 Ultra.


Samsung Galaxy S25 Ultra 172Video
DXOMARK engineers capture and evaluate almost 3 hours of video in controlled lab environments and in natural low-light, indoor and outdoor scenes, using the camera’s default settings. The evaluation consists of visually inspecting natural videos taken in various conditions and running objective measurements on videos of charts recorded in the lab under different conditions from 0.1 to 10000+ lux and color temperatures from 2,300K to 6,500K.
Main
Samsung Galaxy S25 Ultra
186
The Samsung S25 Ultra offers a range of video resolutions and frame rates, including 8K at 24/30fps, 4K at 30/60/120fps, and 1080p at 30/60/240fps. Additionally, it supports 10-bit HDR, in HDR10 HLG format, unlike its predecessor, which offered HDR10+ PQ format. Our tests were performed at 4K resolution, 60fps and with HDR10 activated. Overall quality was good, offering a wide dynamic range and neutral, accurate colors when recording in bright light. However, some noise became noticeable in low light, as well as some occasional undesirable autofocus and exposure instabilities.
Exposure
Samsung Galaxy S25 Ultra
130
Exposure tests evaluate the brightness level of the main subject, the global contrast and the ability to render the dynamic range of the scene (ability to render visible details in both bright and dark areas). When the camera provides Video HDR format, the videos are analyzed with a visualization on an HDR reference monitor, under reference conditions specified in the metadata. Stability and temporal adaption of the exposure are also analyzed.
In our video tests, the Samsung Galaxy S25 Ultra delivered accurate target exposure on faces across a variety of light conditions, ensuring well-balanced brightness levels in most scenes. Dynamic range was wide, effectively preserving detail in both highlight and shadow portions of the frame. However, in particularly challenging high-contrast scenes, slight highlight clipping could be noticeable. Additionally, exposure adaptation when transitioning between different lighting conditions could occasionally be abrupt.
Color
Samsung Galaxy S25 Ultra
131
Image-quality color analysis looks at color rendering, skin-tone rendering, white balance, color shading, stability of the white balance and its adaption when light is changing.
The Samsung Galaxy S25 Ultra provided neutral white balance and accurate color rendering in bright light, ensuring natural and well-balanced tones. White balance remained stable across various scenes, contributing to color consistency and pleasant skin tone rendering. However, in low light, a slight warm color cast could be noticeable, along with a mild desaturation. This could impact overall color vibrancy in darker scenes.
Sharpness & Timing
Samsung Galaxy S25 Ultra
124
For video, autofocus tests concentrate on focus accuracy, focus stability and analysis of convergence regarding speed and smoothness.
The Samsung Galaxy S25 Ultra features a responsive and precise autofocus system, ensuring accurate focus on faces in bright light conditions. In our tests, the autofocus was generally fast, providing sharp and well-defined subjects. However, in low light, our testers noticed occasional autofocus failures, with the focus sometimes locking onto the wrong target. We also observed some focus stepping, resulting in less smooth transitions than on some competitors.
Texture
Samsung Galaxy S25 Ultra
118
Texture tests analyze the level of details and texture of the real-life videos as well as the videos of charts recorded in the lab. Natural videos recordings are visually evaluated, with particular attention paid to the level of details in the bright and areas as well as in the dark. Objective measurements are performed of images of charts taken in various conditions from 0.1 to 10000 lux. The charts used are the DXOMARK chart (DMC) and Dead Leaves chart.
The Samsung Galaxy S25 Ultra captured very good detail when recording in bright light, preserving fine textures and intricate details with high accuracy. Sharpness was well-balanced, providing a natural look without excessive processing. However, in low light, some artifacts with local floating texture could become visible, slightly affecting the overall image quality in darker scenes.
Noise
Samsung Galaxy S25 Ultra
129
Noise tests analyze various attributes of noise such as intensity, chromaticity, grain, structure, temporal aspects on real-life video recording as well as videos of charts taken in the lab. Natural videos are visually evaluated, with particular attention paid to the noise in the dark areas and high dynamic range conditions. Objective measurements are performed on the videos of charts recorded in various conditions from 0.1 to 10000 lux. The chart used is the DXOMARK visual noise chart.
Video noise was well under control and pretty much not noticeable in bright light. However, noise became more intrusive when recording low-light scenes, appearing stronger than on the S24 Ultra. This could impact image quality in darker scenes, particularly in areas of plain color or in the shadow portions of the frame.

Stabilization
Samsung Galaxy S25 Ultra
124
Stabilization evaluation tests the ability of the device to stabilize footage thanks to software or hardware technologies such as OIS, EIS, or any others means. The evaluation looks at residual motion, smoothness, jello artifacts and residual motion blur on walk and run use cases in various lighting conditions. The video below is an extract from one of the tested scenes.
The Samsung Galaxy S25 Ultra offered very good video stabilization when holding the camera still and when in motion during recording. Camera shake was effectively counteracted, resulting in smooth footage. However, slight residual camera motion could still be observed and overall stabilization performance was similar to the S24 Ultra. While the Samsung’s stabilization was reliable, it was not as impressive as on the latest iPhone models, especially with more dynamic camera motion.
Artifacts
Samsung Galaxy S25 Ultra
89
Artifacts are evaluated with MTF and ringing measurements on the SFR chart in the lab as well as frame-rate measurements using the LED Universal Timer. Natural videos are visually evaluated by paying particular attention to artifacts such as aliasing, quantization, blocking, and hue shift, among others. The more severe and the more frequent the artifact, the higher the point deduction from the score. The main artifacts and corresponding point loss are listed below.
UltraWide
Samsung Galaxy S25 Ultra
148
All image quality attributes are evaluated at focal lengths from approximately 12 mm to 30 mm, with particular attention paid to texture and smoothness of the zooming effect. The score is derived from a number of objective measurements in the lab and perceptual analysis of real-life video recordings.
Tele
Samsung Galaxy S25 Ultra
140
All image quality attributes are evaluated at focal lengths from approximately 50 mm to 300 mm, with particular attention paid to texture and smoothness of the zooming effect. The score is derived from a number of objective measurements in the lab and perceptual analysis of real-life video recordings.
The Samsung Galaxy S25 Ultra delivers strong video zoom performance on both its ultra-wide and telephoto lenses. The ultra-wide video captures extensive scenes with good detail and stable exposure, though slight softness and distortion can appear towards the edges, especially in low light. Autofocus is generally smooth. The telephoto video excels at medium zoom levels, offering good detail retention, effective stabilization, and natural color rendering. However, at higher zoom ranges, some loss of sharpness and increased noise become noticeable, particularly in challenging lighting. Switches between different camera modules are still visible, showing slight steps. In bright light the device achieve fairly satisfying performances compared to competitors.