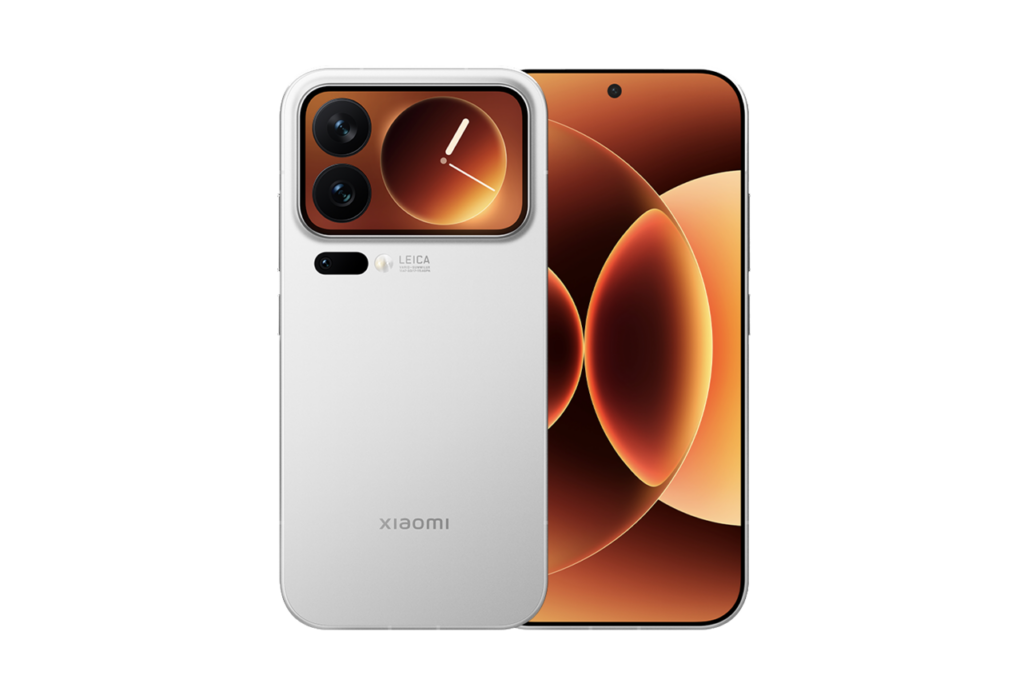
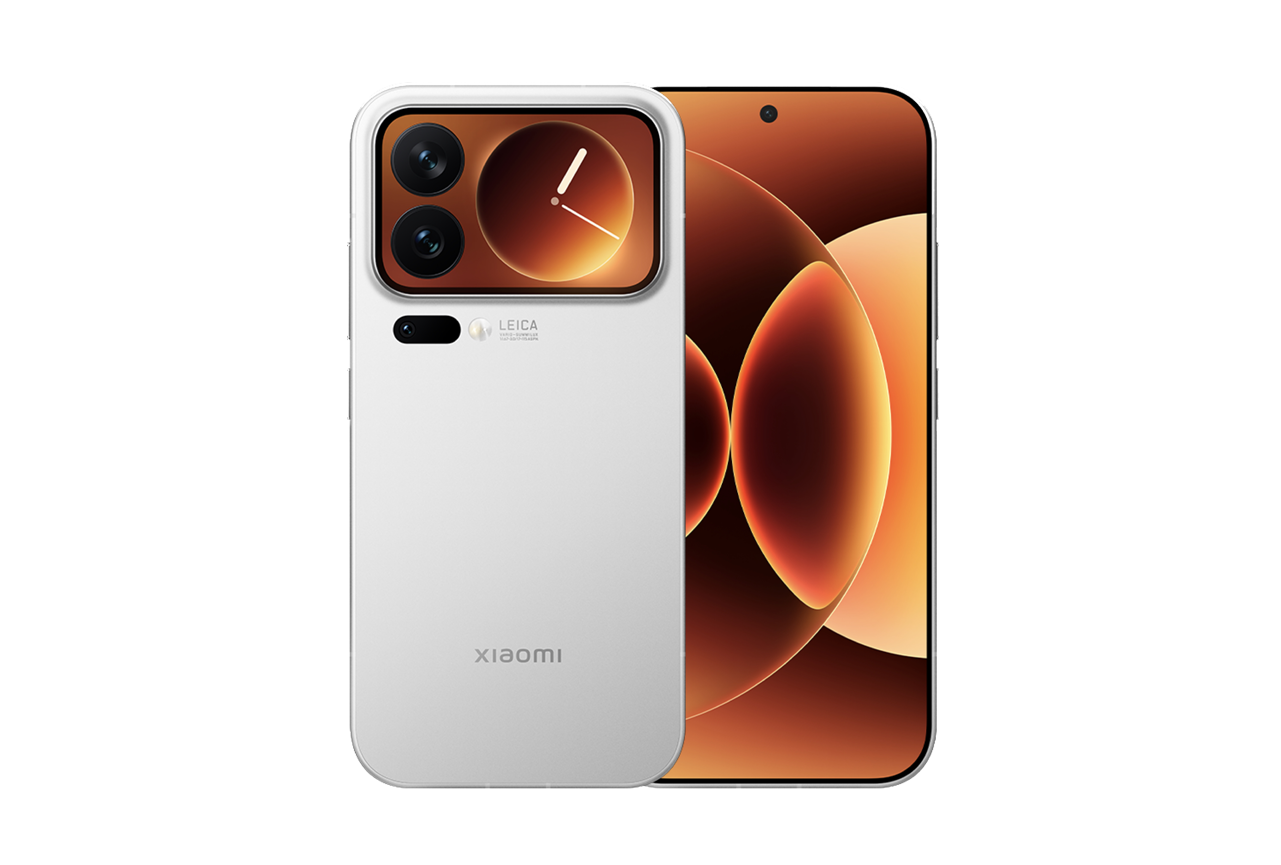
We put the Xiaomi 17 Pro Max through our rigorous DXOMARK Camera test suite to measure its performance in photo, video, and zoom quality from an end-user perspective. This article breaks down how the device fared in a variety of tests and several common use cases and is intended to highlight the most important results of our testing with an extract of the captured data.
Good detail and texture/noise trade-off in still images
Generally fast and accurate autofocus
Cons
Video stabilization could be better, camera shake, even when standing still during recording
White balance and exposure instabilities, as well as transition issues in video mode
Noise in low light video
17mm ultra-wide camera’s field of view more limited than on direct competitors
With the Xiaomi 17 Pro Max, Xiaomi makes its ambition to rival the iPhone 17 Pro Max clear not only in name, but also in imaging performance. This strategy largely succeeds in Photo, where the device scores just one point below Apple’s flagship. The slight deficit is mainly due to zoom limitations, stemming from the ultra-wide camera’s constrained 17mm focal length, which reduces flexibility at shorter zoom ranges.
That said, the Xiaomi’s primary camera slightly outperforms the iPhone’s, delivering consistently accurate exposure, pleasing color rendering, and an excellent texture/noise trade-off. Noise is particularly well controlled, often surpassing Apple’s performance in challenging scenes. While the ultra-wide’s field of view is somewhat limited, image quality remains good within its usable range, and the dedicated 5x tele camera provides solid, dependable results across all tested tele zoom settings.
Video is where the Xiaomi 17 Pro Max falls behind the iPhone and other top-tier flagships. White balance transitions can be abrupt or inconsistent, autofocus reliability is uneven, and visible noise appears in the shadow areas of the frame and when recording low-light scenes. In addition, video texture rendering is relatively low for a device positioned at the very top end of the market.
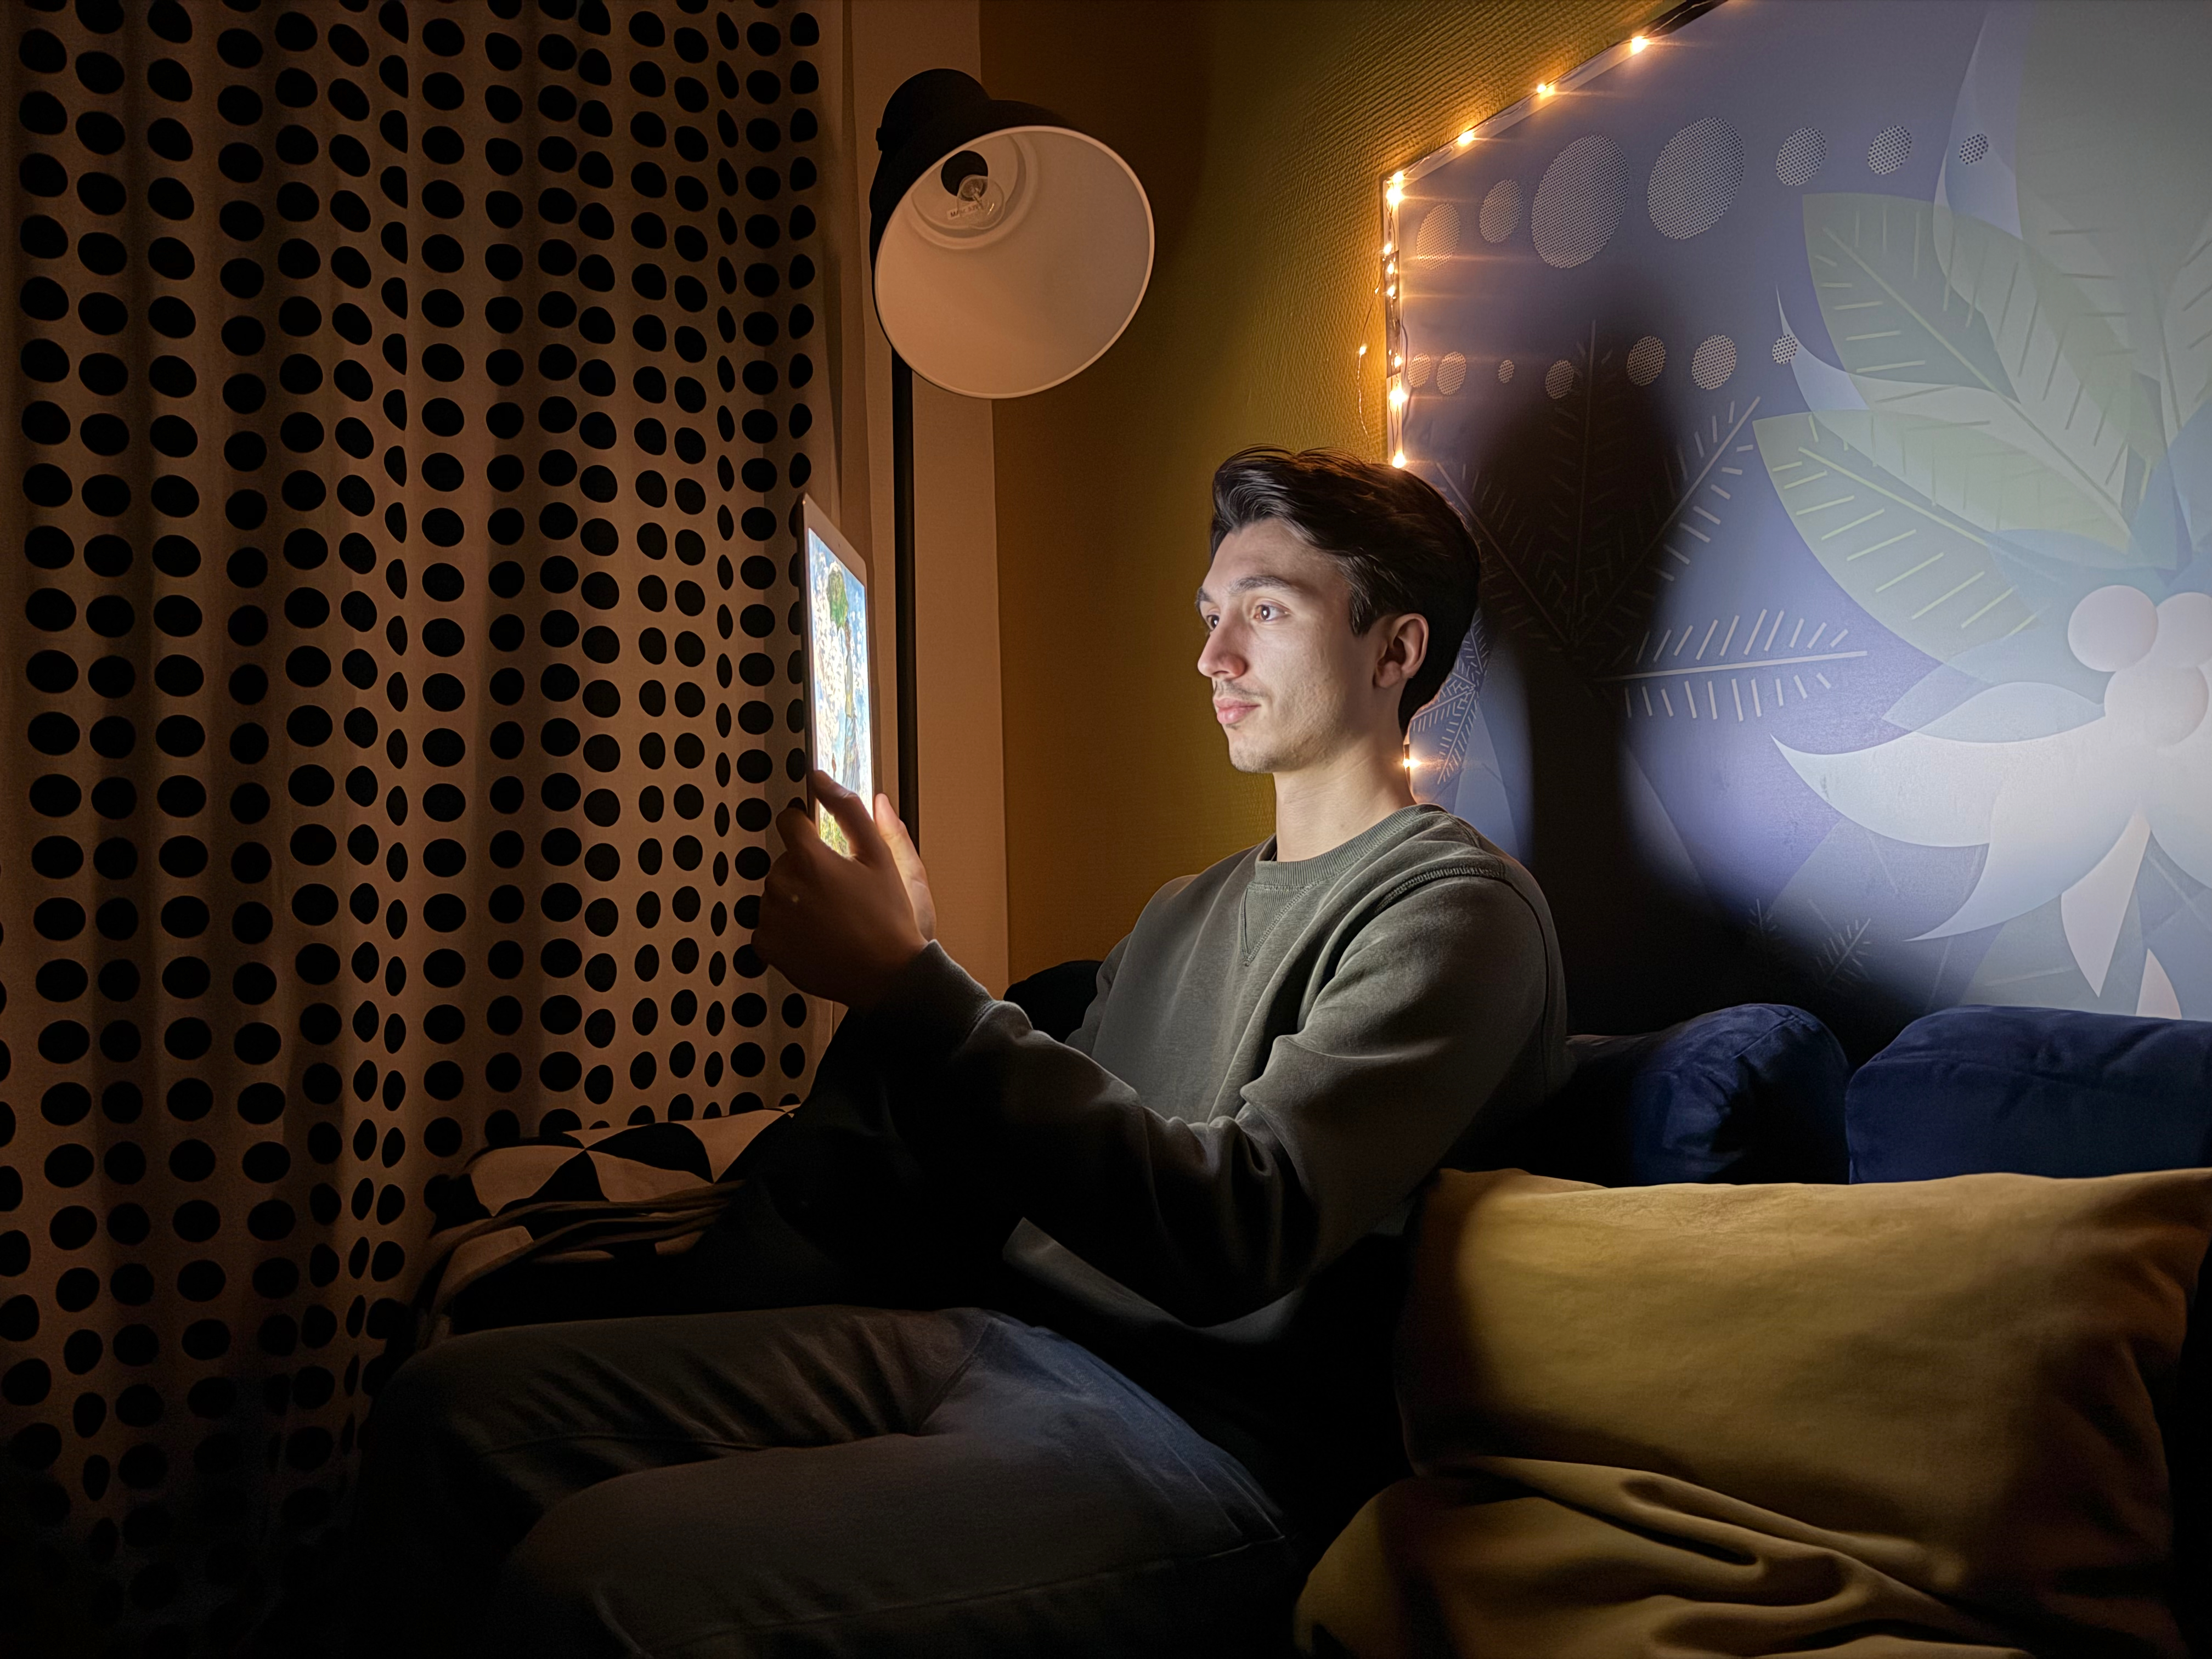
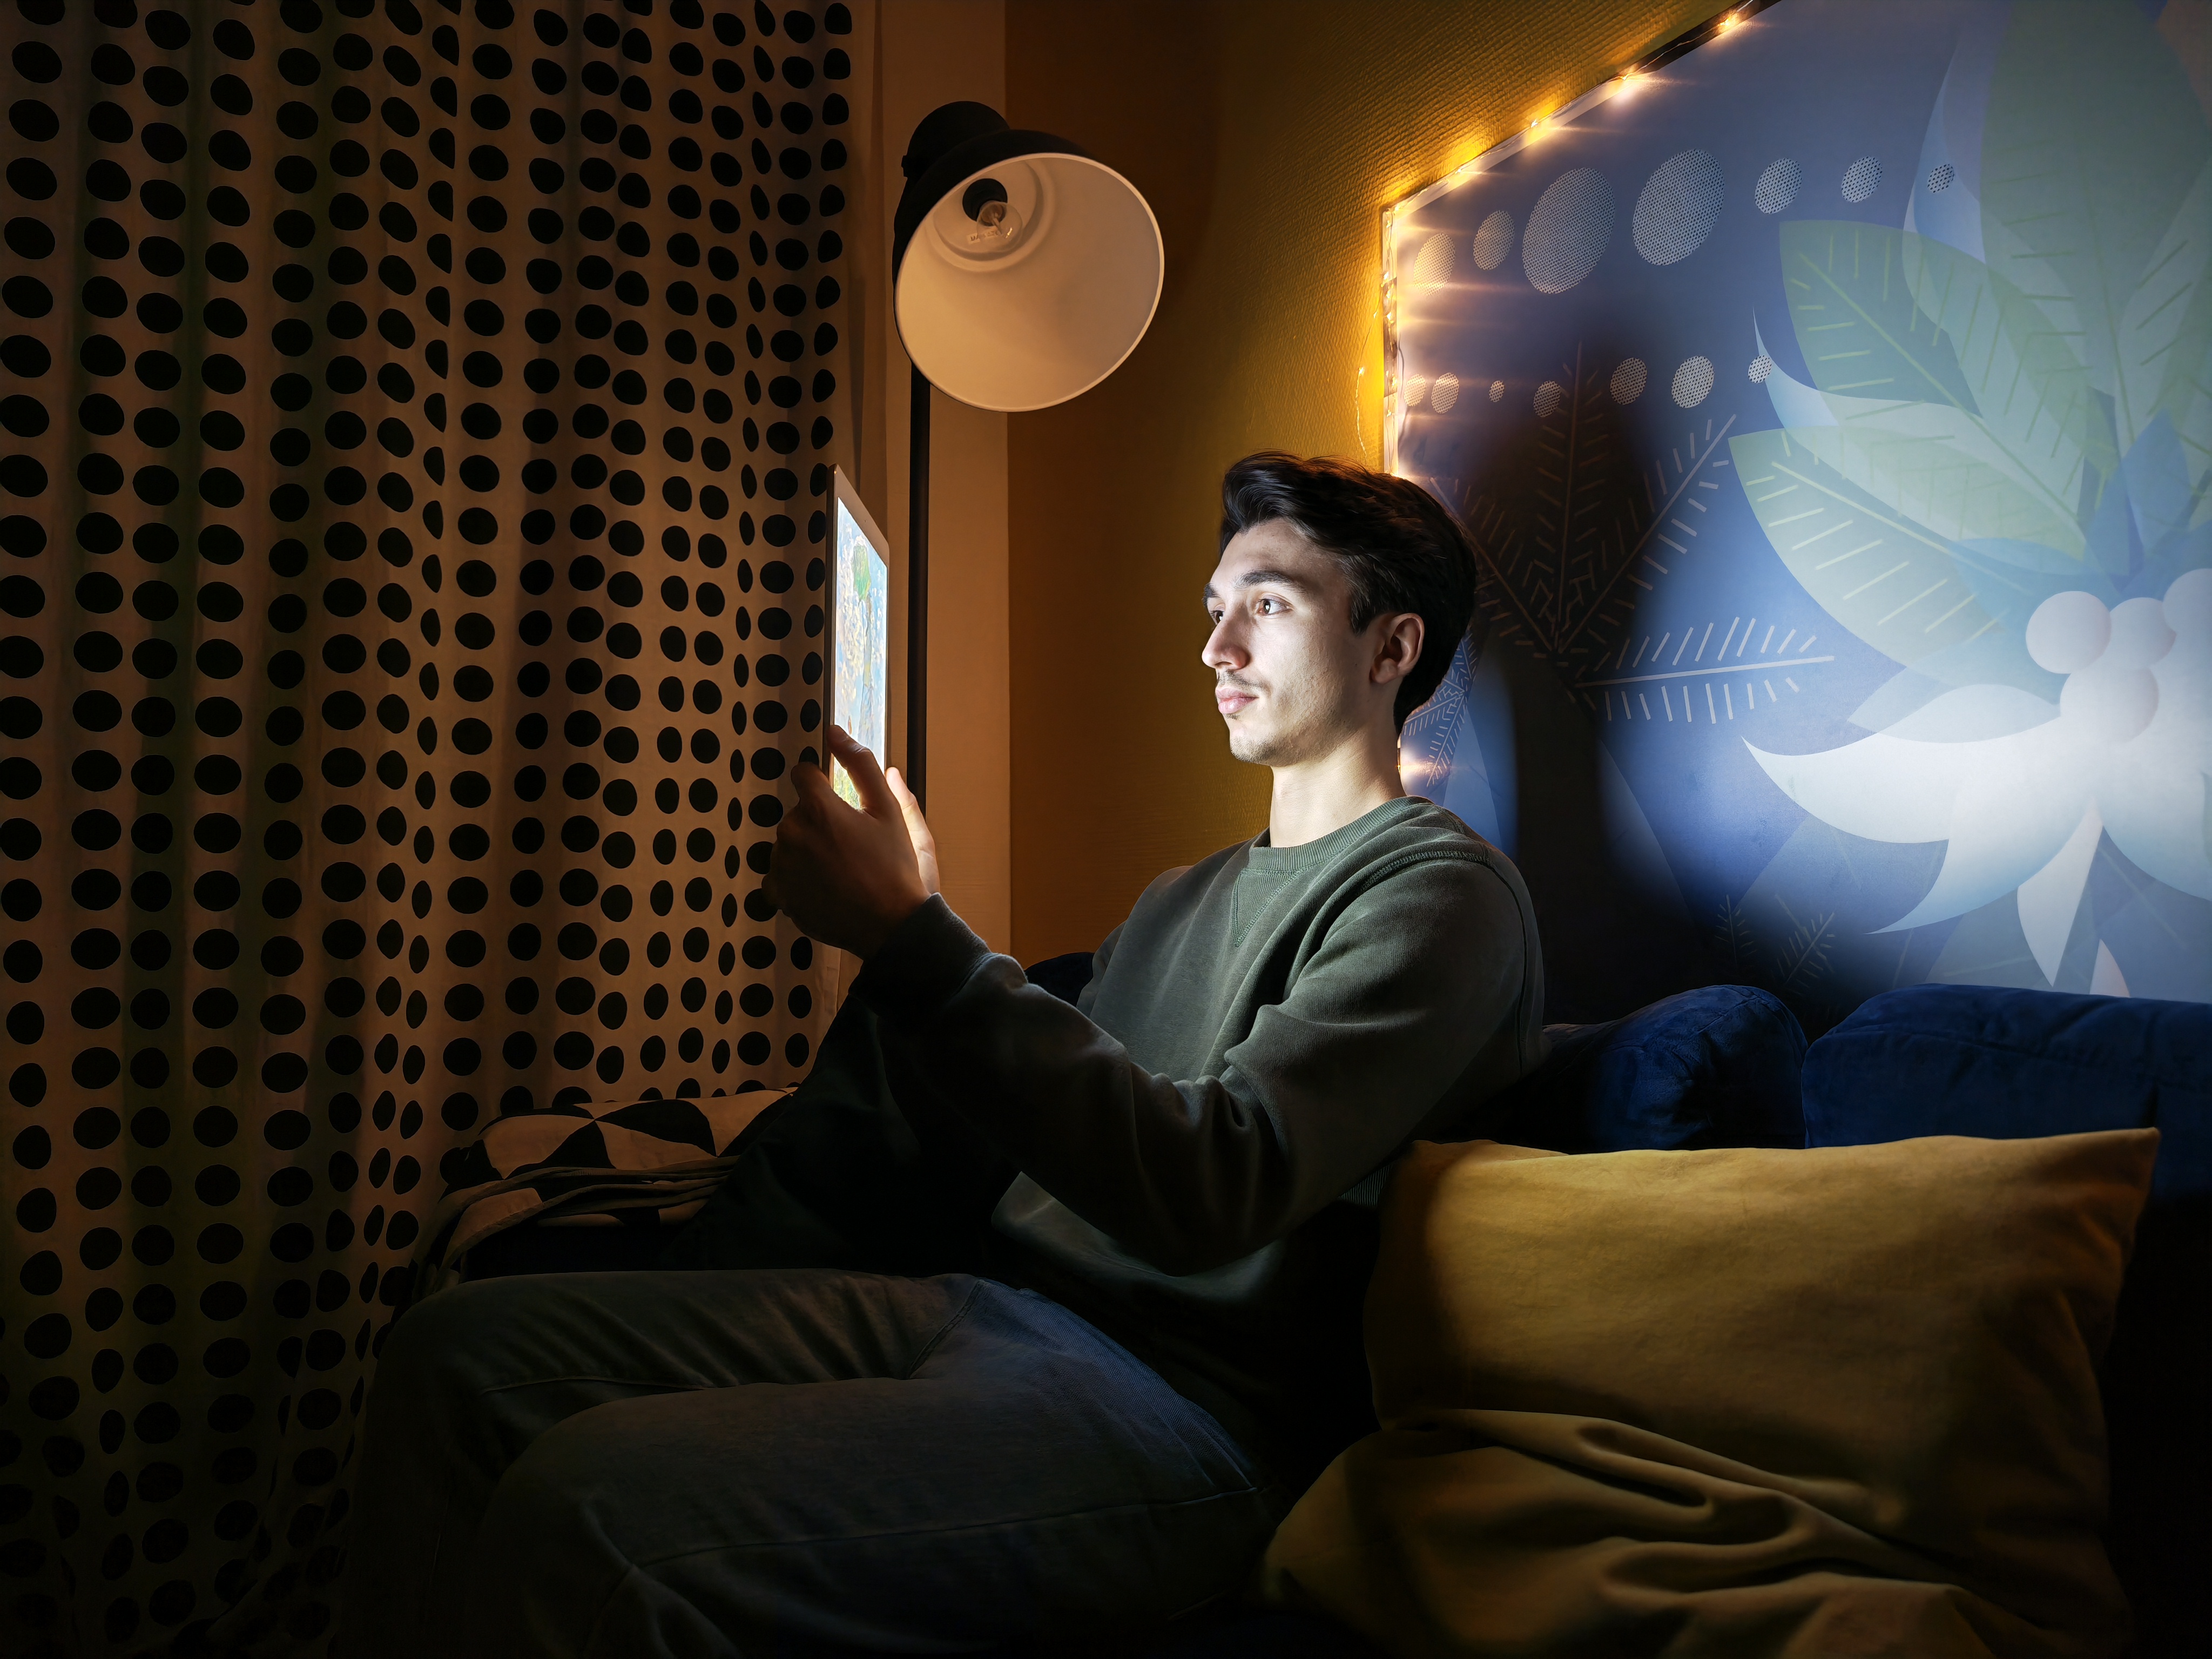
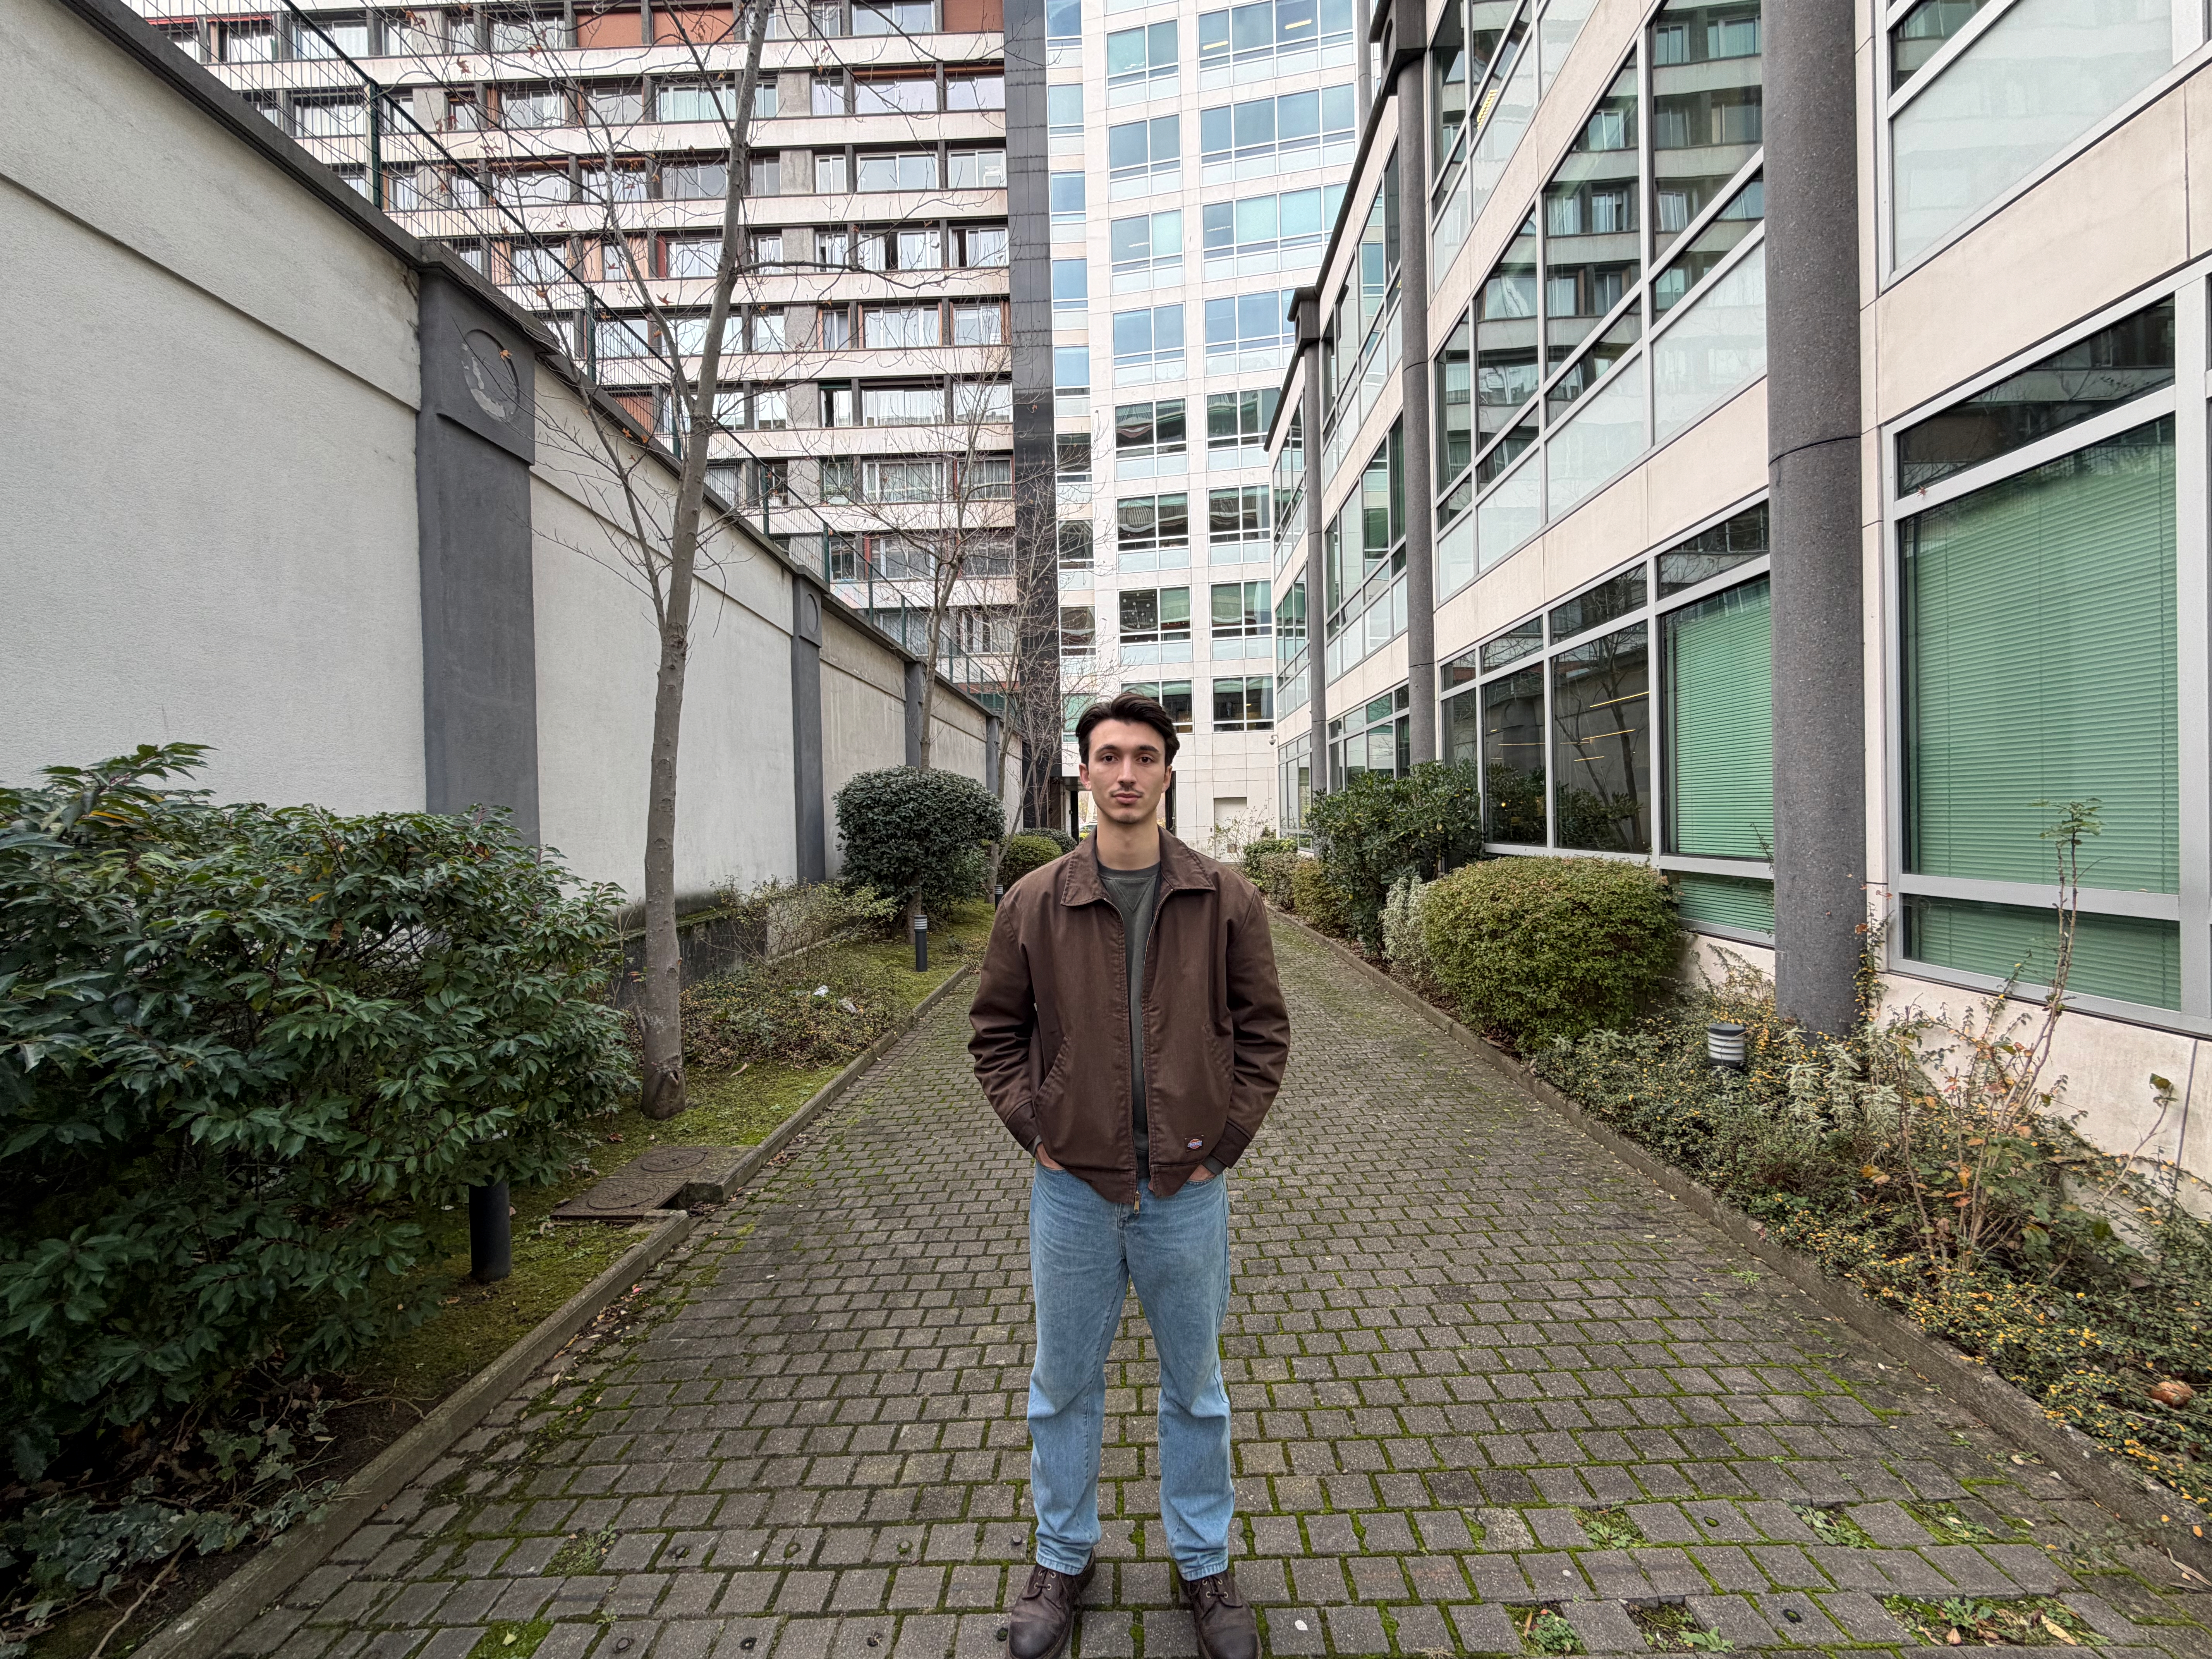
Xiaomi 17 Pro Max – Pleasant overall rendering, with accurate target exposure and colors
BEST 149
Top score Vivo X300 Pro
Lowlight
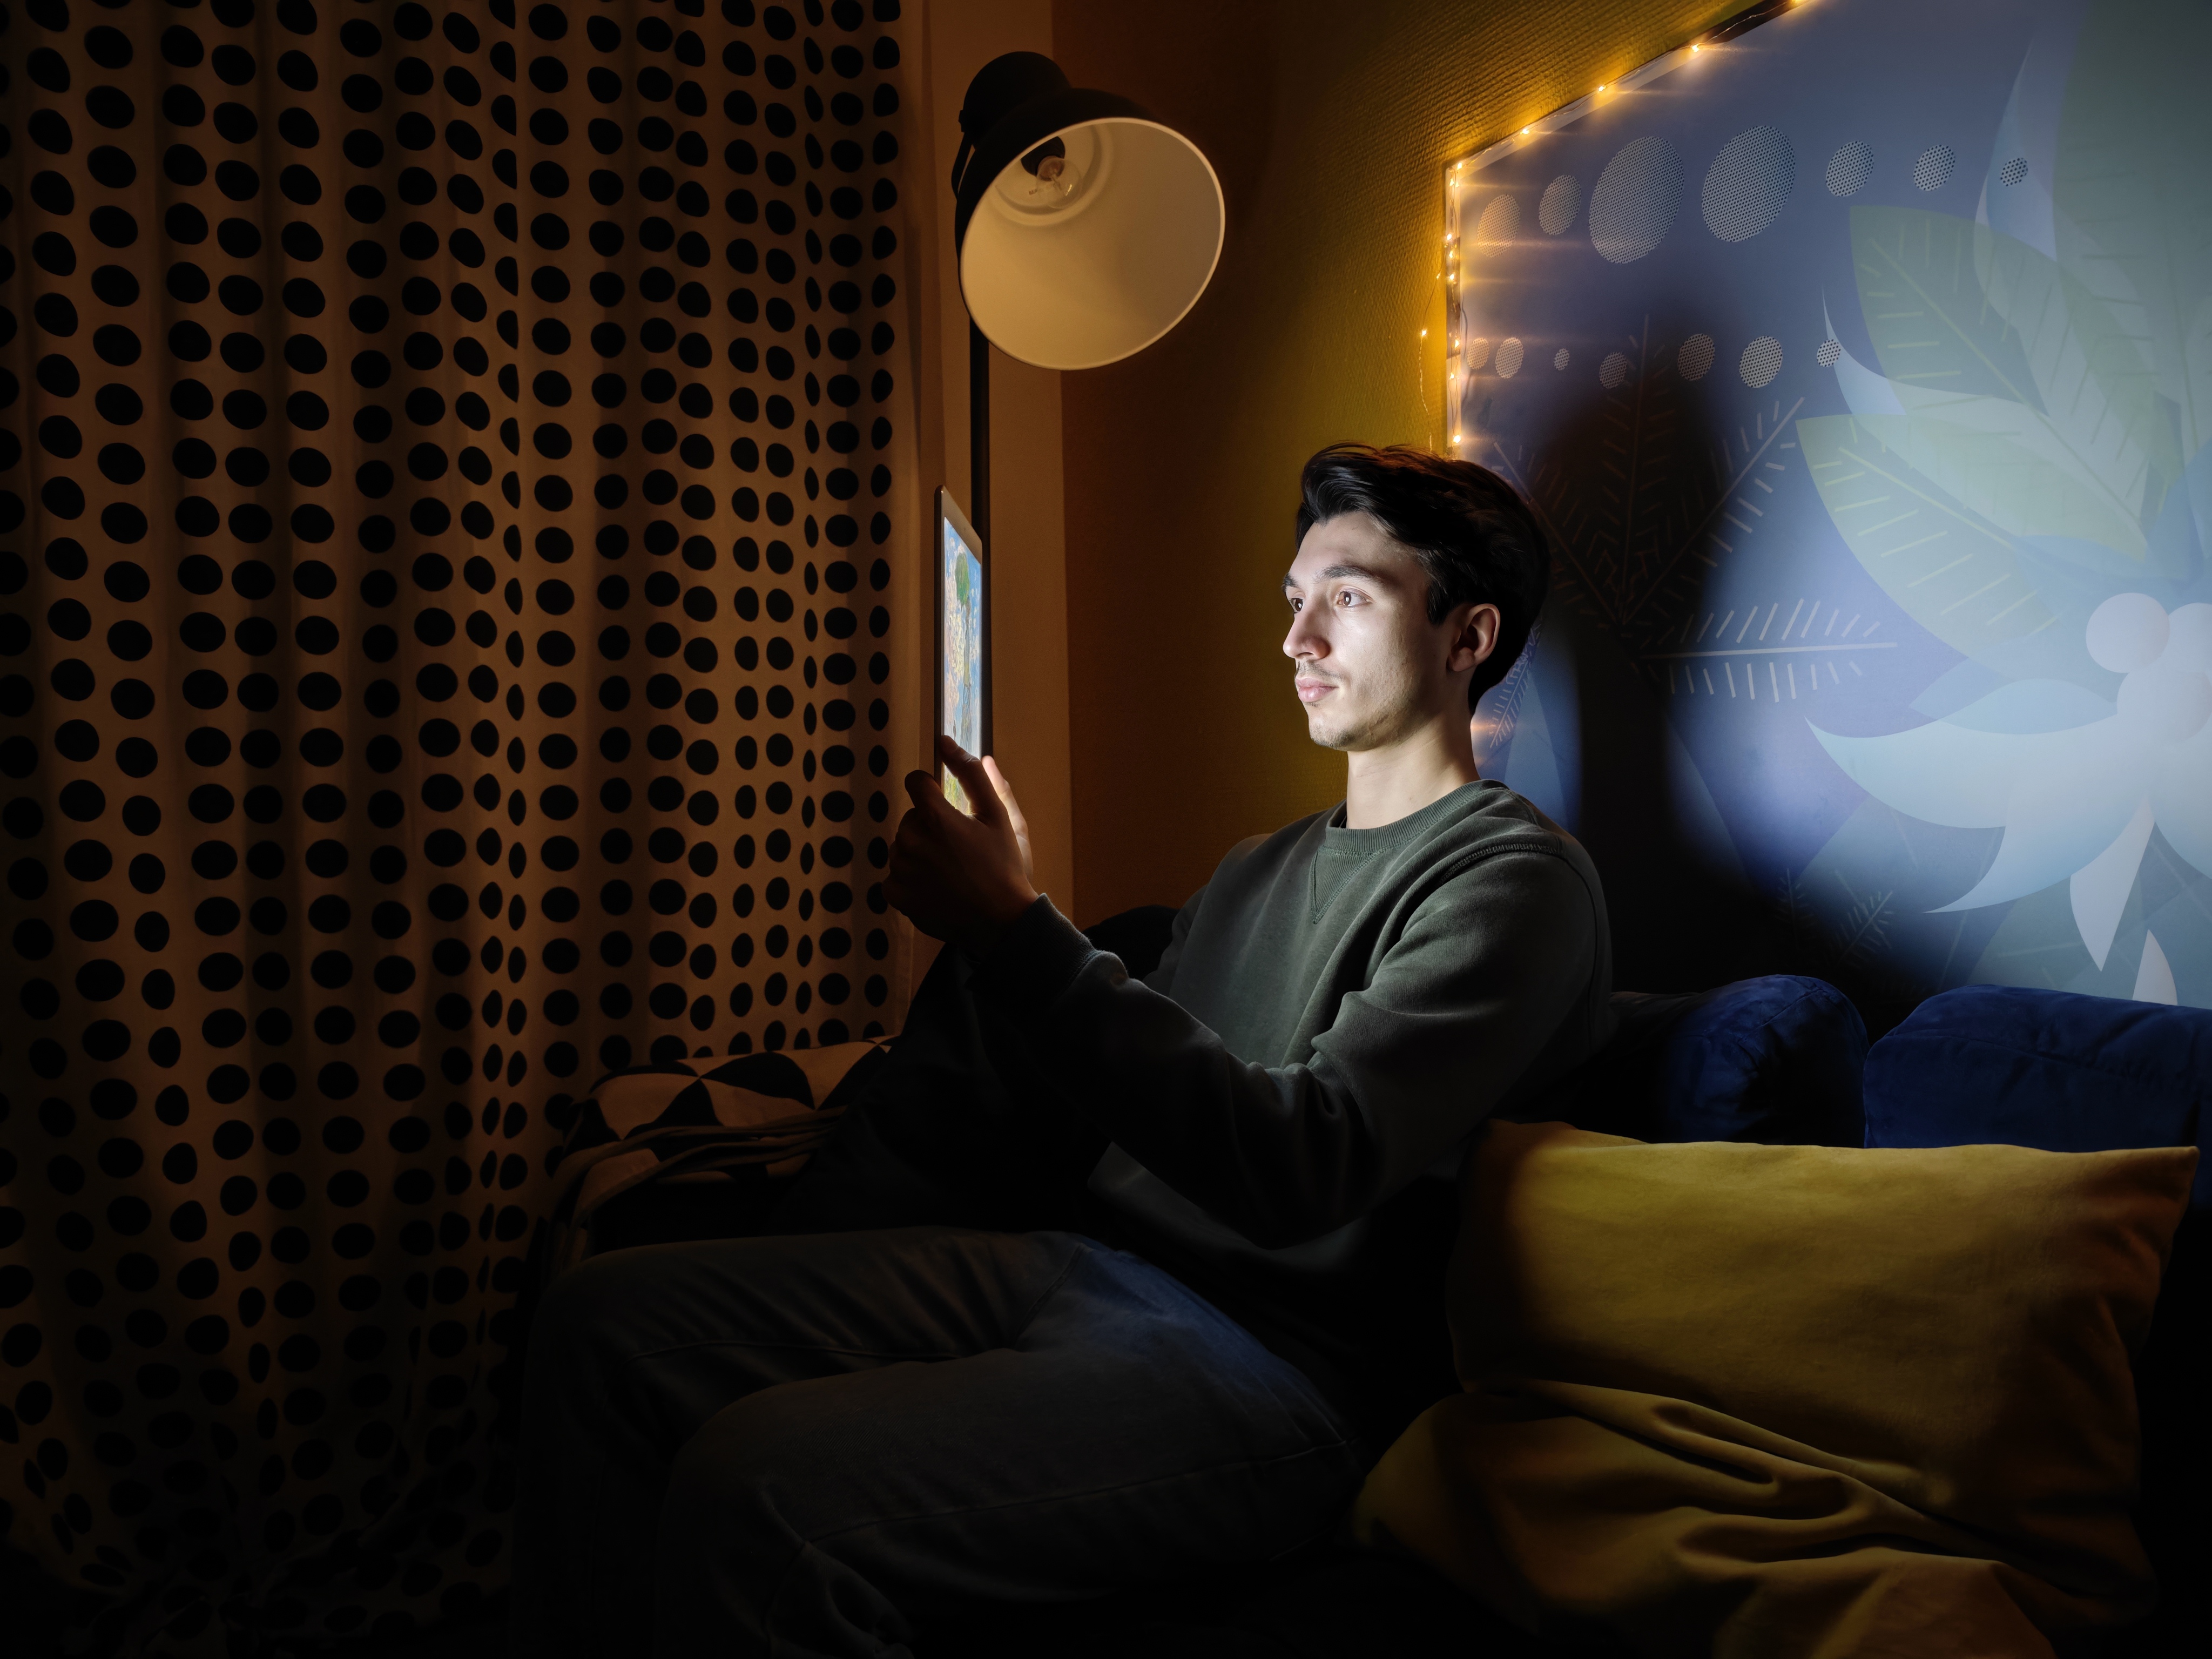
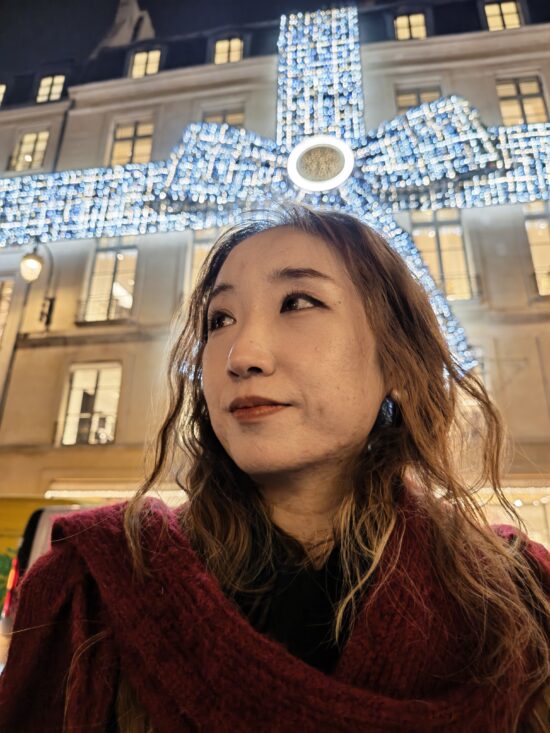
When shooting photos in low light, the Xiaomi 17 Pro Max delivers a very good performance across a wide range of use cases, including portrait mode and tele zoom. Image detail is very good while noise levels are well under control, resulting in pleasing detail, even under difficult light conditions. Target exposure is generally good. While our testers observed slight underexposure in some portrait scenes, this rarely had a significant impact on overall image quality. The Xiaomi’s main issues in low light photography are exposure consistency and color. Some exposure instabilities can be noticeable across a series of consecutive shots, and under warm artificial light our experts sometimes noticed an orange cast in non-portrait scenes.
Low light video is more of a struggle for the 17 Pro Max. While footage is exposed well and texture levels are reasonable, noise can become very intrusive, especially in the shadow areas. In addition, color management issues are more evident in video, with unstable white balance and inaccurate skin tone rendering. These issues prevent the Xiaomi from matching the best-in-class flagship smartphone cameras in low light video scenes.
BEST 169
Top score Huawei Pura 80 Ultra
Portrait
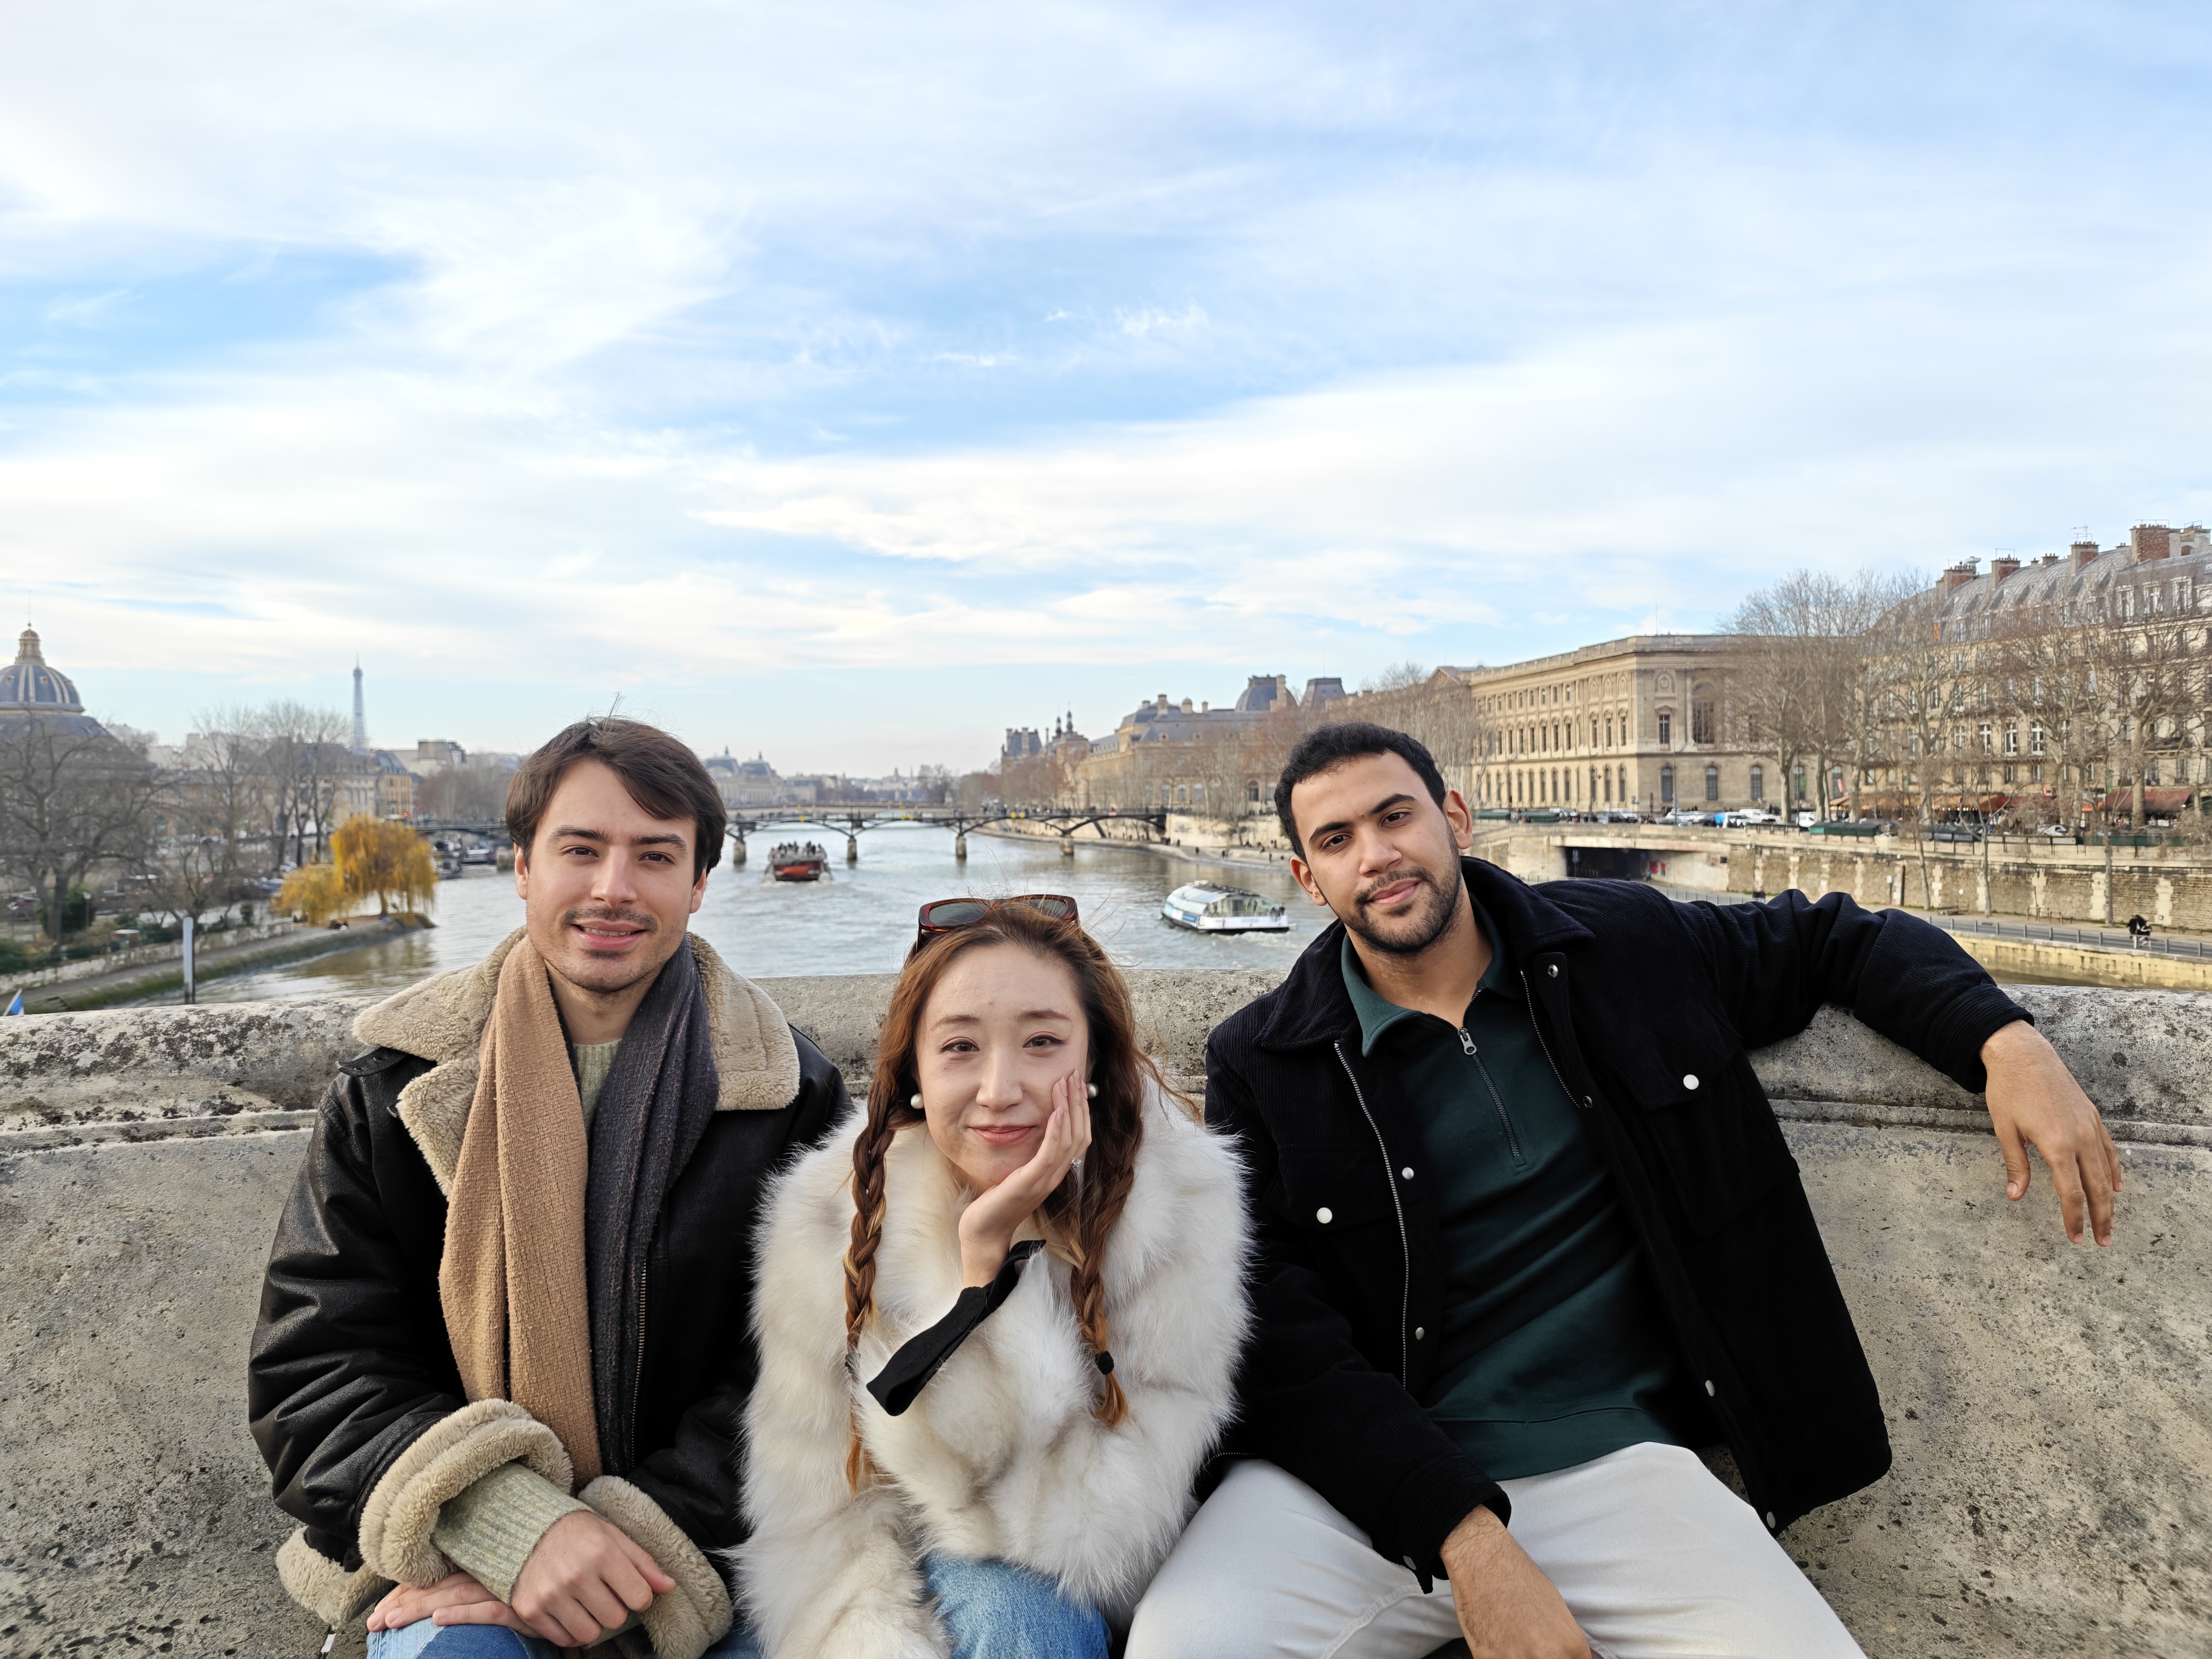
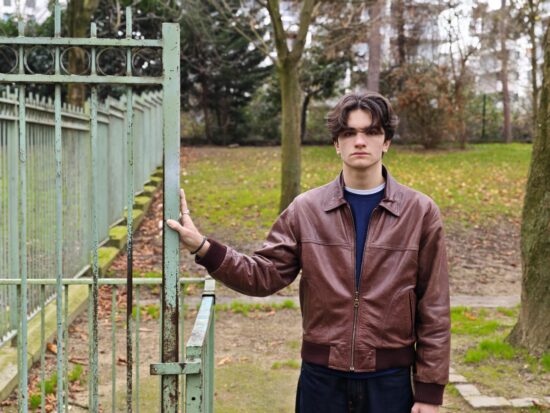
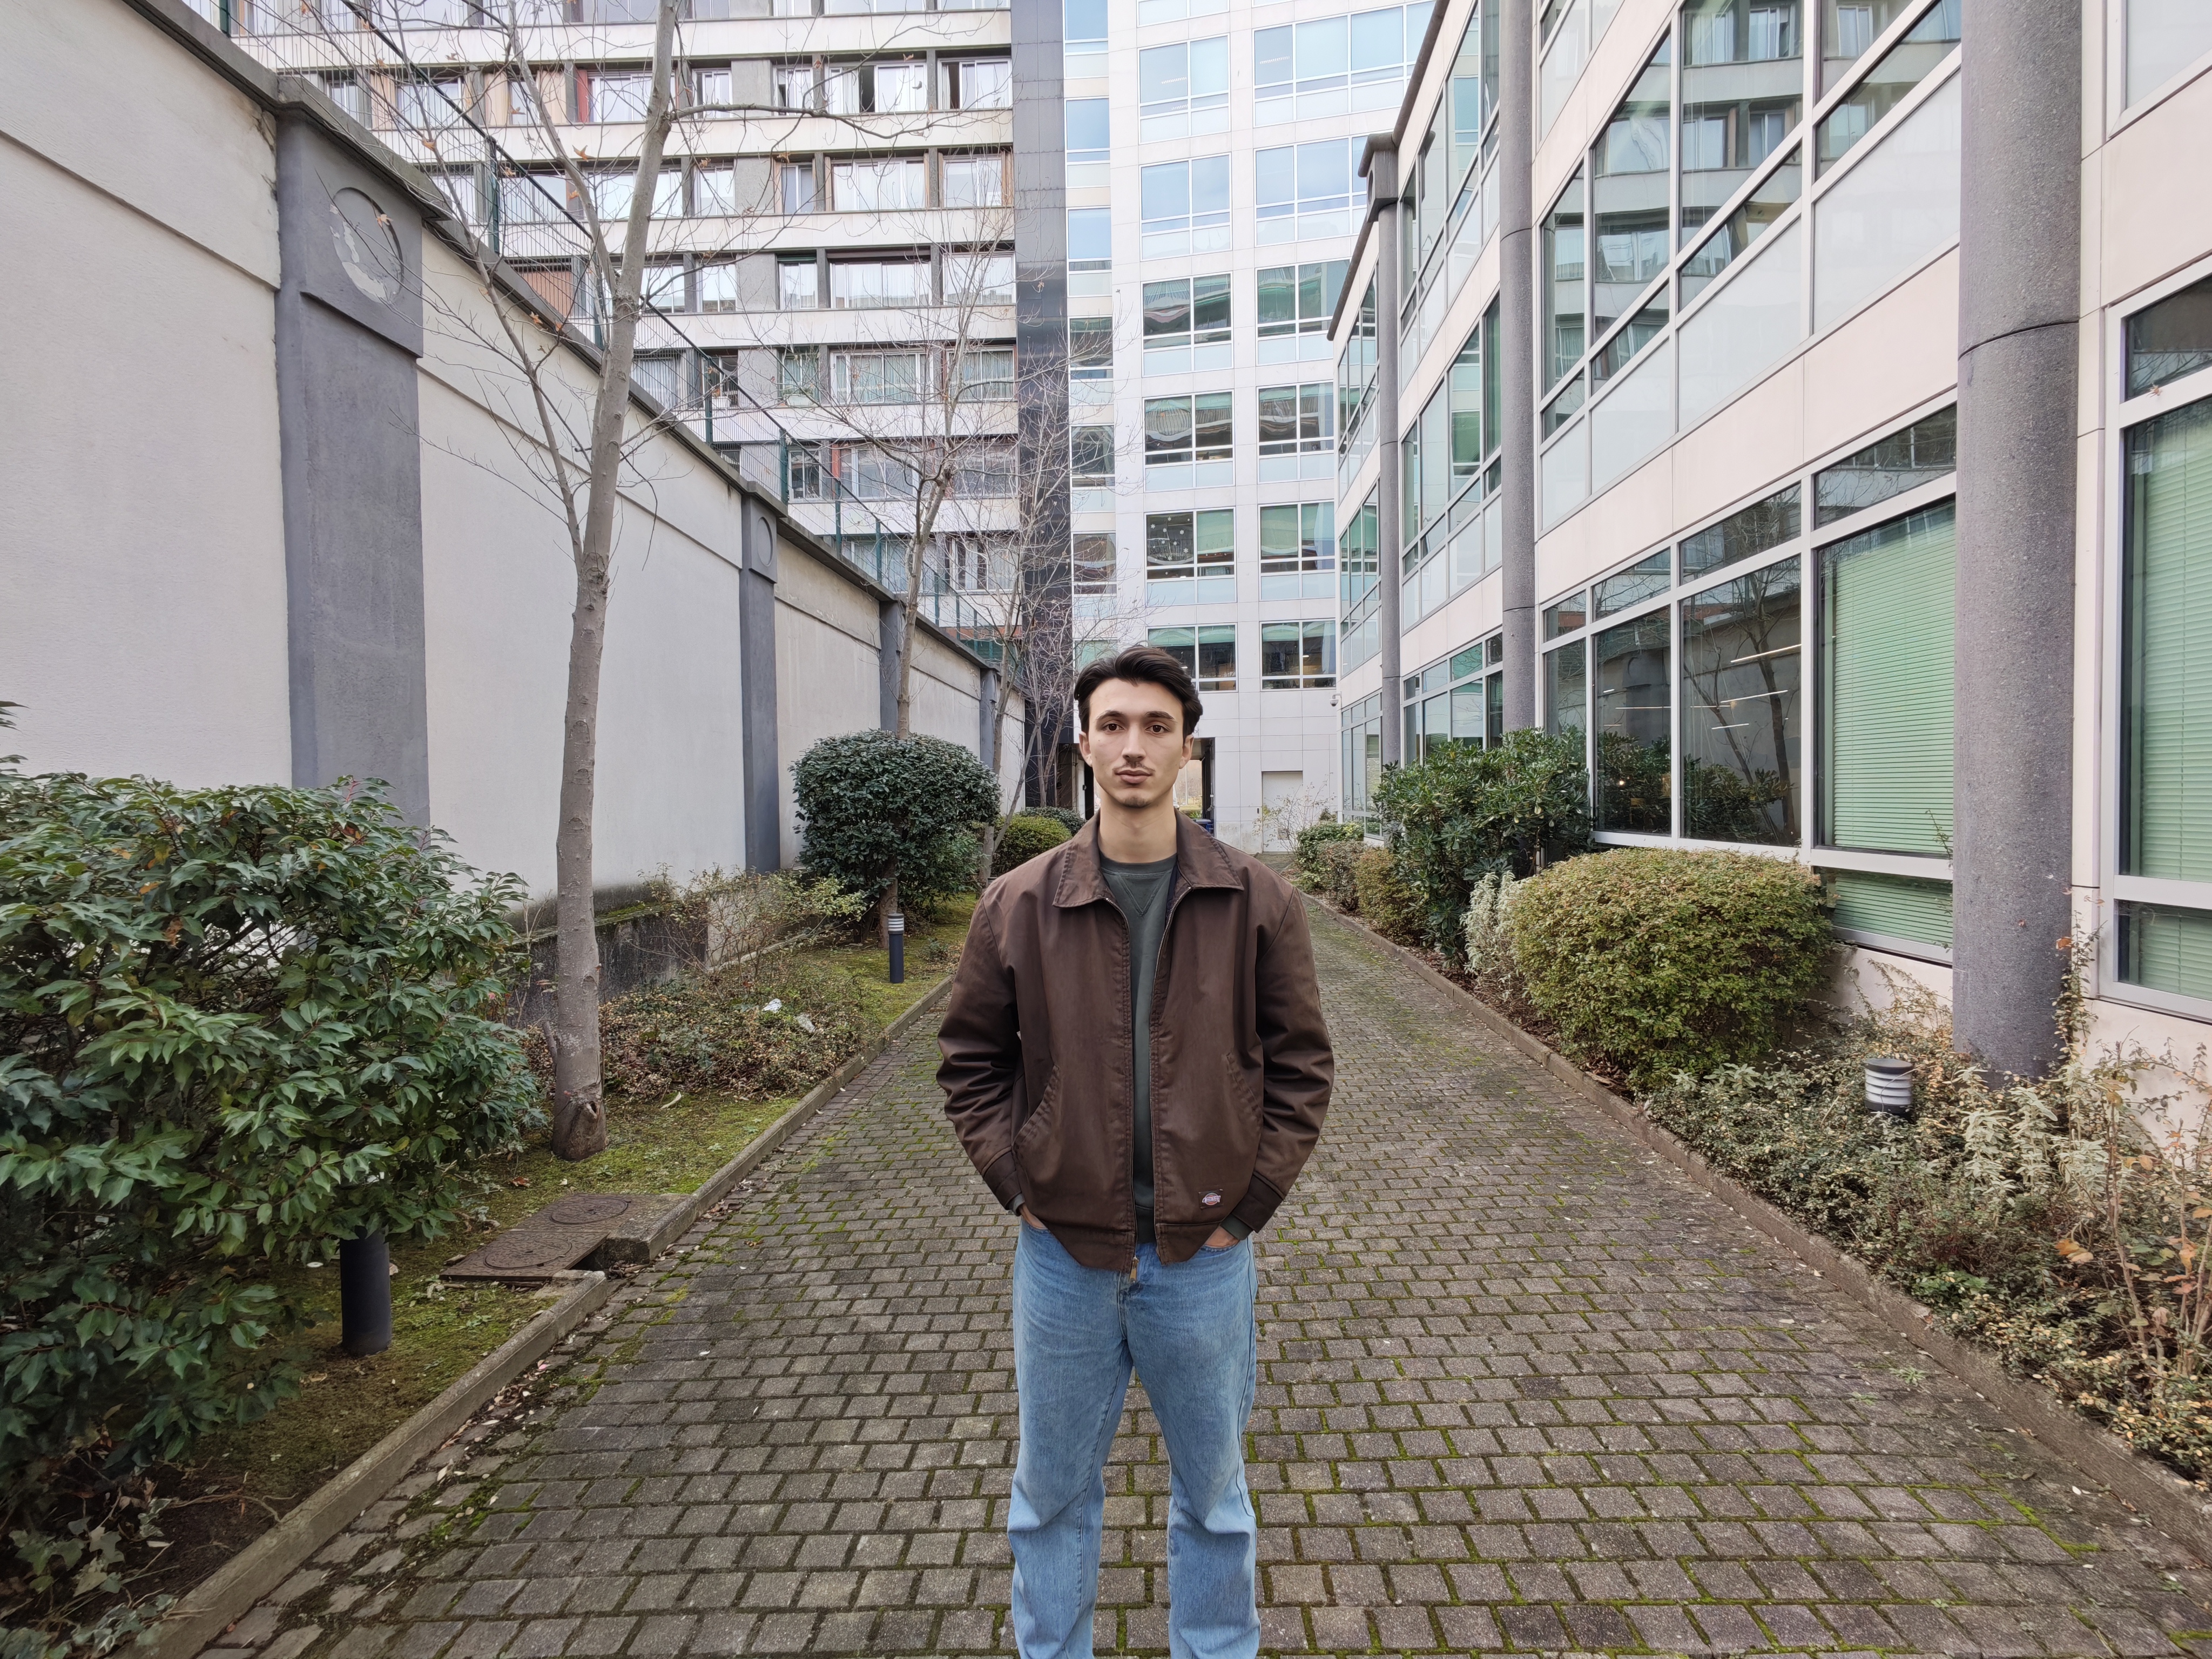
Xiaomi 17 Pro Max portrait images are excellent. The camera is getting all the basics right, and skin tone rendering and face detail are outstanding. Autofocus is fast, but in some scenes our testers noticed a short delay after pressing the shutter button. Depth of field is slightly limited, which means that in group portraits, subjects towards the back of the scene can appear out of focus. The dedicated portrait mode maintains these image characteristics and applies a simulated bokeh effect. In bokeh mode, subject isolation is mostly good, but in some more complex scenes, with multiple objects at different distances from the camera, our experts noticed some depth estimation inaccuracies.
BEST 159
Top score Vivo X300 Pro
Zoom
Test summary
About DXOMARK Camera tests: DXOMARK’s camera evaluations take place in laboratories and real-world situations using a wide variety of use-cases. The scores rely on objective tests for which the results are calculated directly using measurement software in our laboratory setups, and on perceptual tests where a sophisticated set of metrics allow a panel of image experts to compare aspects of image quality that require human judgment. Testing a smartphone involves a team of engineers and technicians for about a week. Photo and Video quality are scored separately and then combined into an overall score for comparison among the cameras in different devices. For more information about the DXOMARK Camera protocol, click here. More details on smartphone camera scores are available here. The following section gathers key elements of DXOMARK’s exhaustive tests and analyses. Full performance evaluations are available upon request. Please contact us on how to receive a full report.
Xiaomi 17 Pro Max Camera Scores
This graph compares DXOMARK photo and video scores between the tested device and references. Average and maximum scores of the price segment are also indicated. Average and maximum scores for each price segment are computed based on the DXOMARK database of devices tested.
For scoring and analysis, DXOMARK engineers capture and evaluate more than 3,800 test images in controlled lab environments as well as outdoor, indoor and low-light natural scenes, using the camera’s default settings. The photo protocol is designed to take into account the main use cases and is based on typical shooting scenarios, such as portraits, landscape and zoom photography. The evaluation is performed by visually inspecting images against a reference of natural scenes, and by running objective measurements on images of charts captured in the lab under different lighting conditions from 0.1 to 10,000+ lux and color temperatures from 2,300K to 6,500K.
The photo Main tests analyze image quality attributes such as exposure, color, texture, and noise in various light conditions. Autofocus performances and the presence of artifacts on all images captured in controlled lab conditions and in real-life images are also evaluated. All these attributes have a significant impact on the final quality of the images captured with the tested device and can help to understand the camera's main strengths and weaknesses at 1x.
The Xiaomi 17 Pro Max’s primary camera is one of the best we have tested to date for photo capture and in our photo ranking, is only surpassed by the last two generations of Huawei Pura devices. Image quality is overall highly consistent and competitive, with particular strengths in color rendering and texture/noise management.
Color performance is a highlight among the photo tests, thanks to a consistently accurate and pleasant white balance in most shooting conditions and well-rendered skin tones across a wide range of complexions. Color remains well controlled in low light, with only rare deviations that are generally down to exposure behavior rather than color processing. The Xiaomi’s trade-off between texture preservation and noise reduction is among the best we have seen. Image detail is crisp, defined well and rendered very naturally, even in low light. There is barely any noise in most daylight and indoor scenes. It becomes only slightly more noticeable at lower light levels. This means fine textures are rendered nicely, without any aggressive noise reduction artifacts.
The autofocus system is fast and accurate in most situations, contributing to a high keeper rate. The somewhat limited depth of field can result in slight sharpness falloff on subjects positioned further back in group portraits, but this is true for many current flagship phones and does not significantly detract from the overall experience.
Where the Xiaomi 17 Pro Max lags slightly behind the very best competitors is exposure performance. While target exposure is mostly correct, we observed some instabilities across consecutive shots. As a result, multiple captures may be necessary to ensure the desired rendering. In addition, our testers noticed occasional issues with contrast, as well as slight underexposure, particularly in high-contrast scenes and with subjects with with darker skin tones.
Exposure is one of the key attributes for technically good pictures. The main attribute evaluated is the brightness level of the main subject through various use cases such as landscape, portrait, or still life. Other factors evaluated are the global contrast and the ability to render the dynamic range of the scene (ability to render visible details in both bright and dark areas). When the camera provides Photo HDR format, the images are analyzed with a visualization on an HDR reference monitor, under reference conditions specified in the ISO-22028-5 standard. Repeatability is also important because it demonstrates the camera's ability to provide the same rendering when shooting several images of the same scene.
Brightness on face with illuminance levels (Diana)
These graphs represent the output level on the face measured on the images captured by the device under test in multiple lighting conditions on the AFHDR Portrait setup. We show here the intensity measured on the forehead of the realistic mannequin, for a picture displayed on a HDR monitor in standard ISO/TS 22028-5 playback conditions. The multiple lighting conditions of the scene are characterized by the illumination level in lux and the relative brightness of the backlit panel simulating high dynamic range conditions. Delta EV specifies the difference of luminance in stops between the face and the light panel simulating HDR conditions. The intensity is measured in JND derived from the ICtCp color space.
Brightness on face with illuminance levels (Eugene)
These graphs represent the output level on the face measured on the images captured by the device under test in multiple lighting conditions on the AFHDR Portrait setup. We show here the intensity measured on the forehead of the realistic mannequin, for a picture displayed on a HDR monitor in standard ISO/TS 22028-5 playback conditions. The multiple lighting conditions of the scene are characterized by the illumination level in lux and the relative brightness of the backlit panel simulating high dynamic range conditions. Delta EV specifies the difference of luminance in stops between the face and the light panel simulating HDR conditions. The intensity is measured in JND derived from the ICtCp color space.
Target exposure is accurate in most scenes, but not always consistent, with some instabilities across series of consecutive shots. In addition, contrast and exposure tuning are not always optimal in difficult high-contrast scenes, particularly with darker skin tones in the frame. In low light, exposure can look slightly darker than on competing flagship phones, when images are viewed on an HDR display.
Xiaomi 17 Pro Max – Accurate face exposure, wide dynamic range
Apple iPhone 17 Pro – Accurate exposure and wide dynamic range, but slight highlight clipping
Honor Magic 8 Pro – Accurate exposure and wide dynamic range, some face areas and lights almost clipped
Color is one of the key attributes for technically good pictures. The image quality attributes analyzed are skin-tone rendering, white balance, color shading, and repeatability. For color and skin tone rendering, we penalize unnatural colors according to results gathered in various studies and consumer insights while respecting the manufacturer's choice of color signature.
Overall photo color performance is outstanding. White balance is generally accurate and pleasant, making for natural and appealing images. Excellent skin tone rendering provides good fidelity across a wide range of complexions. However, in some scenes without human subjects and under low artificial light, our testers occasionally noticed an orange cast. In addition, dark skin tones can sometimes appear slightly desaturated and unnatural, but this effect is more often linked to minor exposure inaccuracies rather than color processing alone.
Xiaomi 17 Pro Max – Nice white balance and color rendering
Apple iPhone 17 Pro – Nice white balance and color rendering
Honor Magic 8 Pro – Nice color rendering but slight white balance cast
Autofocus tests concentrate on focus accuracy, focus repeatability, shooting time delay, and depth of field. Shooting delay is the difference between the time the user presses the capture button and the time the image is actually taken. It includes focusing speed and the capability of the device to capture images at the right time, what is called 'zero shutter lag' capability. Even if a shallow depth of field can be pleasant for a single subject portrait or close-up shot, it can also be a problem in some specific conditions such as group portraits; Both situations are tested. Focus accuracy is also evaluated in all the real-life images taken, from infinity to close-up objects and in low light to outdoor conditions.
Sharpness and Timing: irregularity and speed: 5Lux Δ0EV Tungsten Handheld
This graph illustrates focus accuracy and speed as well as zero shutter lag capability by showing the edge acutance versus the shooting time measured on the AFHDR setup on a series of pictures. All pictures were taken in one light condition and indicated illuminant, 500ms after the defocus. The edge acutance is measured on the four edges of the Dead Leaves chart, and the shooting time is measured on the LED Universal Timer.
Sharpness and Timing: irregularity and speed on AFHDR Portrait Diana setup: 10000Lux Δ0EV D55 Handheld
This graph illustrates focus accuracy and zero shutter lag capability by showing the level of details on the face versus the shooting time measured on the AFHDR Portrait setup on a series of pictures. All pictures were taken at 10000 Lux with D55 illuminant, 500 ms after the defocus. The level of details on the face is measured using DXOMARK Detail Preservation Metric on the Realistic Mannequin, the higher the JOD is the more details are visible on the face. And the shooting time is measured on the LED Universal Timer.
Sharpness and Timing: irregularity and speed on AFHDR Portrait Eugene setup: 5Lux Δ0EV 2700K Handheld
This graph illustrates focus accuracy and zero shutter lag capability by showing the level of details on the face versus the shooting time measured on the AFHDR Portrait setup on a series of pictures. All pictures were taken at 5 Lux with LED 2700K illuminant, 500 ms after the defocus. The level of details on the face is measured using DXOMARK Detail Preservation Metric on the Realistic Mannequin, and the shooting time is measured on the LED Universal Timer.
Xiaomi 17 Pro Max - Depth of field
Xiaomi 17 Pro Max - Background subject slightly out of focus, with AI sharpening applied to the eyes
Apple iPhone 17 Pro - Depth of field
Apple iPhone 17 Pro - Background subject slightly out of focus
Honor Magic 8 Pro - Depth of field
Honor Magic 8 Pro - Background model slightly out of focus, with AI sharpening applied to the eyes and face
Texture tests analyze the level of details and the texture of subjects in the images taken in the lab as well as in real-life scenarios. For natural shots, particular attention is paid to the level of details in the bright and dark areas of the image. Objective measurements are performed on chart images taken in various lighting conditions from 0.1 to 10,000+ lux and different kinds of dynamic range conditions. The charts used are the proprietary DXOMARK chart (DMC), and the Dead Leaves chart. We also have an AI based metric for the level of details on our realistic mannequins Eugene and Diana.
DXOMARK CHART (DMC) detail preservation score vs lux levels for handheld conditions
This graph shows the evolution of the DMC detail preservation score with the level of lux, for two holding conditions. DMC detail preservation score is derived from an AI-based metric trained to evaluate texture and details rendering on a selection of crops of our DXOMARK chart.
Noise tests analyze various attributes of noise such as intensity, chromaticity, grain, structure on real-life images as well as images of charts taken in the lab. For natural images, particular attention is paid to the noise on faces, landscapes, but also on dark areas and high dynamic range conditions. Noise on moving objects is also evaluated on natural images. Objective measurements are performed on images of charts taken in various conditions from 0.1 to 10000 lux and different kinds of dynamic range conditions. The chart used is the Dead Leaves chart and the standardized measurement such as Visual Noise derived from ISO 15739.
Visual noise evolution with illuminance levels in handheld condition
This graph shows the evolution of visual noise metric with the level of lux in handheld condition. The visual noise metric is the mean of visual noise measurement on all patches of the Dead Leaves chart in the AFHDR setup. DXOMARK visual noise measurement is derived from ISO15739 standard.
The Xiaomi 17 Pro Max is among the best devices in its class in terms of texture and noise. Noise levels are very low, matching those of the latest flagship devices with similarly strong light-collection capabilities, such as the Honor Magic 8 Pro, the Vivo X300 Pro or the Oppo Find X9 Pro. Noise only becomes noticeable in the shadow areas of high dynamic range scenes, or in extreme low light conditions. The camera’s ability to preserve fine textures while keeping noise levels low is truly outstanding. Detail remains crisp and natural, even in low light. If any AI-based detail reconstruction is applied, it is done so very carefully, enhancing detail without making it look artificial.
Xiaomi 17 Pro Max - Texture and noise
Xiaomi 17 Pro Max - High levels of detail, natural rendering, no noise
Apple iPhone 17 Pro - Texture and noise
Apple iPhone 17 Pro - High levels of detail on textured areas, slight noise
Honor Magic 8 Pro - Texture and noise
Honor Magic 8 Pro - High levels of detail, slightly unnatural rendering, no noise
The artifacts evaluation looks at flare, lens shading, chromatic aberrations, geometrical distortion, edges ringing, halos, ghosting, quantization, unexpected color hue shifts, among others type of possible unnatural effects on photos. The more severe and the more frequent the artifact, the higher the point deduction on the score. The main artifacts observed and corresponding point loss are listed below.
Bokeh is tested in one dedicated mode, usually portrait or aperture mode, and analyzed by visually inspecting all the images captured in the lab and in natural conditions. The goal is to reproduce portrait photography comparable to one taken with a DLSR and a wide aperture. The main image quality attributes paid attention to are depth estimation, artifacts, blur gradient, and the shape of the bokeh blur spotlights. Portrait image quality attributes (exposure, color, texture) are also taken into account.
In bokeh mode the Xiaomi 17 Pro Max produces good portrait images, that come with generally accurate depth estimation and clean subject segmentation in real-life scenes. Edge detection is well handled in most situations, with only occasional minor errors around complex shapes. Depth estimation becomes less reliable in scenes with multiple subjects at different distances from the camera or with very busy backgrounds, such as our laboratory setups. Other bokeh attributes are managed well. Spotlights in the background are rendered with a nice shape and good contrast. Blur intensity is sufficiently strong to create a convincing background separation. Overall, bokeh performance is comparable to the iPhone 17 Pro, but trails slightly behind the best-in-class devices, such as the Vivo X300 Pro or the Honor Magic 8 Pro.
Xiaomi 17 Pro Max - Bokeh mode
Xiaomi 17 Pro Max - Generally accurate segmentation, but artifacts on fine details, such as the hair
Apple iPhone 17 Pro - Bokeh mode
Apple iPhone 17 Pro - Generally accurate segmentation, but artifacts on fine detail such as the hair
All image quality attributes are evaluated at focal lengths from approximately 40 mm to 300 mm, with particular attention paid to texture and detail. The score is derived from a number of objective measurements in the lab and perceptual analysis of real-life images.
Xiaomi 17 Pro Max Telephoto Scores
This graph illustrates the relative scores for the different zoom ranges evaluated. The abscissa is expressed in 35mm equivalent focal length.
With its 5x optical tele module, the Xiaomi 17 Pro Max offers the longest native focal length among current flagship devices, most of which are limited to 3x to 3.5x factors. Its longer tele lens allows the Xiaomi to stand out, particularly at longer zoom settings, where optical capture can provide clear benefits. This said, some limitations become apparent at medium tele zoom, where the camera relies on cropping the primary camera image. At these settings detail preservation is therefore lower than on competing devices that already use the dedicated tele camera at medium range. After the switch to the 5x tele, image quality improves noticeably, with sharper rendering and better textures, allowing the Xiaomi to catch up with its peers.
At longer zoom ranges, where cropping of the the tele camera image is necessary, the Xiaomi, like many of its rivals, relies on AI-powered processing to enhance fine detail. While this approach helps recover structure, its effectiveness is somewhat limited. Detail rendering can look unnatural, especially in portrait shots, where textures can appear uneven and slightly artificial.
Exposure and color rendering are generally well controlled and reliable across the zoom range, ensuring consistently pleasant results in most conditions. Overall, the Xiaomi 17 Pro Max delivers a competent and versatile tele zoom experience. While medium range detail and AI rendering at long tele settings leave some room for refinement, the Xiaomi is overall competitive in the tele zoom category and offers clear advantages to those who frequently shoot at longer focal lengths.
DXOMARK CHART (DMC) detail preservation score per focal length
This graph shows the evolution of the DMC detail preservation score with respect to the full-frame equivalent focal length for different light conditions. The x-axis represents the equivalent focal length measured for each corresponding shooting distance and the y-axis represents the maximum details preservation metric score: higher value means better quality. Large dots correspond to zoom ratio available in the user interface of the camera application.
Xiaomi 17 Pro Max - Long range tele
Xiaomi 17 Pro Max - Good overall quality, high levels of detail
Apple iPhone 17 Pro - Long range tele
Apple iPhone 17 Pro - Slight loss of detail
Honor Magic 8 Pro - Long range tele
Honor Magic 8 Pro - Fairly good detail, slightly inaccurate color rendering
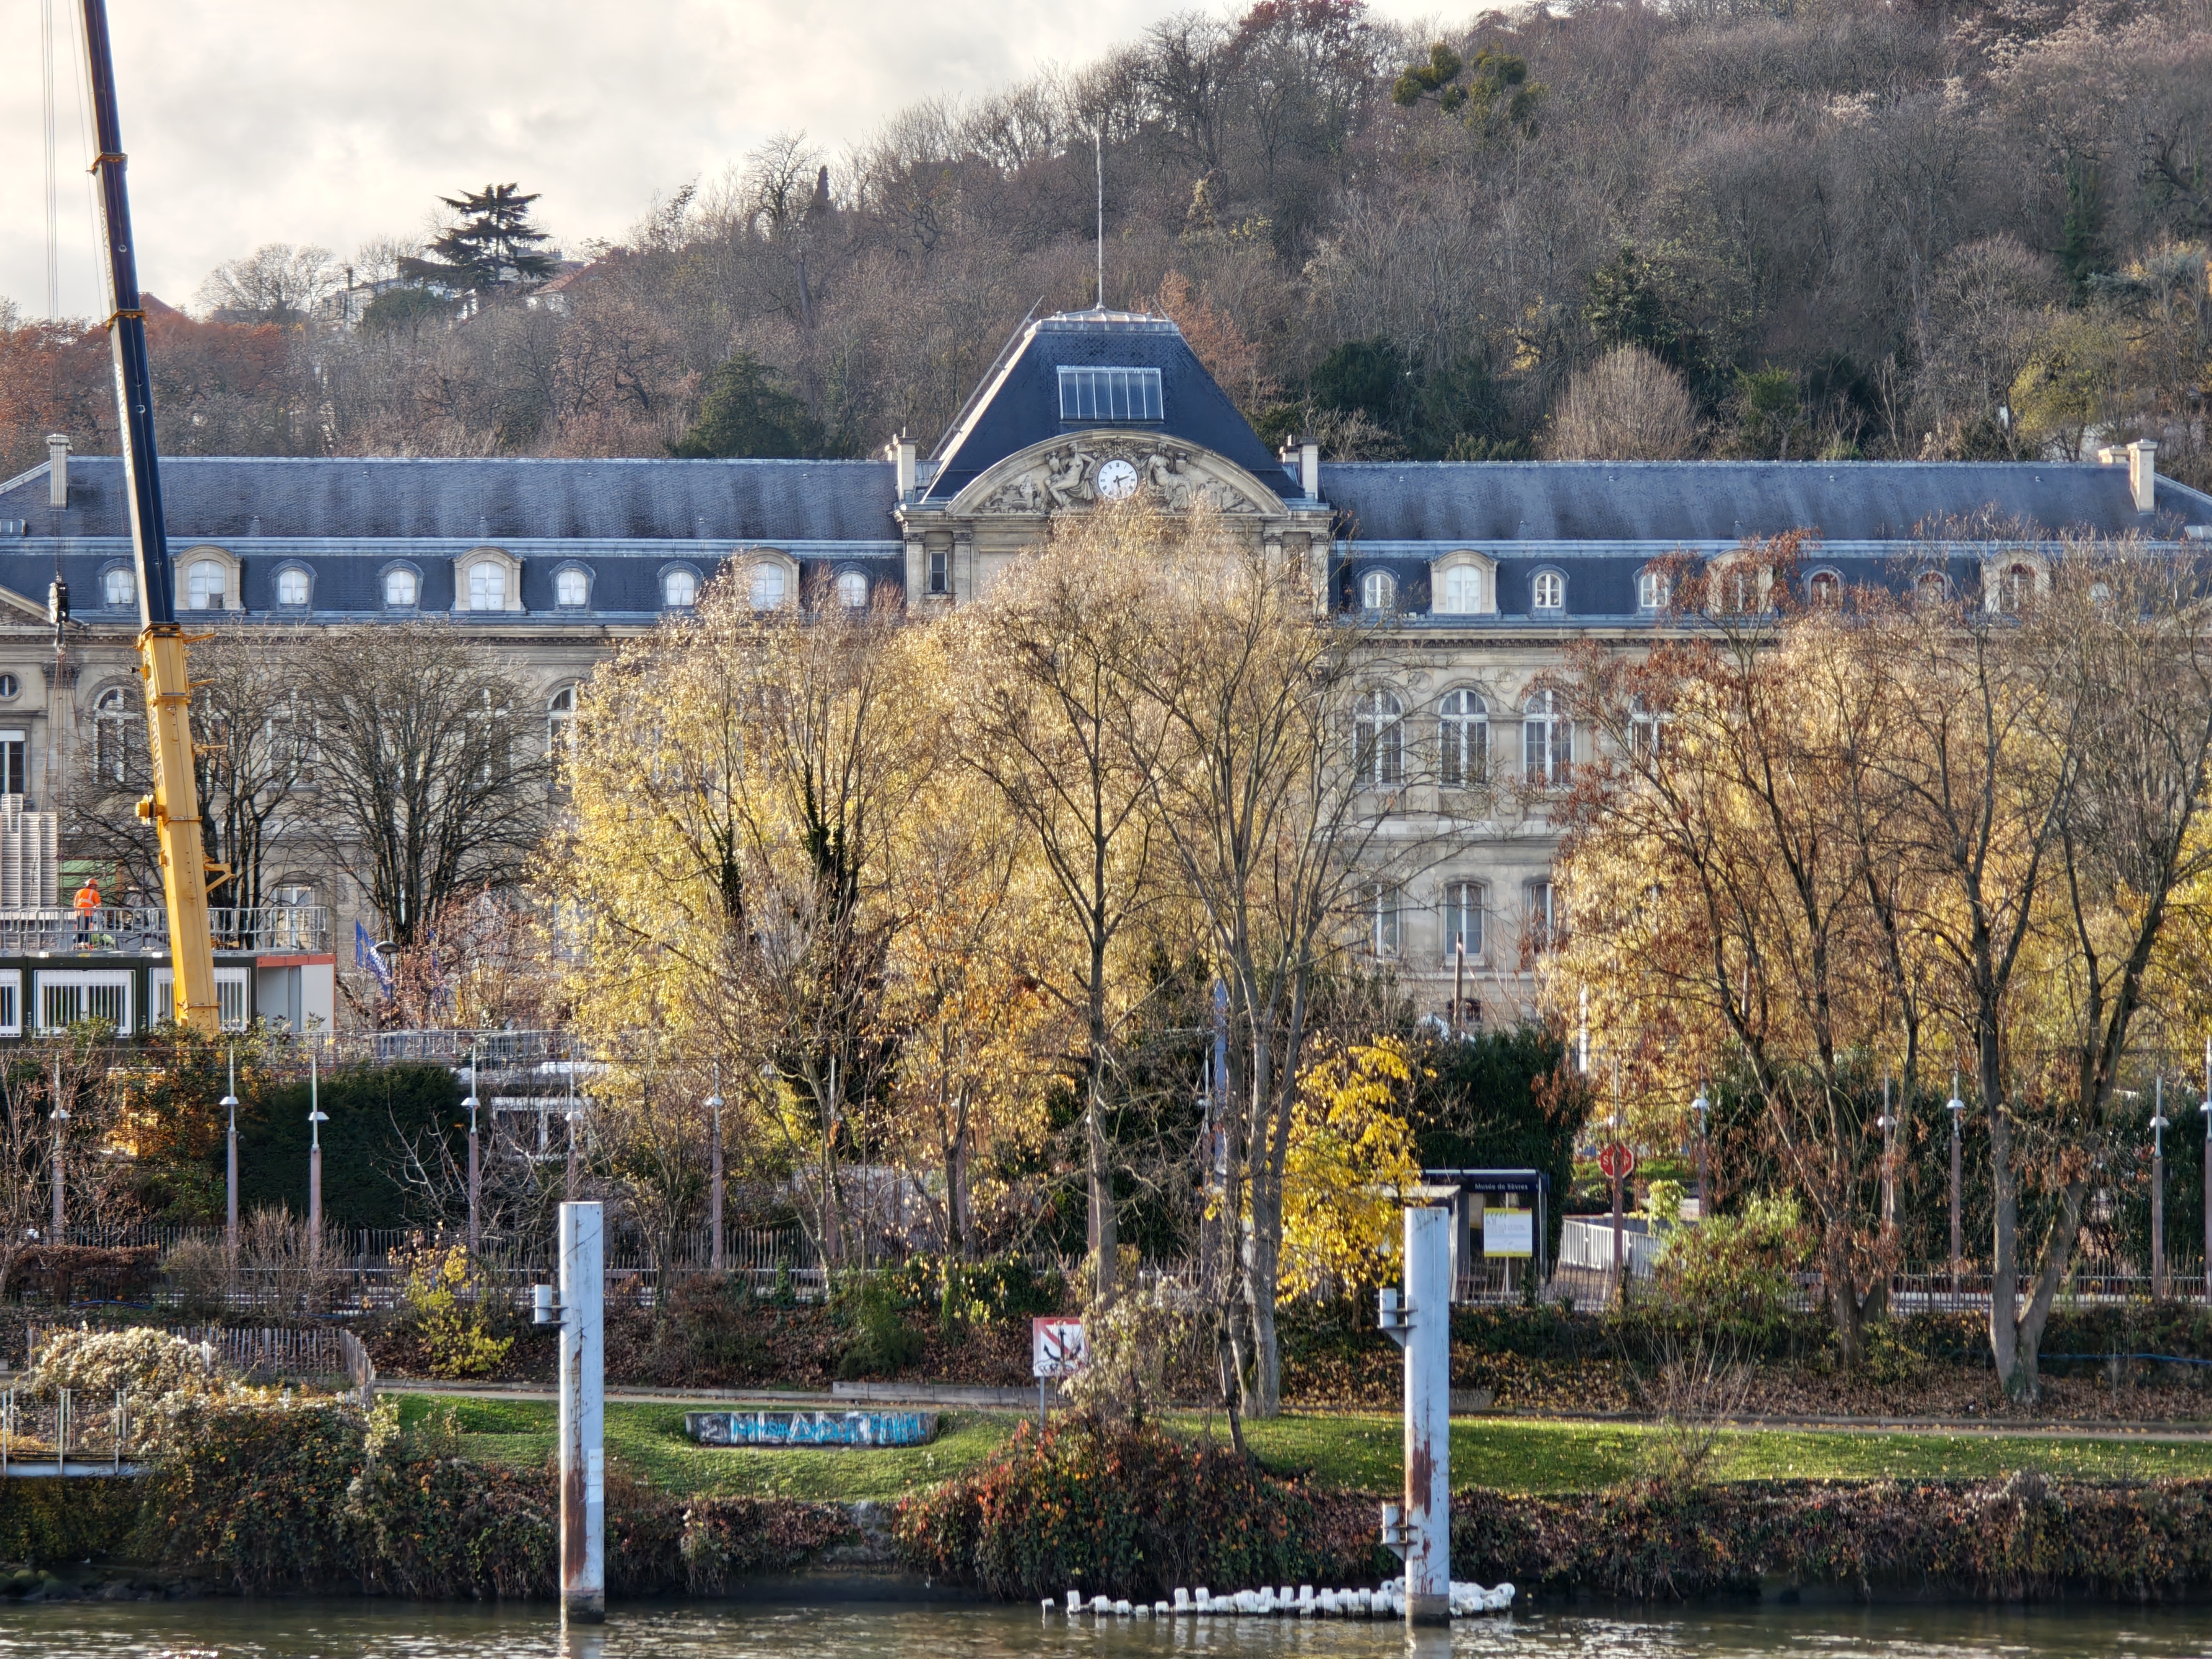
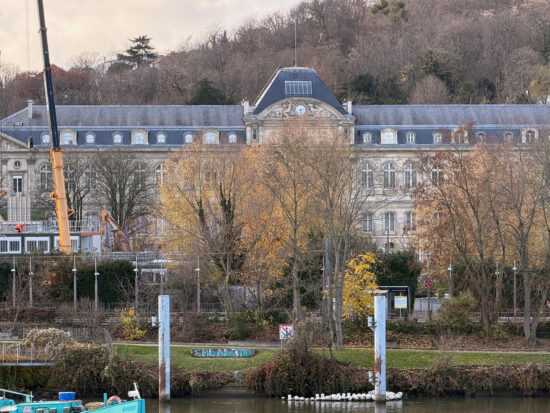
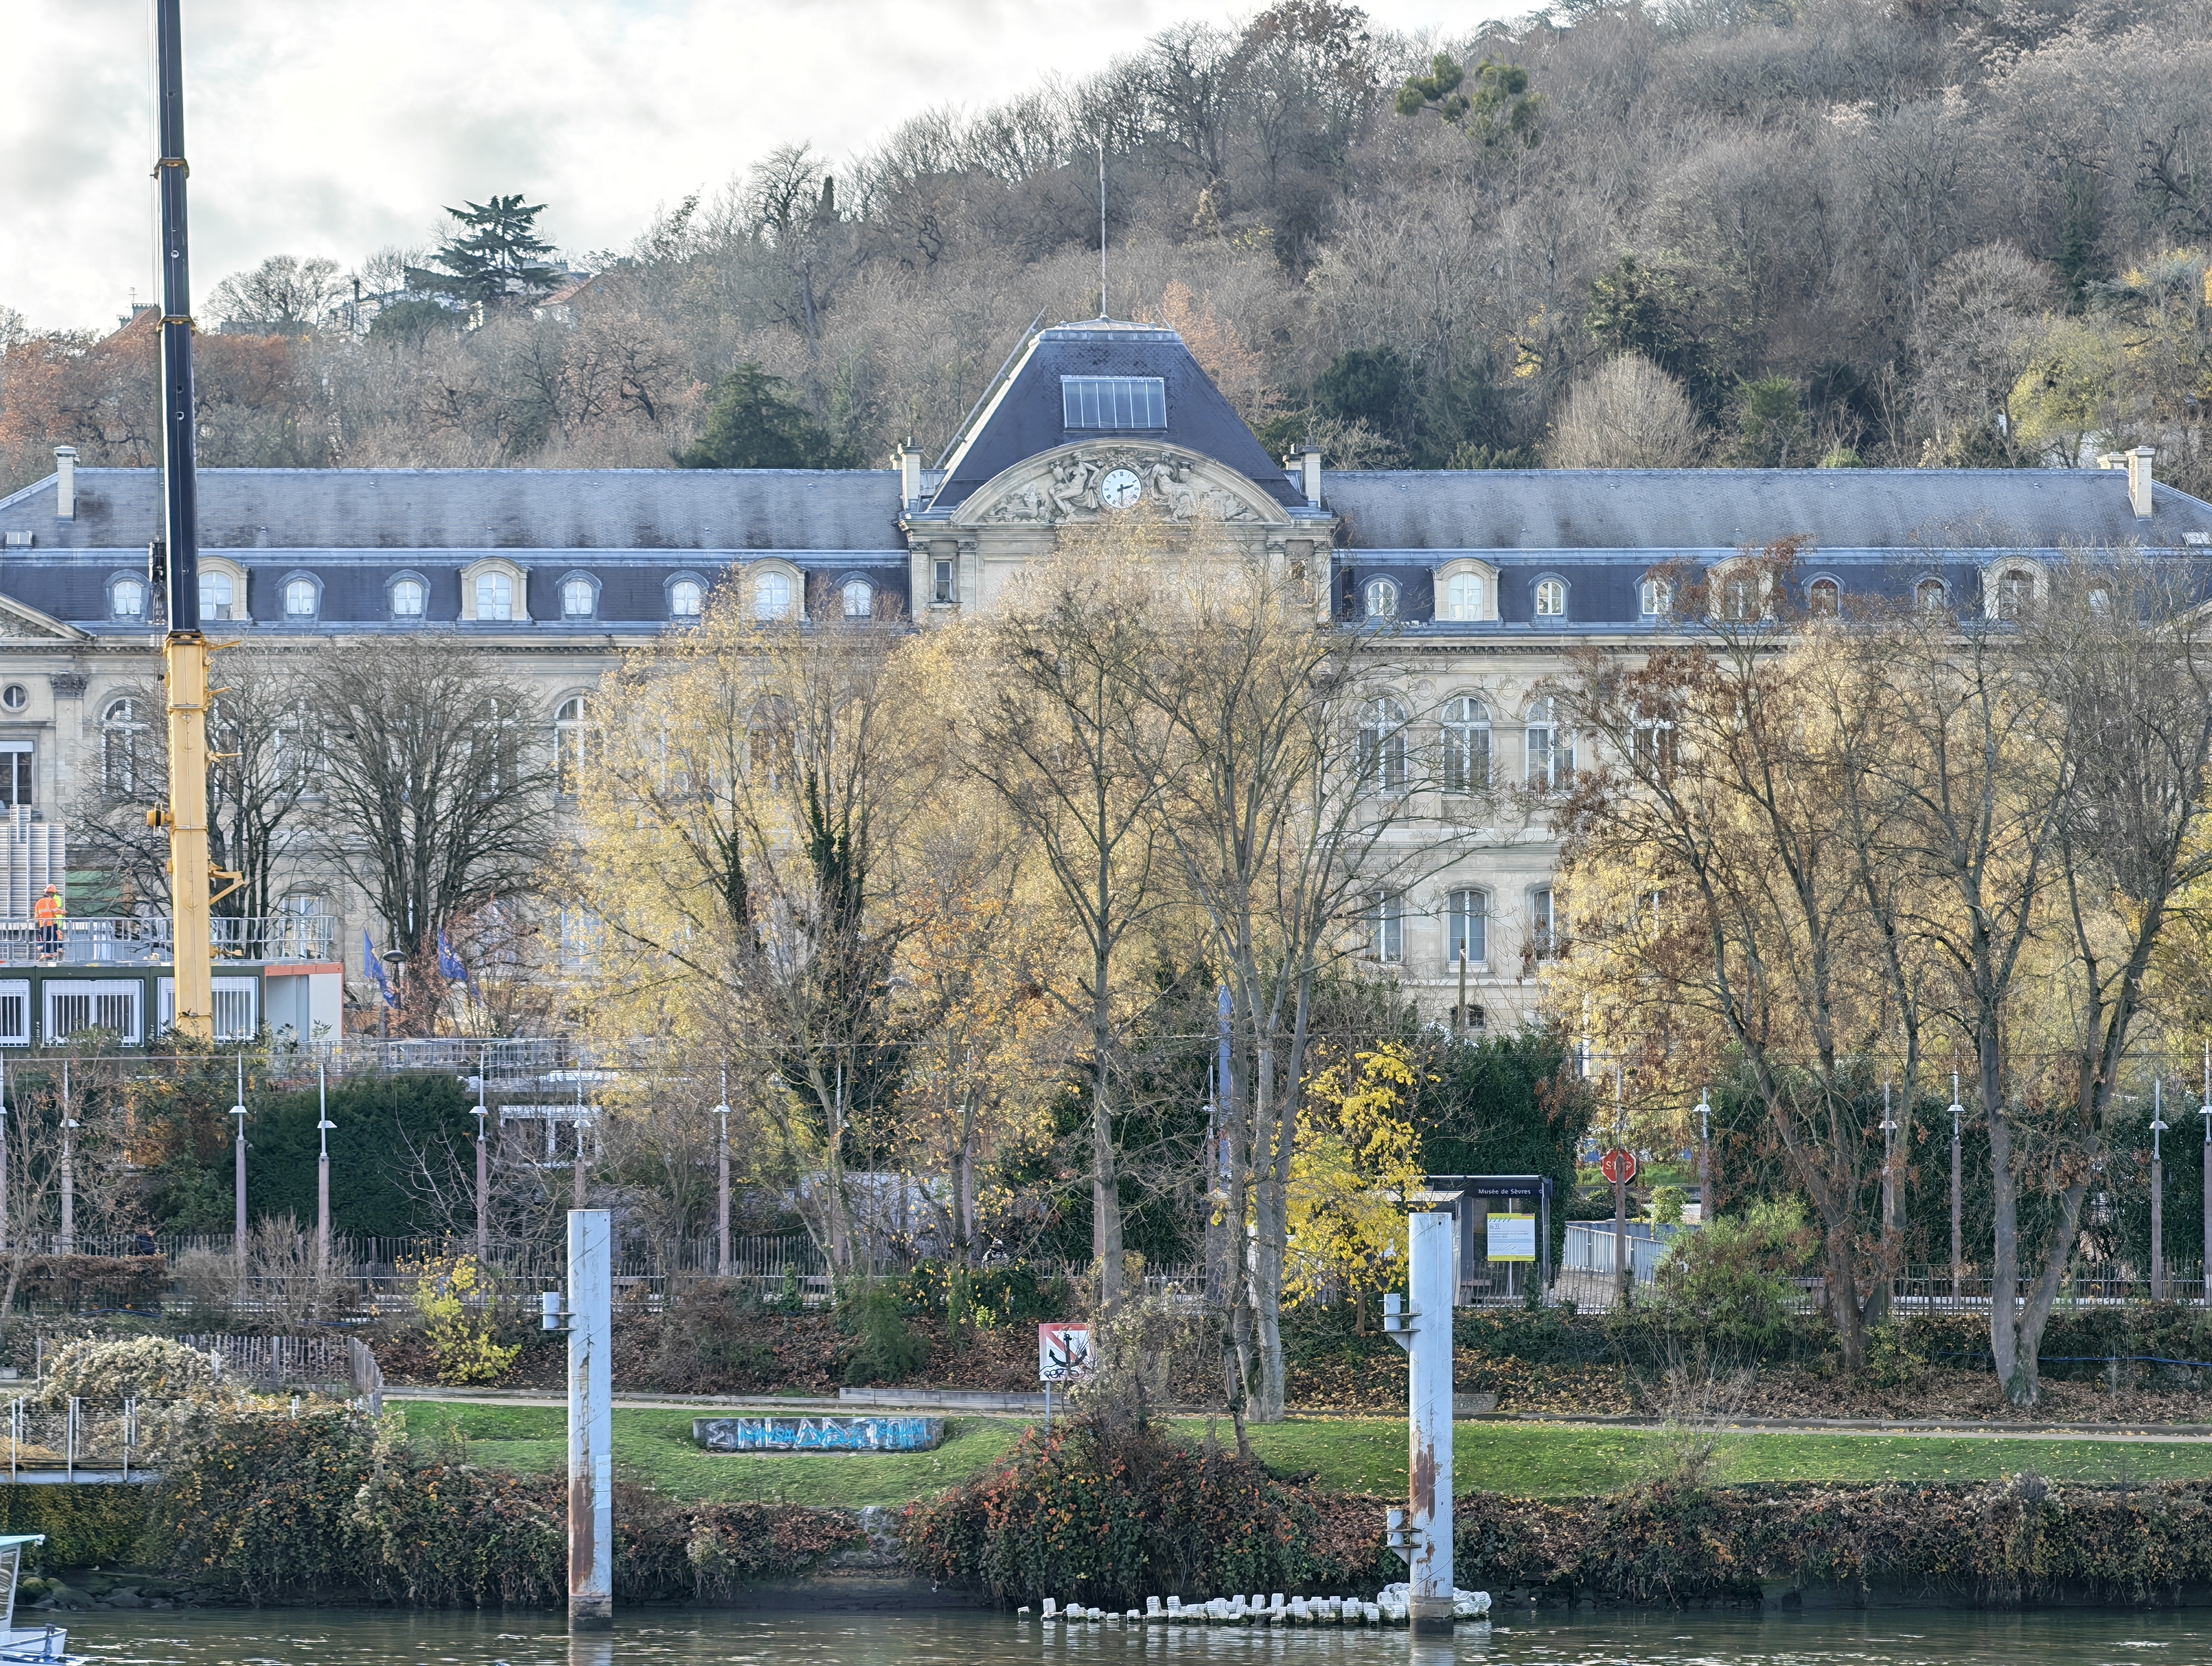
These tests analyze the performance of the ultra-wide camera at several focal lengths from 12 mm to 20 mm. All image quality attributes are evaluated, with particular attention paid to such artifacts as chromatic aberrations, lens softness, and distortion. Pictures below are an extract of tested scenes.
Xiaomi 17 Pro Max Ultra-Wide Scores
This graph illustrates the relative scores for the different zoom ranges evaluated. The abscissa is expressed in 35mm equivalent focal length.
Images captured with the Xiaomi’s ultra-wide camera are generally crisp and bright. Overall, the camera captures good levels of detail while noise levels are kept low. Color rendering is generally pleasant and target exposure is usually accurate. However, with an equivalent focal length of 17mm, the field of view is narrower than on the ultra-wide cameras of the competition.
DXOMARK CHART (DMC) detail preservation score per focal length
This graph shows the evolution of the DMC detail preservation score with respect to the full-frame equivalent focal length for different light conditions. The x-axis represents the equivalent focal length measured for each corresponding shooting distance and the y-axis represents the maximum details preservation metric score: higher value means better quality. Large dots correspond to zoom ratio available in the user interface of the camera application.
Xiaomi 17 Pro Max – Slightly more limited field of view than competitors, good overall image quality, slightly warm white balance
Apple iPhone 17 Pro – Wider field of view, good overall image quality
Honor Magic 8 Pro – Wider field of view, good overall image quality, slightly cold white balance
DXOMARK engineers capture and evaluate almost 3 hours of video in controlled lab environments and in natural low-light, indoor and outdoor scenes, using the camera’s default settings. The evaluation consists of visually inspecting natural videos taken in various conditions and running objective measurements on videos of charts recorded in the lab under different conditions from 0.1 to 10000+ lux and color temperatures from 2,300K to 6,500K.
While in photo mode the Xiaomi 17 Pro Max can fully live up to its flagship ambitions, its video capabilities lag somewhat behind the best-in-class devices, such as Apple’s iPhone 17 Pro Max. That said, the device delivers a solid and competitive video experience, particularly when recording in good light.
Video exposure is outstanding, with the Xiaomi 17 Pro Max sharing the top spot in this category with the Vivo X300 Pro. Target exposure is accurate, and the camera captures a wide dynamic range, preserving detail in both highlights and shadows. This means the Xiaomi is ideal for outdoor recording, where results are consistently pleasing. However, some limitations become noticeable in more difficult light conditions. In lower light and in mixed lighting scenes, noise becomes more intrusive and unstable white balance transitions can lead to inconsistent color rendering. These issues become more pronounced at the light gets dimmer. Noise levels increase further and skin tones can take on a less natural appearance.
Video autofocus usually works well when recording static scenes, but can struggle with tracking moving subjects, sometimes hesitating to lock onto the correct target. In addition, video stabilization falls slightly behind what is typically expected from a flagship device, with camera shake remaining noticeable, even when standing still during recording.
Overall, the Xiaomi 17 Pro Max delivers a good video performance with excellent exposure and dynamic range in bright conditions, but it still has some room for improvement in low light. Autofocus tracking, and stabilization also need some improvement to allow the Xiaomi to truly compete with the very best video-centric smartphones.
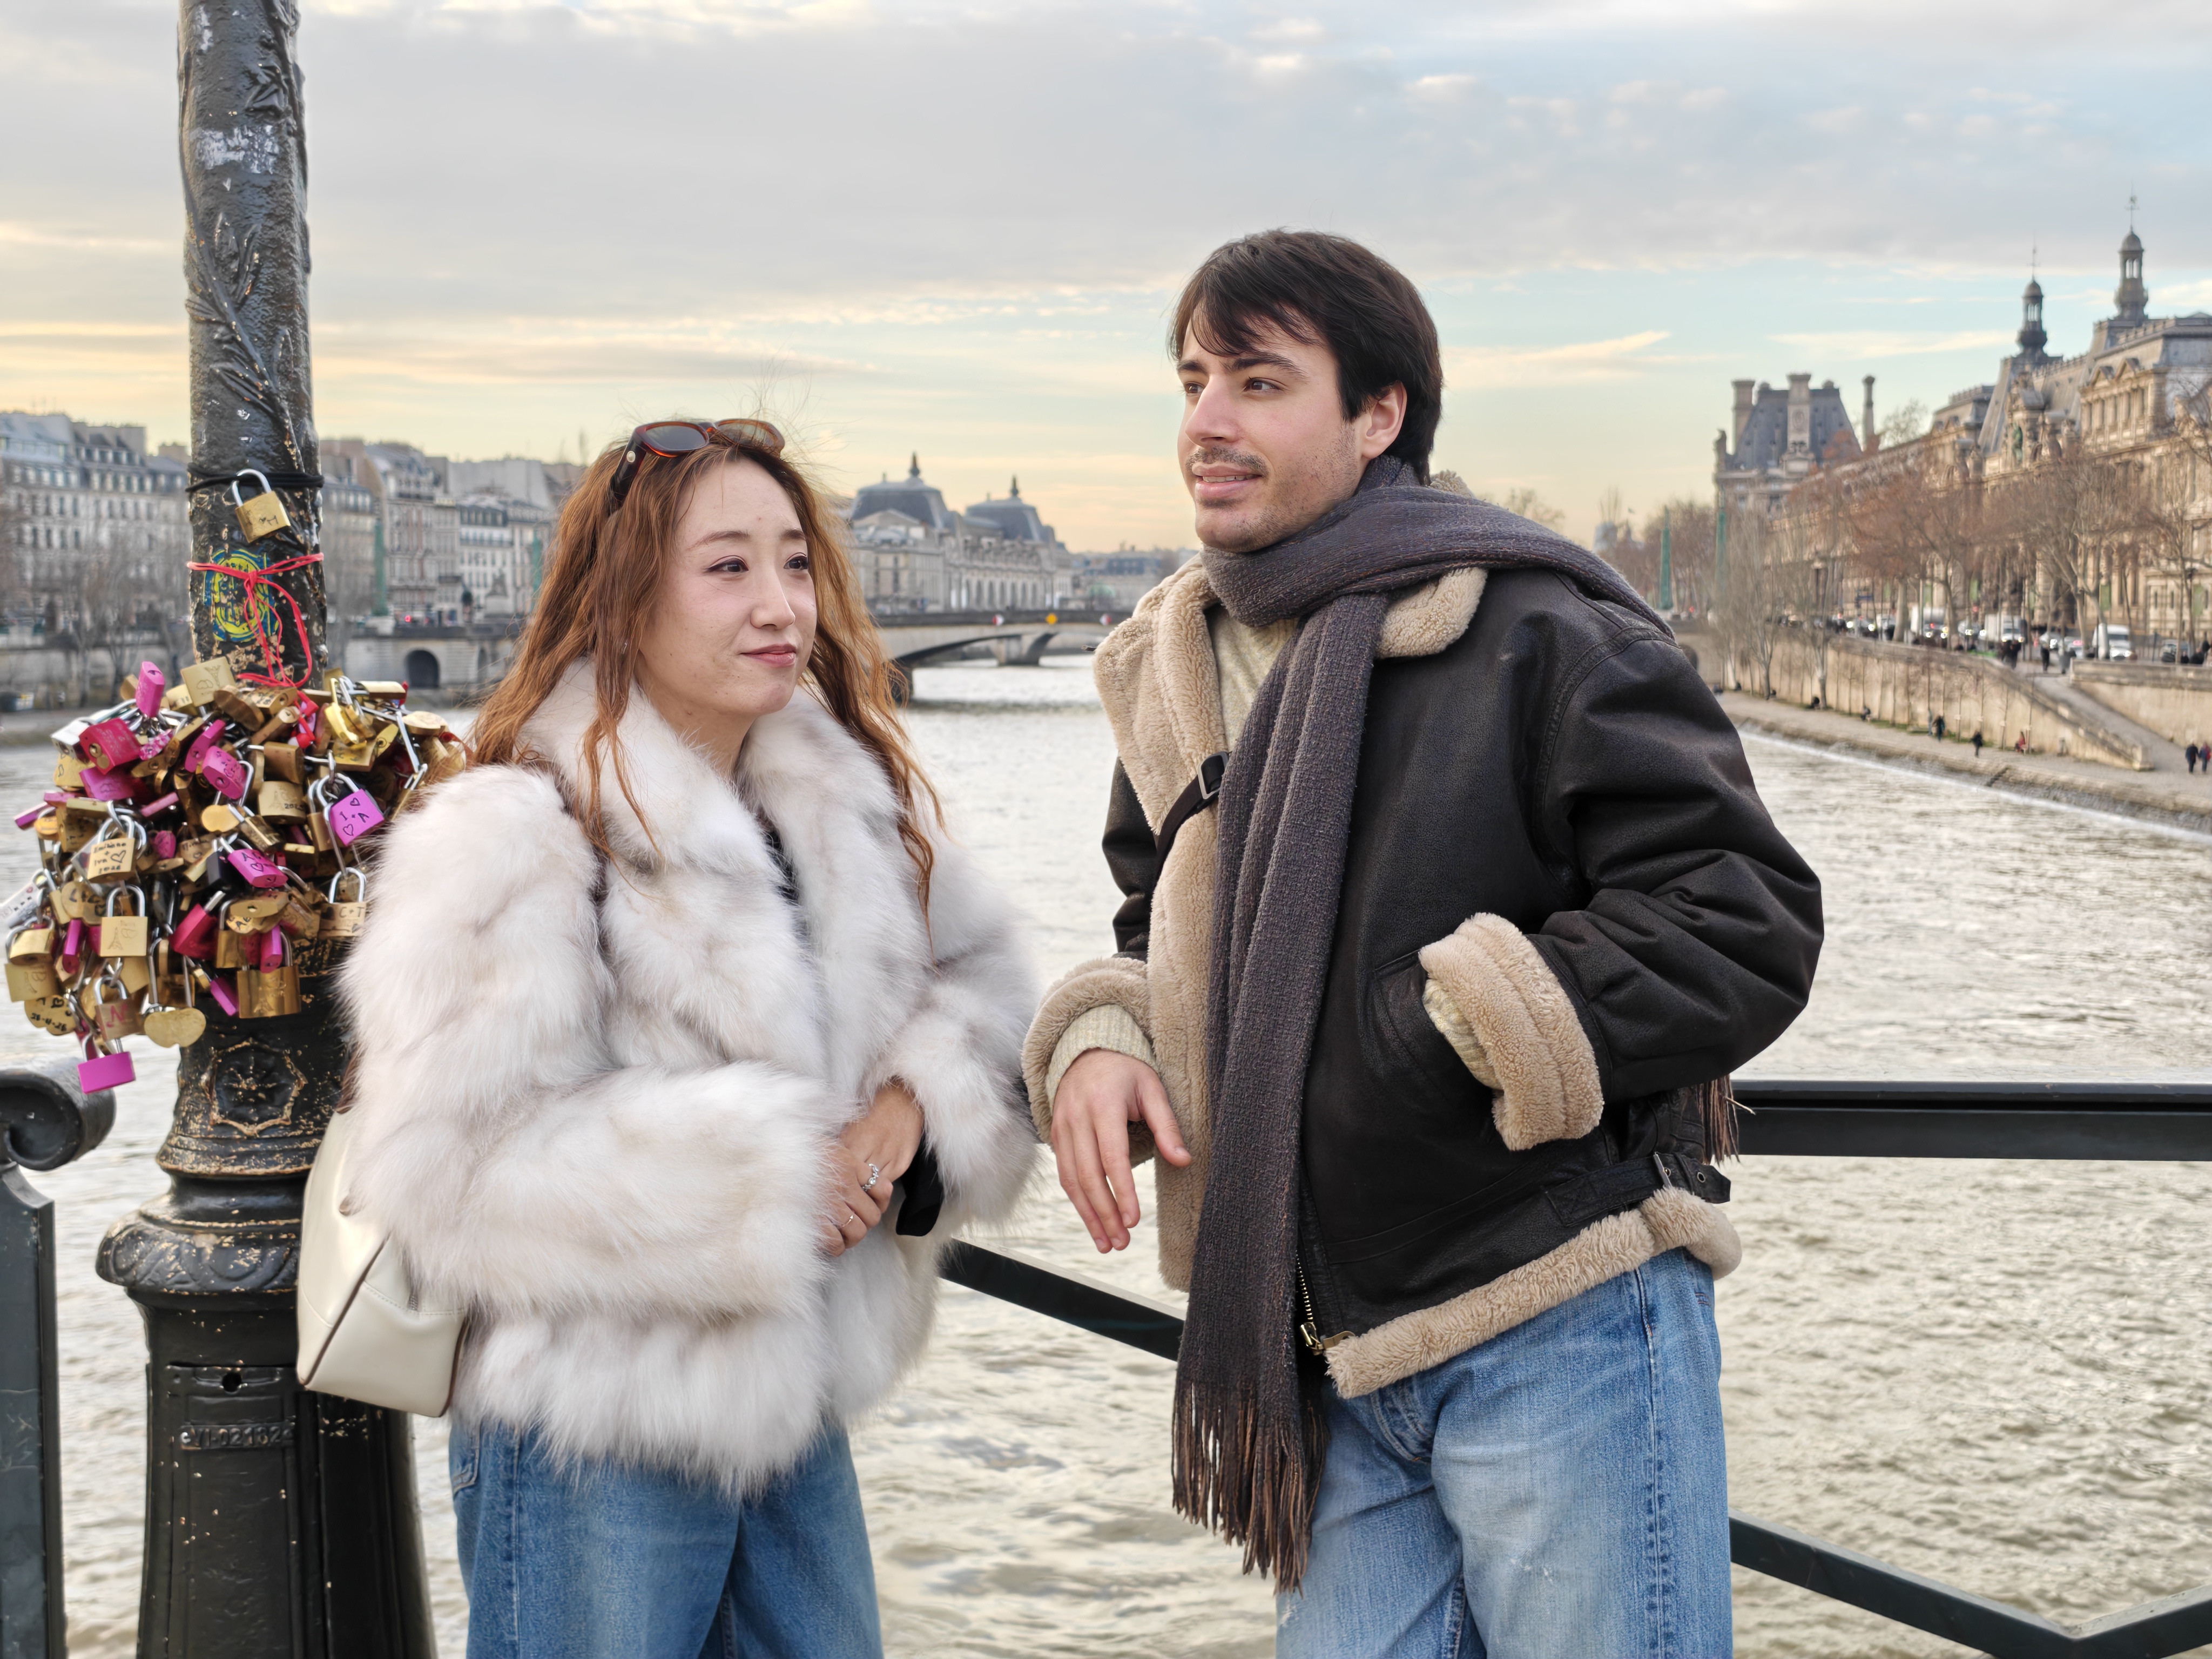
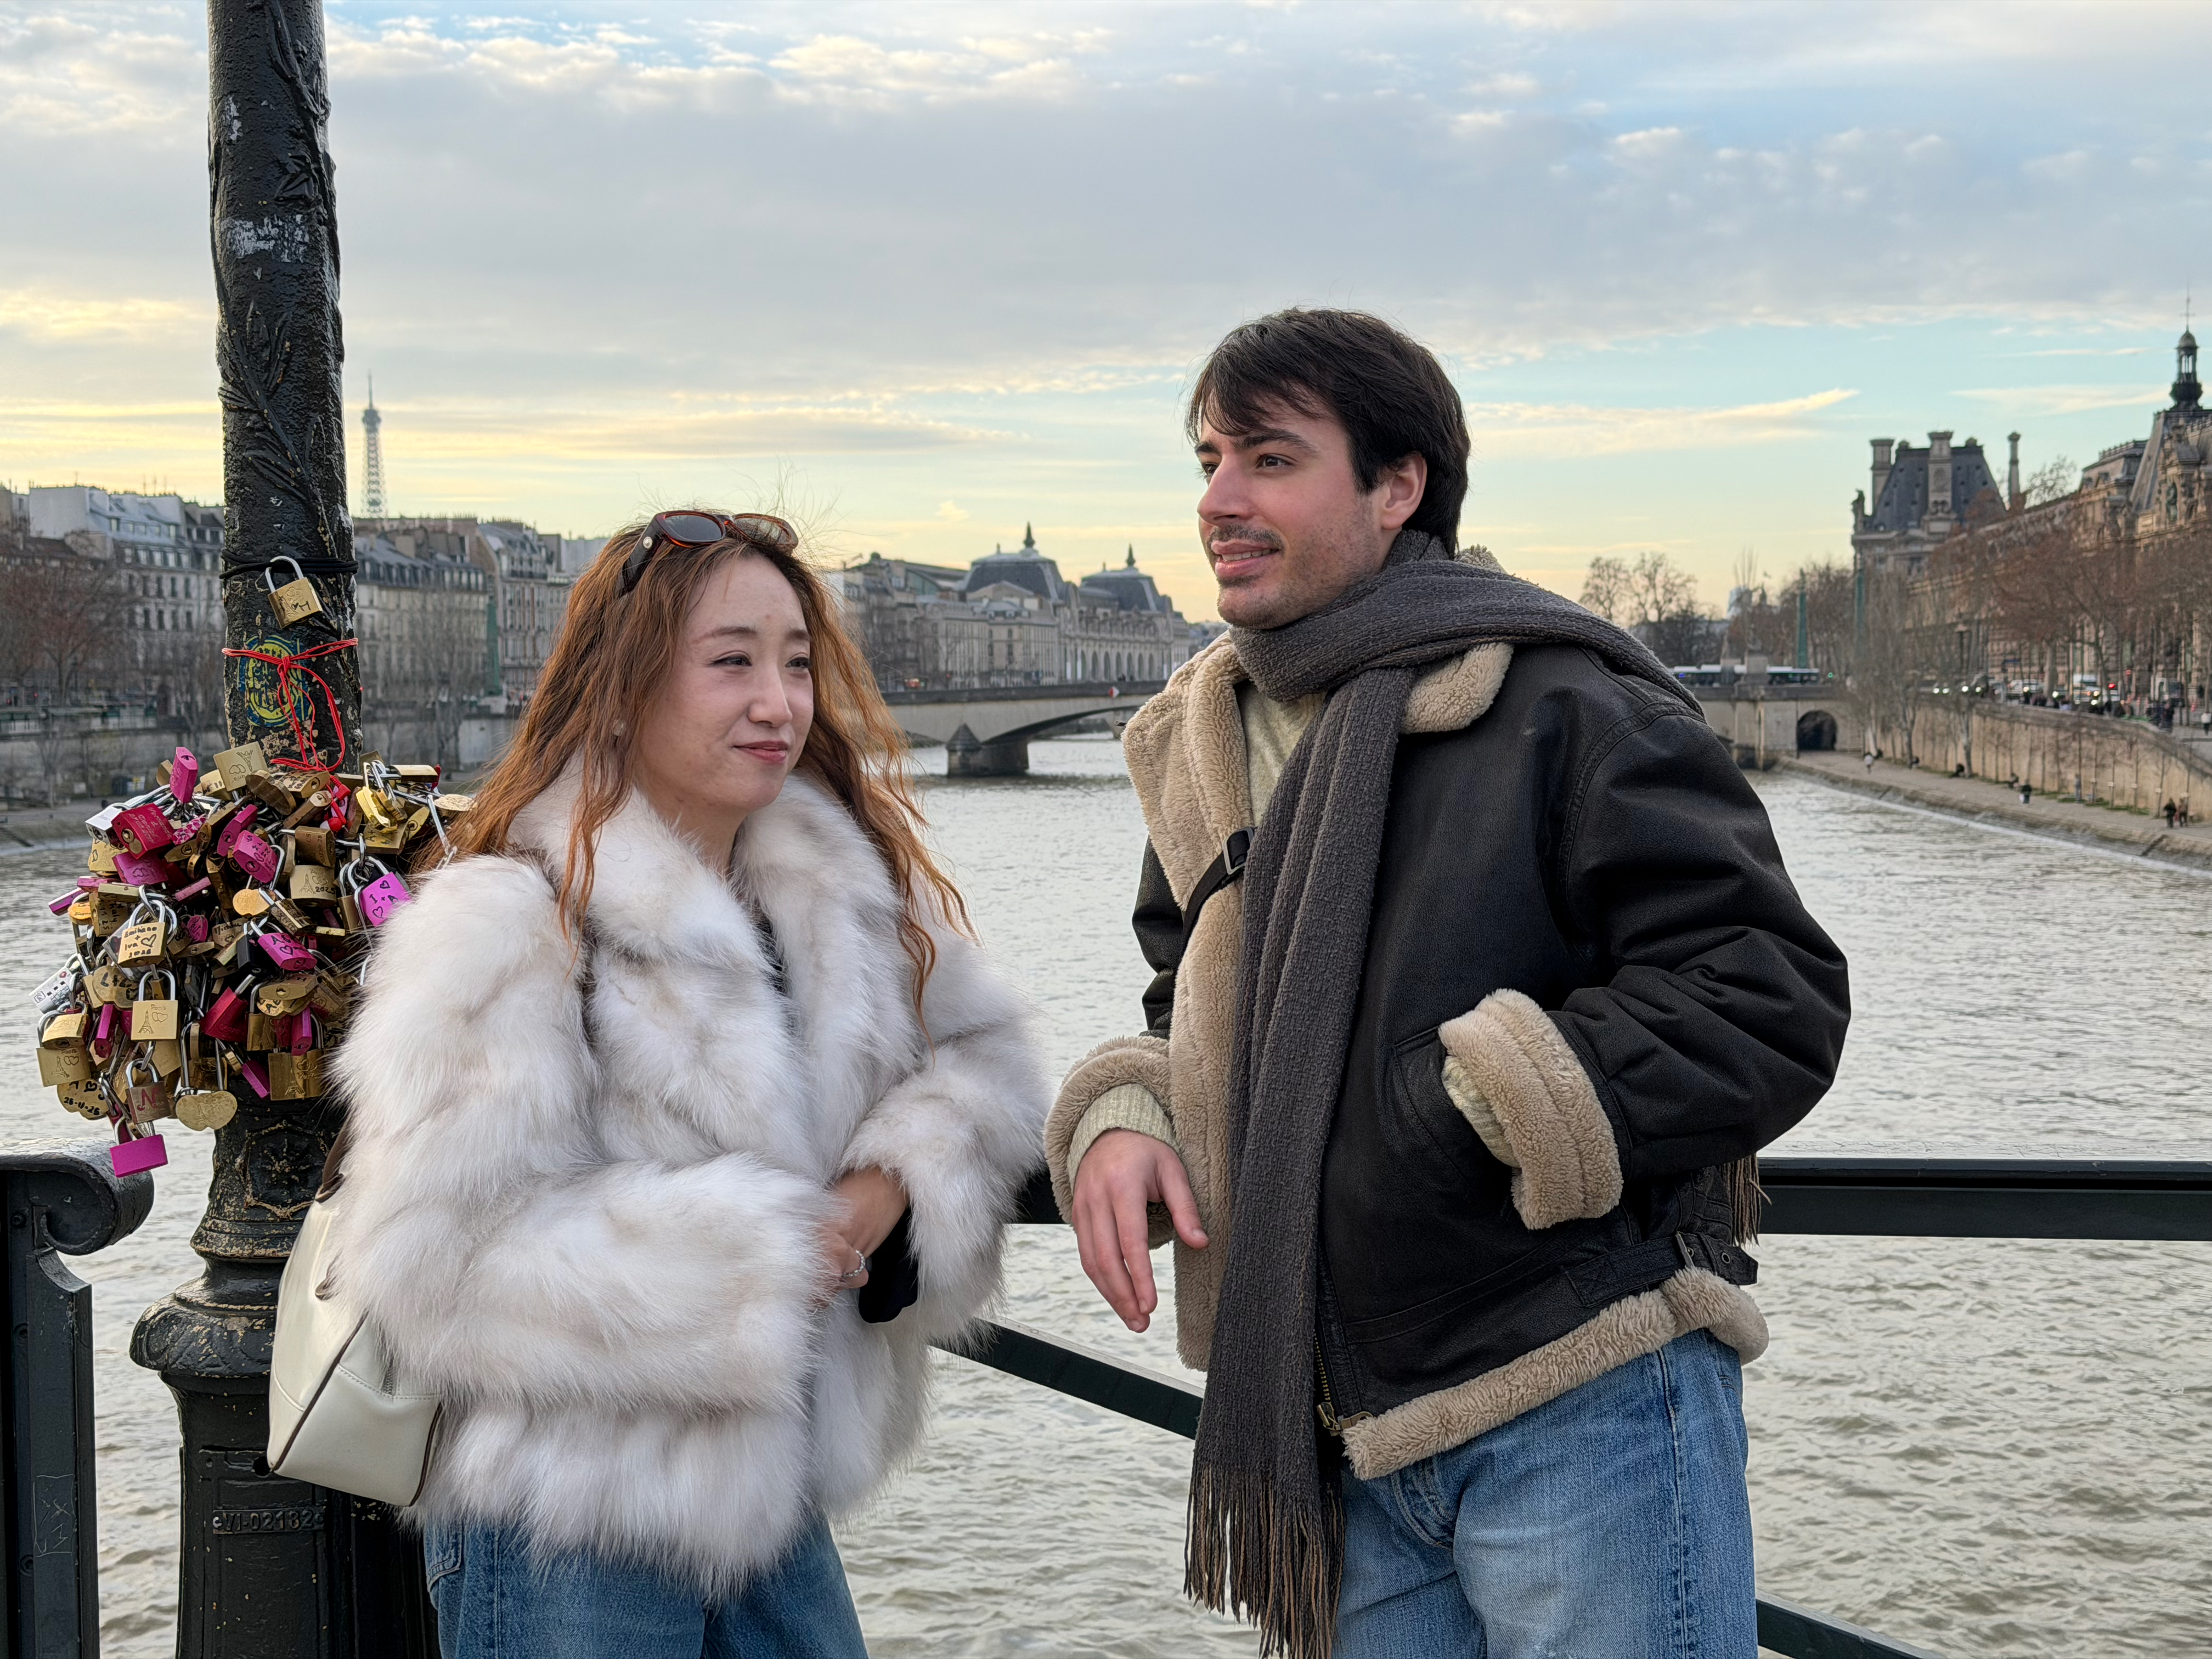
Xiaomi 17 Pro Max – Overall accurate target exposure and color
Main
155
Xiaomi 17 Pro Max
186
Apple iPhone 17 Pro
Apple iPhone 17 Pro
Xiaomi 17 Pro Max Video scores
Video Main tests analyze the same image quality attributes as for still images, such as exposure, color, texture, or noise, in addition to temporal aspects such as speed, and smoothness and stability of exposure, white balance, and autofocus transitions.
Exposure tests evaluate the brightness level of the main subject, the global contrast and the ability to render the dynamic range of the scene (ability to render visible details in both bright and dark areas). When the camera provides Video HDR format, the videos are analyzed with a visualization on an HDR reference monitor, under reference conditions specified in the metadata. Stability and temporal adaption of the exposure are also analyzed.
Brightness on face with illuminance levels (Diana)
These graphs represent the output level on the face measured on the images captured by the device under test in multiple lighting conditions on the AFHDR Portrait setup. We show here the intensity measured on the forehead of the realistic mannequin, for a picture displayed on a HDR monitor in standard ISO/TS 22028-5 playback conditions. The multiple lighting conditions of the scene are characterized by the illumination level in lux and the relative brightness of the backlit panel simulating high dynamic range conditions. Delta EV specifies the difference of luminance in stops between the face and the light panel simulating HDR conditions. The intensity is measured in JND derived from the ICtCp color space.
Image-quality color analysis looks at color rendering, skin-tone rendering, white balance, color shading, stability of the white balance and its adaption when light is changing.
Xiaomi 17 Pro Max – Accurate color, but slight white balance instabilities
Apple iPhone 17 Pro – Accurate color, stable white balance
Honor Magic 8 Pro – Accurate colors, but slight white balance instabilities
Texture tests analyze the level of details and texture of the real-life videos as well as the videos of charts recorded in the lab. Natural videos recordings are visually evaluated, with particular attention paid to the level of details in the bright and areas as well as in the dark. Objective measurements are performed of images of charts taken in various conditions from 0.1 to 10000 lux. The charts used are the DXOMARK chart (DMC) and Dead Leaves chart.
DXOMARK CHART (DMC) detail preservation video score vs lux levels
This graph shows the evolution of the DMC detail preservation video score with the level of lux in video. DMC detail preservation score is derived from an AI-based metric trained to evaluate texture and details rendering on a selection of crops of our DXOMARK chart.
Noise tests analyze various attributes of noise such as intensity, chromaticity, grain, structure, temporal aspects on real-life video recording as well as videos of charts taken in the lab. Natural videos are visually evaluated, with particular attention paid to the noise in the dark areas and high dynamic range conditions. Objective measurements are performed on the videos of charts recorded in various conditions from 0.1 to 10000 lux. The chart used is the DXOMARK visual noise chart.
Xiaomi 17 Pro Max – Slight loss of detail and noise
Apple iPhone 17 Pro – Slight loss of detail, noise well under control
Spatial visual noise evolution with the illuminance level
This graph shows the evolution of spatial visual noise with the level of lux. Spatial visual noise is measured on the visual noise chart in the video noise setup. DXOMARK visual noise measurement is derived from ISO15739 standard.
Temporal visual noise evolution with the illuminance level
This graph shows the evolution of temporal visual noise with the level of lux. Temporal visual noise is measured on the visual noise chart in the video noise setup.
Stabilization evaluation tests the ability of the device to stabilize footage thanks to software or hardware technologies such as OIS, EIS, or any others means. The evaluation looks at residual motion, smoothness, jello artifacts and residual motion blur on walk and run use cases in various lighting conditions. The video below is an extract from one of the tested scenes.
Xiaomi 17 Pro Max – Camera shake, even when standing still during recording
Artifacts are evaluated with MTF and ringing measurements on the SFR chart in the lab as well as frame-rate measurements using the LED Universal Timer. Natural videos are visually evaluated by paying particular attention to artifacts such as aliasing, quantization, blocking, and hue shift, among others. The more severe and the more frequent the artifact, the higher the point deduction from the score. The main artifacts and corresponding point loss are listed below.
All image quality attributes are evaluated at focal lengths from approximately 12 mm to 300 mm, with particular attention paid to texture and smoothness of the zooming effect. The score is derived from a number of objective measurements in the lab and perceptual analysis of real-life video recordings.
DXOMARK CHART (DMC) detail preservation score per focal length
This graph shows the evolution of the DMC detail preservation score with respect to the full-frame equivalent focal length for different light conditions. The x-axis represents the equivalent focal length measured for each corresponding shooting distance and the y-axis represents the maximum details preservation metric score: higher value means better quality. Large dots correspond to zoom ratio available in the user interface of the camera application.