We put the Xiaomi RedmiBook Pro 15 2023 Ryzen Edition through our rigorous DXOMARK Laptop test suite to measure its performance in sound, camera and display. In this review, we will break down how it fared in a variety of tests and several common use cases.
Overview
Scoring
Use-case and feature subscores included in the calculations of the global score
 Xiaomi RedmiBook Pro 15 2023 Ryzen Edition

47
camera
54
Apple MacBook Pro 14" (M3 Pro, 2023)
Best: Apple MacBook Pro 14" (M3 Pro, 2023) (93)
34
Lenovo ThinkPad X9 Aura
Best: Lenovo ThinkPad X9 Aura (56)
26
Microsoft Surface Laptop 13-inch
Best: Microsoft Surface Laptop 13-inch (79)
59
Apple MacBook Pro 14" (M2 Pro, 2023)
Best: Apple MacBook Pro 14" (M2 Pro, 2023) (83)
125
display
75
Apple MacBook Pro 14" (M3 Pro, 2023)
Best: Apple MacBook Pro 14" (M3 Pro, 2023) (84)
60
Apple MacBook Pro 14" (M3 Pro, 2023)
Best: Apple MacBook Pro 14" (M3 Pro, 2023) (95)
57
Honor MagicBook View 14 (2022)
Best: Honor MagicBook View 14 (2022) (84)
123
audio
123
Apple MacBook Pro 14" (M2 Pro, 2023)
Best: Apple MacBook Pro 14" (M2 Pro, 2023) (149)
120
Acer Swift Go 14
Best: Acer Swift Go 14 (133)
131
Asus Zenbook 14X OLED (2023)
Best: Asus Zenbook 14X OLED (2023) (153)
Pros
- Audio well suited for video calling
- Good management of reflections, thanks to matte screen
Cons
- Strong camera exposure instabilities and loss of details
- Low maximum brightness and inaccurate HDR colors
- Unsuitable audio for multimedia purposes
The Xiaomi RedmiBook Pro 15 2023 Ryzen Edition’s matte screen lends itself to good management of reflections, although the display’s maximum brightness is low, and its colors are inaccurate for HDR content. The camera has strong exposure instabilities and loses details. While unsuitable for multimedia playback, the laptop’s audio is well-suited for video calls, thanks to natural and intelligible recordings and voice renditions using the built-in speakers.
Test summary
About DXOMARK Laptop tests: For scoring and analysis in our laptop reviews, DXOMARK engineers perform a variety of objective tests and undertake more than 20 hours of perceptual evaluations under controlled lab conditions and real-life scenarios. (For more details about the Laptop protocol, click here.)
The following section gathers key elements of our exhaustive tests and analyses performed in DXOMARK laboratories. Detailed performance evaluations in the form of reports are available upon request. Do not hesitate to contact us.
Xiaomi RedmiBook Pro 15 2023 Ryzen Edition overall & use-cases scores
Video Call
107
Xiaomi RedmiBook Pro 15 2023 Ryzen Edition
144
Apple MacBook Pro 14" (M2 Pro, 2023)
Apple MacBook Pro 14" (M2 Pro, 2023)
About DXOMARK Laptop tests
DXOMARK's Video call use case is a score that evaluates how a device handles video calls and videoconferencing in multiple conditions. This score focuses on the camera performance and the capture and playback rendering of voices.
During video calls, the camera on the RedmiBook Pro 15 frequently shows strong exposure instabilities, and often loses details. Thanks to the display’s matte screen, reflections are well managed. The laptop’s audio provides very natural-sounding timbre and great intelligibility during video calls; however, recordings are not sufficiently directional, and background noises are intrusive.
Camera
47
Xiaomi RedmiBook Pro 15 2023 Ryzen Edition
135
Apple MacBook Pro 14" (M3 Pro, 2023)
Apple MacBook Pro 14" (M3 Pro, 2023)
Camera texture acutance on Deadleaves with illuminance levels
This graph shows the evolution of texture acutance with the level of lux measured on a Deadleaves chart.
The following graphs show the objective measurements performed in our camera labs:
Camera visual noise evolution with illuminance levels
This graph shows the evolution of spatial visual noise with the level of lux. Spatial visual noise is measured on the visual noise chart in the video noise setup. DXOMARK visual noise measurement is derived from ISO15739 standard.
Target exposure on face with illuminance levels
These measurements take place on a setup combining realistic mannequins and a backlit panel simulating high dynamic range conditions. This graph shows the evolution of lightness measured on the forehead of the realistic mannequin with the level of lux, for multiple lighting conditions. The lightness is measured in L*. Delta EV specifies the difference of luminance in stops between the face and the light panel simulating HDR conditions.
Target exposure on face with illuminance levels in HDR conditions
These measurements take place on a setup combining realistic mannequins and a backlit panel simulating high dynamic range conditions. This graph shows the evolution of lightness measured on the forehead of the realistic mannequin with the level of lux, for multiple lighting conditions. The lightness is measured in L*. Delta EV specifies the difference of luminance in stops between the face and the light panel simulating HDR conditions.
Audio
127
Xiaomi RedmiBook Pro 15 2023 Ryzen Edition
144
Apple MacBook Pro 14" (M2 Pro, 2023)
Apple MacBook Pro 14" (M2 Pro, 2023)
Audio capture scores comparison
The following graphs show the frequency response, distortion and directivity in capture, recorded in our semi-anechoic room:
Audio capture frequency response
A 1/12 octave frequency response graph, which measures the volume of each frequency captured by the laptop when recording an objective test signal at 1 meter in an anechoic environment.
Audio capture Total Harmonic Distortion + Noise
This graph shows the Total Harmonic Distortion and Noise over the hearable frequency range. It represents the distortion and noise of the device capturing our test signal.
Audio capture directivity
Directivity graph of the laptop microphone(s) when capturing test signals using the camera app. It represents the acoustic energy (in dB) over the angle of incidence of the sound source (normalized to the angle 0°, in front of the device).
About DXOMARK Laptop tests
DXOMARK's Music and Video use case score evaluates the capability of a device to reproduce multimedia usages such as videos, movies and music playback in indoor conditions. This score focuses on the display performance and audio-playback rendering.
Even though the RedmiBook Pro 15 manages EOTF well for SDR content, it does not render HDR colors accurately. Display maximum brightness is a bit low for comfortable viewing. While the audio provides an immersive stereo rendition during multimedia playback, there is a lack of bass and brightness; furthermore, compression and distortion impair music rendition.
The following chart presents the display subscores for the multimedia use case:
Display scores comparison
The following graphs show the objective measurements performed in our display lab:
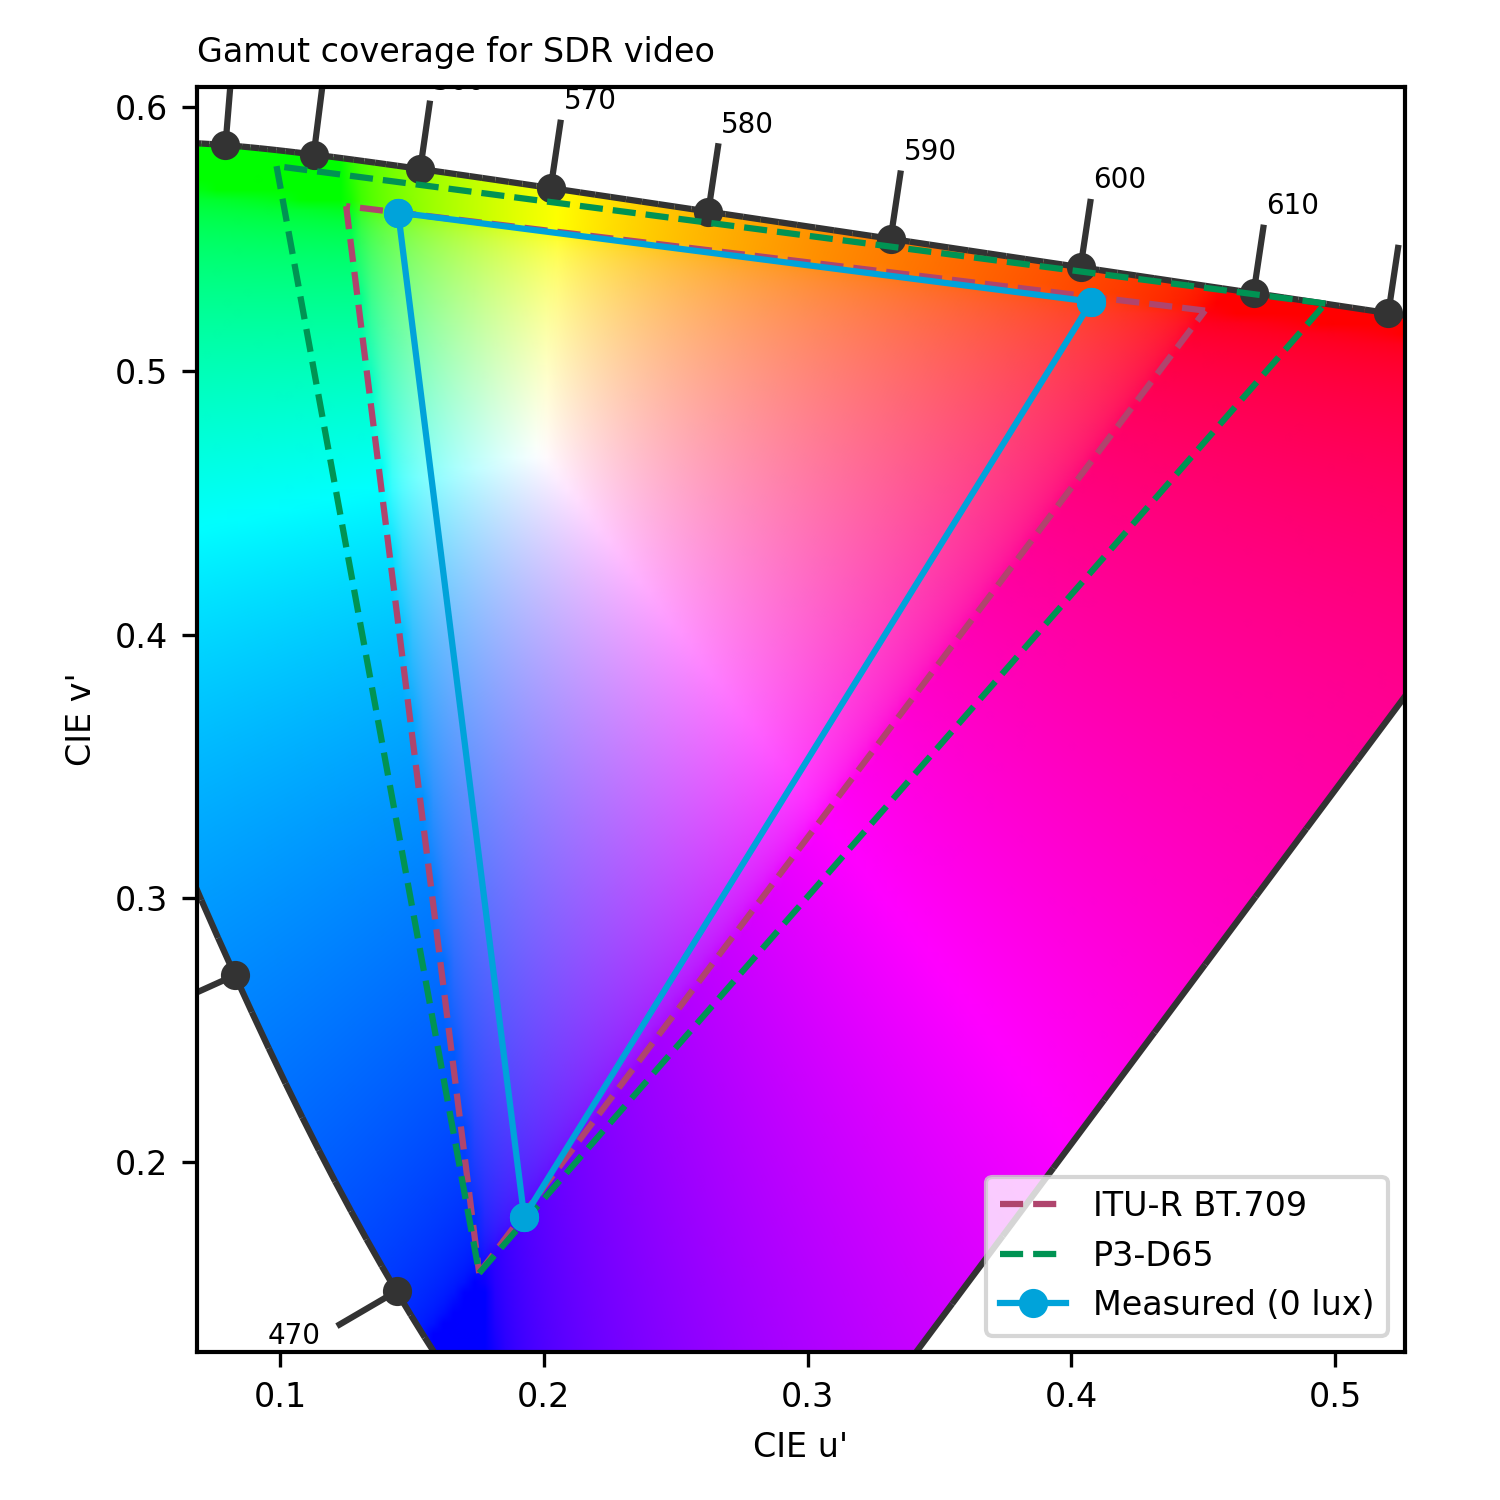
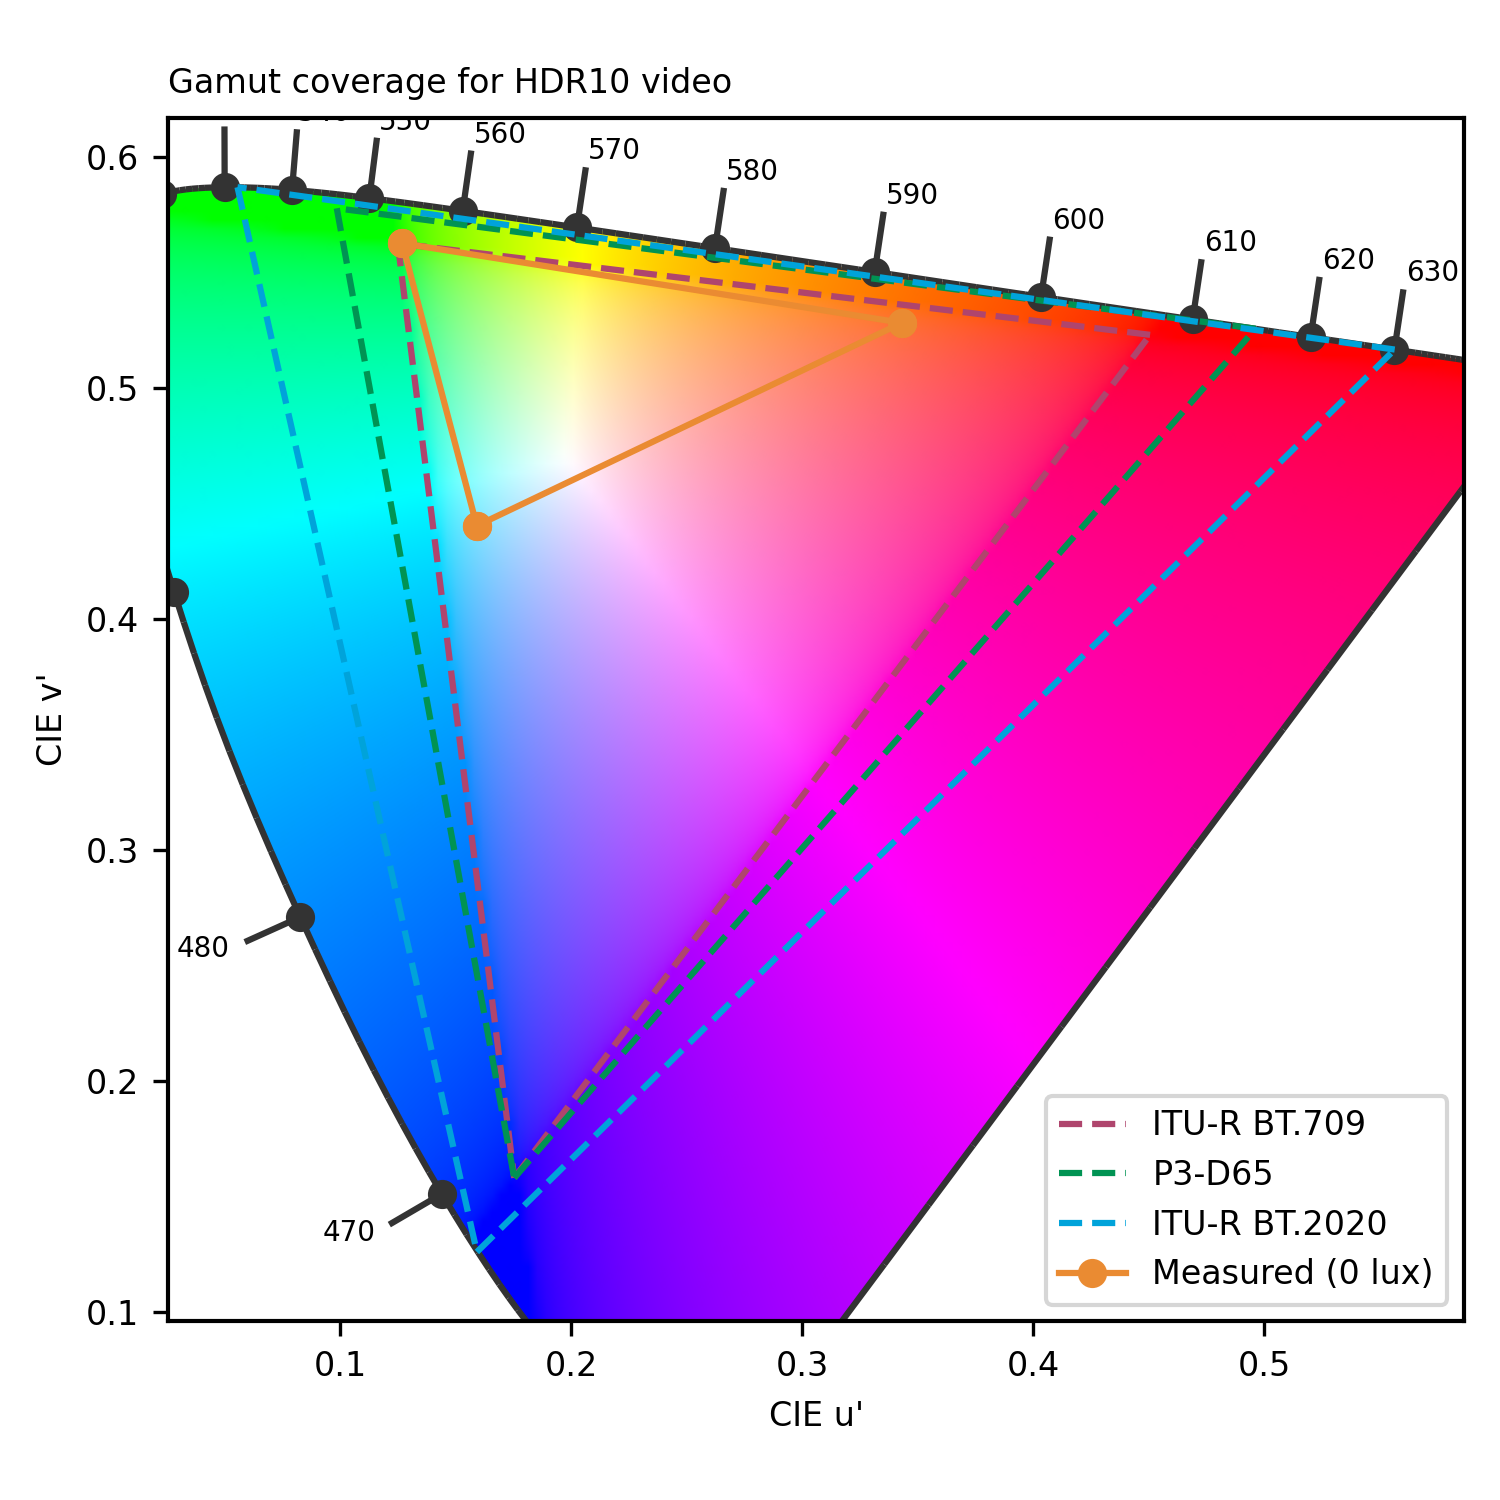
Display gamut coverage for video contents
The primary colors are measured both in HDR10 and SDR. The extracted color gamut shows the extent of the color area that the device can render. To respect the artistic intent, the measured gamut should match the master color space of each video.
Display reflectance measurement (SCI)
Measurements above show the reflection of the device within the visible spectrum range (400 nm to 700 nm). It includes both diffuse and specular reflection.
Display reflectance profile
Display brightness uniformity
0.366
cd/m²
0.361
cd/m²
0.367
cd/m²
0.359
cd/m²
0.36
cd/m²
0.348
cd/m²
0.348
cd/m²
0.312
cd/m²
0.312
cd/m²
 Distribution of brightness (min)
497
cd/m²
486.3
cd/m²
489.5
cd/m²
490.1
cd/m²
481.3
cd/m²
472.9
cd/m²
450.5
cd/m²
432.7
cd/m²
430.3
cd/m²
Distribution of brightness (max)
This illustration shows the brightness measured on nine zones of the display for minimum brightness (left) and maximum brightness (right) for SDR content.
Display SDR EOTF measurement
This graph represents the rendering of contrast (gray levels) for SDR video content, measured in the dark. We expect to be close to the 2.2 or 2.4 gamma references.
Display peak brightness for video contents
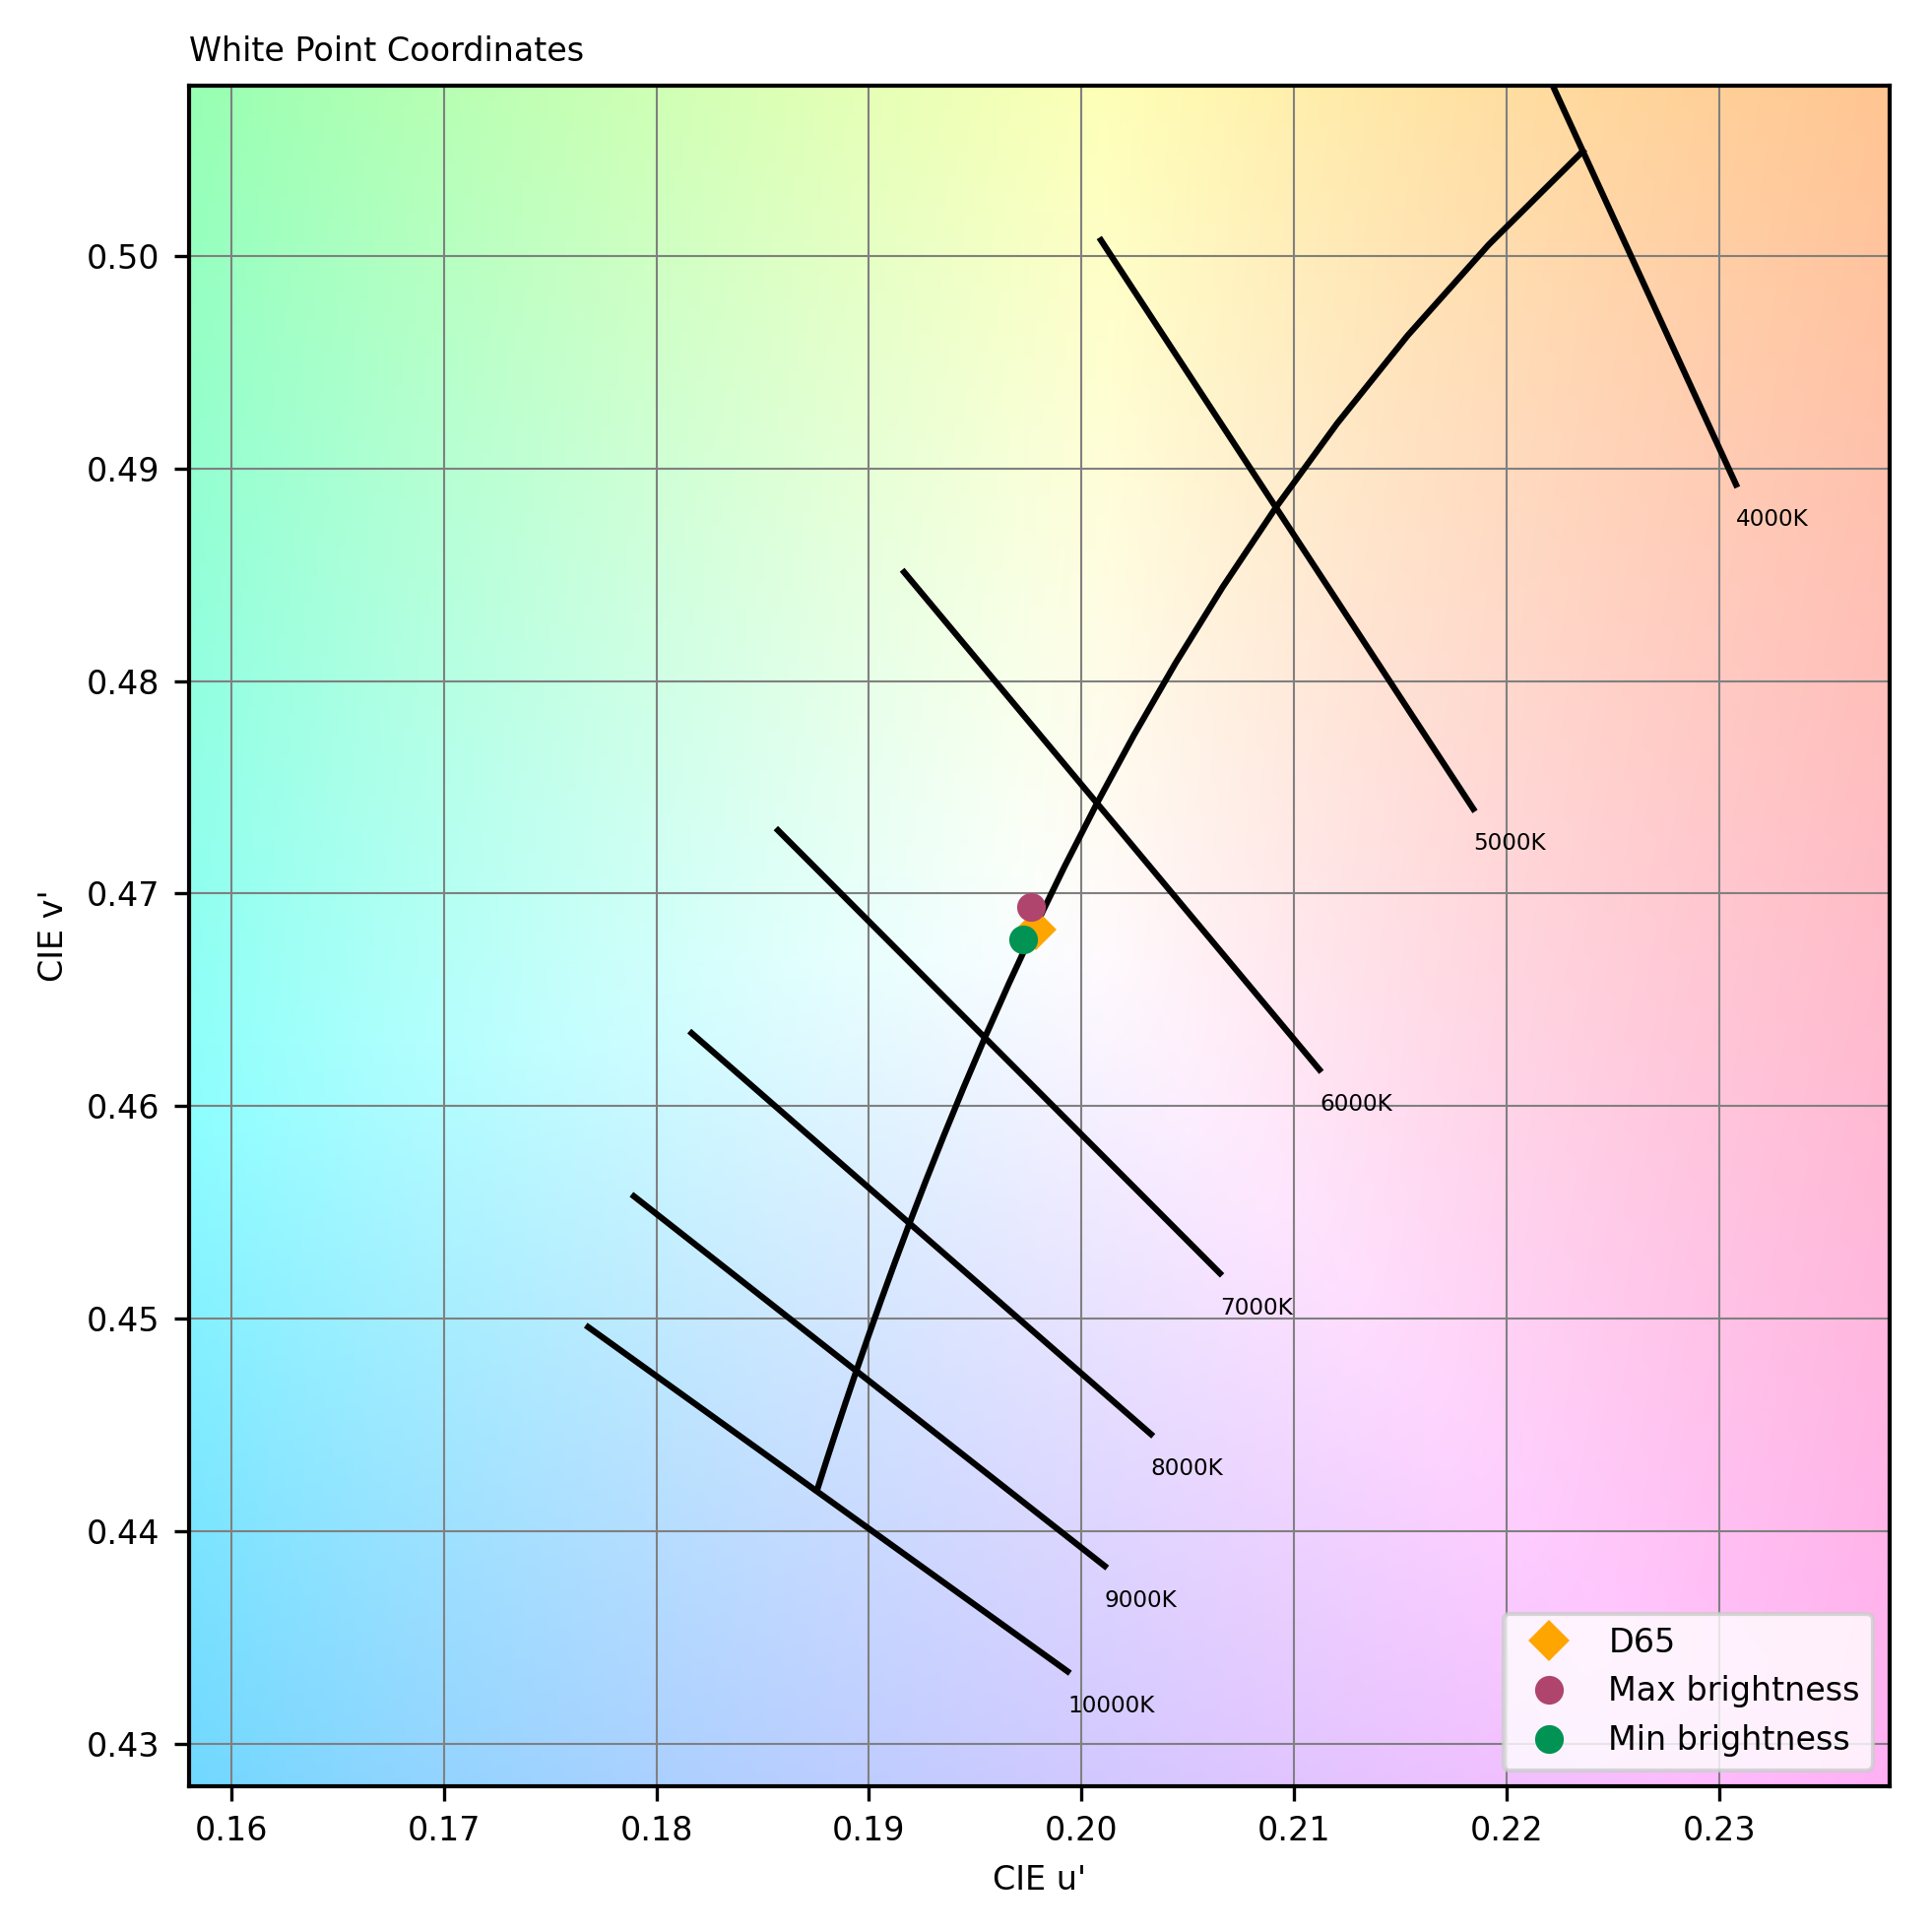
Display white point
This graph represents the color temperature of white content, compared with the reference (Daylight illuminant D65) measured in the dark on video at minimum and maximum brightness.
The following chart presents the playback for the multimedia use case:
Audio playback scores comparison
The following graphs show the frequency response, distortion and directivity in multimedia playback, recorded in our semi-anechoic room:
Audio playback frequency response
A 1/12 octave frequency response graph, which measures the volume of each frequency emitted by the laptop when playing a pure-sine wave in an anechoic environment.
Audio playback Total Harmonic Distortion + Noise