We put the Apple iPhone 14 through our rigorous DXOMARK Camera test suite to measure its performance in photo, video, and zoom quality from an end-user perspective. This article breaks down how the device fared in a variety of tests and several common use cases and is intended to highlight the most important results of our testing with an extract of the captured data.
Overview
Key camera specifications:
- Primary: 12MP 1/1.9-inch sensor, 24mm equivalent f/1.5-aperture lens, Dual PDAF, OIS
- Ultra-wide: 12MP sensor, 24mm equivalent f/2.4-aperture lens, PDAF
Scoring
Sub-scores and attributes included in the calculations of the global score.

Apple iPhone 14
Use cases & Conditions
Use case scores indicate the product performance in specific situations. They are not included in the overall score calculations.
Outdoor
Photos & videos shot in bright light conditions (≥1000 lux)
Indoor
Photos & videos shot in good lighting conditions (≥100lux)
Lowlight
Photos & videos shot in low lighting conditions (<100 lux)
Friends & Family
Portrait and group photo & videos
Pros
- Good exposure and nice color
- Fast and accurate autofocus
- Realistic bokeh effect in portrait mode
- Preview image close to capture
- Good video exposure and fairly wide dynamic range
- Very effective video stabilization, even with intense camera motion
- Good texture/noise trade-off in video
- Smooth video autofocus with fast convergence
Cons
- Luminance noise in low light, especially in areas of plain color
- Highlight clipping in strongly backlit scenes
- Artifacts, including ghosting, ringing and hue shift
- No macro mode
- Orange white balance casts in low-light video
- Occasional video exposure instabilities and slow exposure adaptation
- Lens flare, ringing, and color quantization in video, especially in low light
- Noise on moving elements in the scene in low light video
Just like the flagships iPhone 14 Pro and 14 Pro Max, the iPhone 14 proved to be an extremely reliable camera in our testing, producing repeatable image and video results in all conditions. It particularly shined in video, thanks to high levels of detail, as well as excellent autofocus tracking. The camera lagged slightly behind the Pro version in terms of zoom performance, though. This was mainly due to the lack of a dedicated lens and a smaller maximum aperture on the ultra-wide module. With only a 5x digital zoom, overall zoom capabilities are quite limited, especially at medium and long range.
Test summary
About DXOMARK Camera tests: DXOMARK’s Camera evaluations take place in laboratories and in real-world situations using a wide variety of subjects. The scores rely on objective tests for which the results are calculated directly by measurement software on our laboratory setups, and on perceptual tests in which a sophisticated set of metrics allow a panel of image experts to compare aspects of image quality that require human judgment. Testing a smartphone involves a team of engineers and technicians for about a week. Photo, Zoom, and Video quality are scored separately and then combined into an Overall score for comparison among the cameras in different devices. For more information about the DXOMARK Camera protocol, click here. More details on smartphone camera scores are available here. The following section gathers key elements of DXOMARK’s exhaustive tests and analyses. Full performance evaluations are available upon request. Please contact us on how to receive a full report.
Photo
Apple iPhone 14
169
For scoring and analysis, DXOMARK engineers capture and evaluate more than 2,600 test images both in controlled lab environments and in outdoor, indoor and low-light natural scenes, using the camera’s default settings. The photo protocol is designed to take into account the main use cases and is based on typical shooting scenarios, such as portraits, family, and landscape photography. The evaluation is performed by visually inspecting images against a reference of natural scenes, and by running objective measurements on images of charts captured in the lab under different lighting conditions from 1 to 1,000+ lux and color temperatures from 2,300K to 6,500K.
In terms of still image quality, the iPhone 14 was overall quite close to last year’s 13 Pro and 13 Pro Max, but with improved skin tones in difficult light conditions. This said, image noise was slightly more intrusive on the iPhone 14 base model than on both last year’s 13 Pro models and the latest iPhone 14 Pro.

Exposure
Apple iPhone 14
130

Color
Apple iPhone 14
130
Exposure and color are the key attributes for technically good pictures. For exposure, the main attribute evaluated is the brightness of the main subject through various use cases such as landscape, portrait, or still life. Other factors evaluated are the contrast and the dynamic range, eg. the ability to render visible details in both bright and dark areas of the image. Repeatability is also important because it demonstrates the camera's ability to provide the same rendering when shooting several images of the same scene.
For color, the image quality attributes analyzed are skin-tone rendering, white balance, color shading, and repeatability. For color and skin tone rendering, we penalize unnatural colors but we respect a manufacturer's choice of color signature.


Autofocus
Apple iPhone 14
125

Texture
Apple iPhone 14
125
Texture tests analyze the level of details and the texture of subjects in the images taken in the lab as well as in real-life scenarios. For natural shots, particular attention is paid to the level of details in the bright and dark areas of the image. Objective measurements are performed on chart images taken in various lighting conditions from 1 to 1000 lux and different kinds of dynamic range conditions. The charts used are the proprietary DXOMARK chart (DMC) and the Dead Leaves chart.

Noise
Apple iPhone 14
117
Noise tests analyze various attributes of noise such as intensity, chromaticity, grain, structure on real-life images as well as images of charts taken in the lab. For natural images, particular attention is paid to the noise on faces, landscapes, but also on dark areas and high dynamic range conditions. Noise on moving objects is also evaluated on natural images. Objective measurements are performed on images of charts taken in various conditions from 1 to 1000 lux and different kinds of dynamic range conditions. The chart used is the Dead Leaves chart and the standardized measurement such as Visual Noise derived from ISO 15739.


Artifacts
Apple iPhone 14
82
The artifacts evaluation looks at lens shading, chromatic aberrations, geometrical distortion, edges ringing, halos, ghosting, quantization, unexpected color hue shifts, among others type of possible unnatural effects on photos. The more severe and the more frequent the artifact, the higher the point deduction on the score. The main artifacts observed and corresponding point loss are listed below.
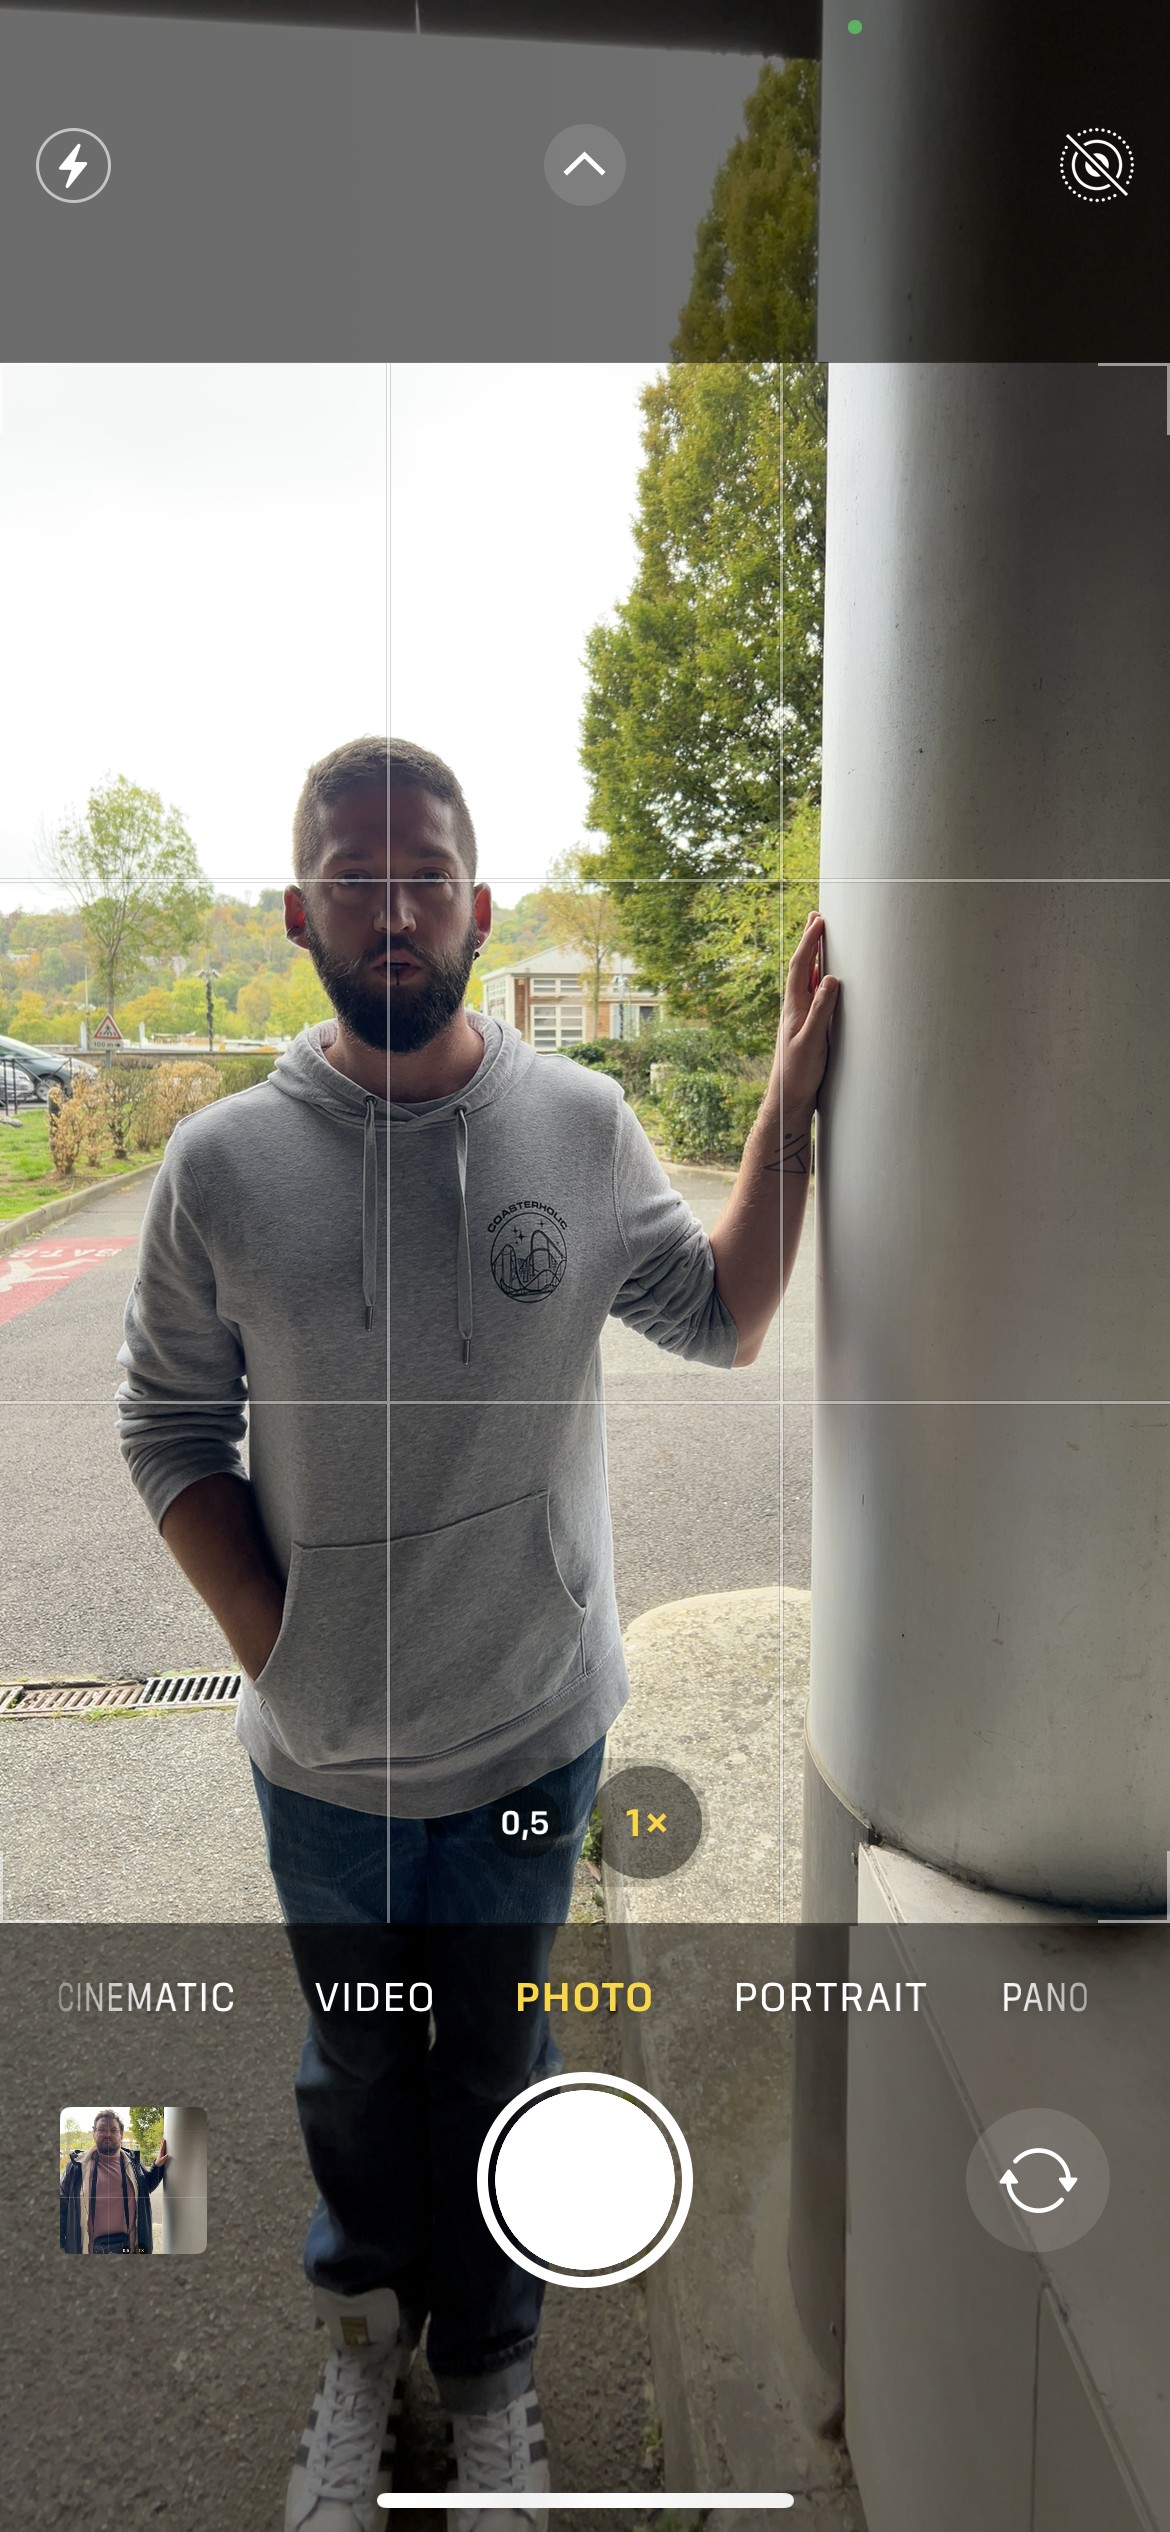
Preview
Apple iPhone 14
93
Preview tests analyze the image quality of the camera app's preview of the image, with particular attention paid to the difference between the capture and the preview, especially regarding dynamic range and the application of the bokeh effect. Also evaluated is the smoothness of the exposure, color and focus adaptation when zooming from the minimal to the maximal zoom factor available. The preview frame rate is measured using the LED Universal Timer.

Zoom
Apple iPhone 14
169
DXOMARK engineers capture and evaluate over 400 test images in controlled lab environments and in outdoor, indoor, and low-light natural scenes, using the camera’s default settings and pinch zoom at various zoom factors from ultra wide to very long-range zoom. The evaluation is performed by visually inspecting the images against a reference of natural scenes, and by running objective measurements of chart mages captured in the lab under different conditions from 20 to 1000 lux and color temperatures from 2300K to 6500K.
For a device without a dedicated tele lens, the iPhone 14 offered pretty decent image quality across the entire zoom range. The ultra-wide results were similar to the older iPhone 13 images. The 13mm lens offered a wide field of view and good quality images but slightly less detail and more noise than on the 14 Pro. When using the tele zoom, at close and medium range, images showed significant improvements over the iPhone 13.

Wide
Apple iPhone 14
122
These tests analyze the performance of the ultra-wide camera at several focal lengths from 12 mm to 20 mm. All image quality attributes are evaluated, with particular attention paid to such artifacts as chromatic aberrations, lens softness, and distortion. Pictures below are an extract of tested scenes.


Tele
Apple iPhone 14
128
All image quality attributes are evaluated at focal lengths from approximately 40 mm to 300 mm, with particular attention paid to texture and detail. The score is derived from a number of objective measurements in the lab and perceptual analysis of real-life images.
Video
Apple iPhone 14
159
DXOMARK engineers capture and evaluate more than 2.5 hours of video in controlled lab environments and in natural low-light, indoor and outdoor scenes, using the camera’s default settings. The evaluation consists of visually inspecting natural videos taken in various conditions and running objective measurements on videos of charts recorded in the lab under different conditions from 1 to 1000+ lux and color temperatures from 2,300K to 6,500K.
Video tests on the iPhone 14 were performed at 4K resolution and 30 frames per second, with Dolby Vision activated. The camera offered overall excellent video quality and showed improvements over the 13 Pro and Pro Max in most video test attributes, taking it quite close to the latest flagships iPhone 14 and 14 Pro Max.
Please note: YouTube only displays the original HDR rendering if videos are watched on a compatible HDR screen. Otherwise, a compressed SDR video is displayed.
Exposure
Apple iPhone 14
116
Color
Apple iPhone 14
120
Exposure tests evaluate the brightness of the main subject and the dynamic range, eg. the ability to render visible details in both bright and dark areas of the image. Stability and temporal adaption of the exposure are also analyzed.
Image-quality color analysis looks at color rendering, skin-tone rendering, white balance, color shading, stability of the white balance and its adaption when light is changing.
Texture
Apple iPhone 14
118
Texture tests analyze the level of details and texture of the real-life videos as well as the videos of charts recorded in the lab. Natural videos recordings are visually evaluated, with particular attention paid to the level of details in the bright and areas as well as in the dark. Objective measurements are performed of images of charts taken in various conditions from 1 to 1000 lux. The charts used are the DXOMARK chart (DMC) and Dead Leaves chart.
Noise
Apple iPhone 14
120
Noise tests analyze various attributes of noise such as intensity, chromaticity, grain, structure, temporal aspects on real-life video recording as well as videos of charts taken in the lab. Natural videos are visually evaluated, with particular attention paid to the noise in the dark areas and high dynamic range conditions. Objective measurements are performed on the videos of charts recorded in various conditions from 1 to 1000 lux. The chart used is the DXOMARK visual noise chart.

Stabilization
Apple iPhone 14
119
Stabilization evaluation tests the ability of the device to stabilize footage thanks to software or hardware technologies such as OIS, EIS, or any others means. The evaluation looks at residual motion, smoothness, jellow artifacts and residual motion blur on walk and run use cases in various lighting conditions. The video below is an extract from one of the tested scenes.
Artifacts
Apple iPhone 14
86
Artifacts are evaluated with MTF and ringing measurements on the SFR chart in the lab as well as frame-rate measurements using the LED Universal Timer. Natural videos are visually evaluated by paying particular attention to artifacts such as aliasing, quantization, blocking, and hue shift, among others. The more severe and the more frequent the artifact, the higher the point deduction from the score. The main artifacts and corresponding point loss are listed below.
DXOMARK encourages its readers to share comments on the articles. To read or post comments, Disqus cookies are required. Change your Cookies Preferences and read more about our Comment Policy.