We put the Google Pixel 7a through our rigorous DXOMARK Selfie test suite to measure its performance in photo and video from an end-user perspective. This article breaks down how the device fared in a variety of tests and several common use cases and is intended to highlight the most important results of our testing with an extract of the captured data.
Overview
Key front camera specifications:
- 13MP sensor, 1.12μm pixels
- f/2.2 aperture
- 94° field of view
- Fixed focus
- Video: 4K/30 fps, 1080p/30fps
Scoring
Sub-scores and attributes included in the calculations of the global score.
Google Pixel 7a
99
110
105
79
94
91
93
80

Pros
- Usually accurate white balance
- Accurate target exposure and wide dynamic range in most conditions
- Fairly accurate depth estimation in bokeh mode
Cons
- Slight loss of fine detail, especially in low light
- Coarse noise can be visible, especially in low light
- Strong vignetting in flash shots
- Faces sometimes slightly out of focus in close distance shots
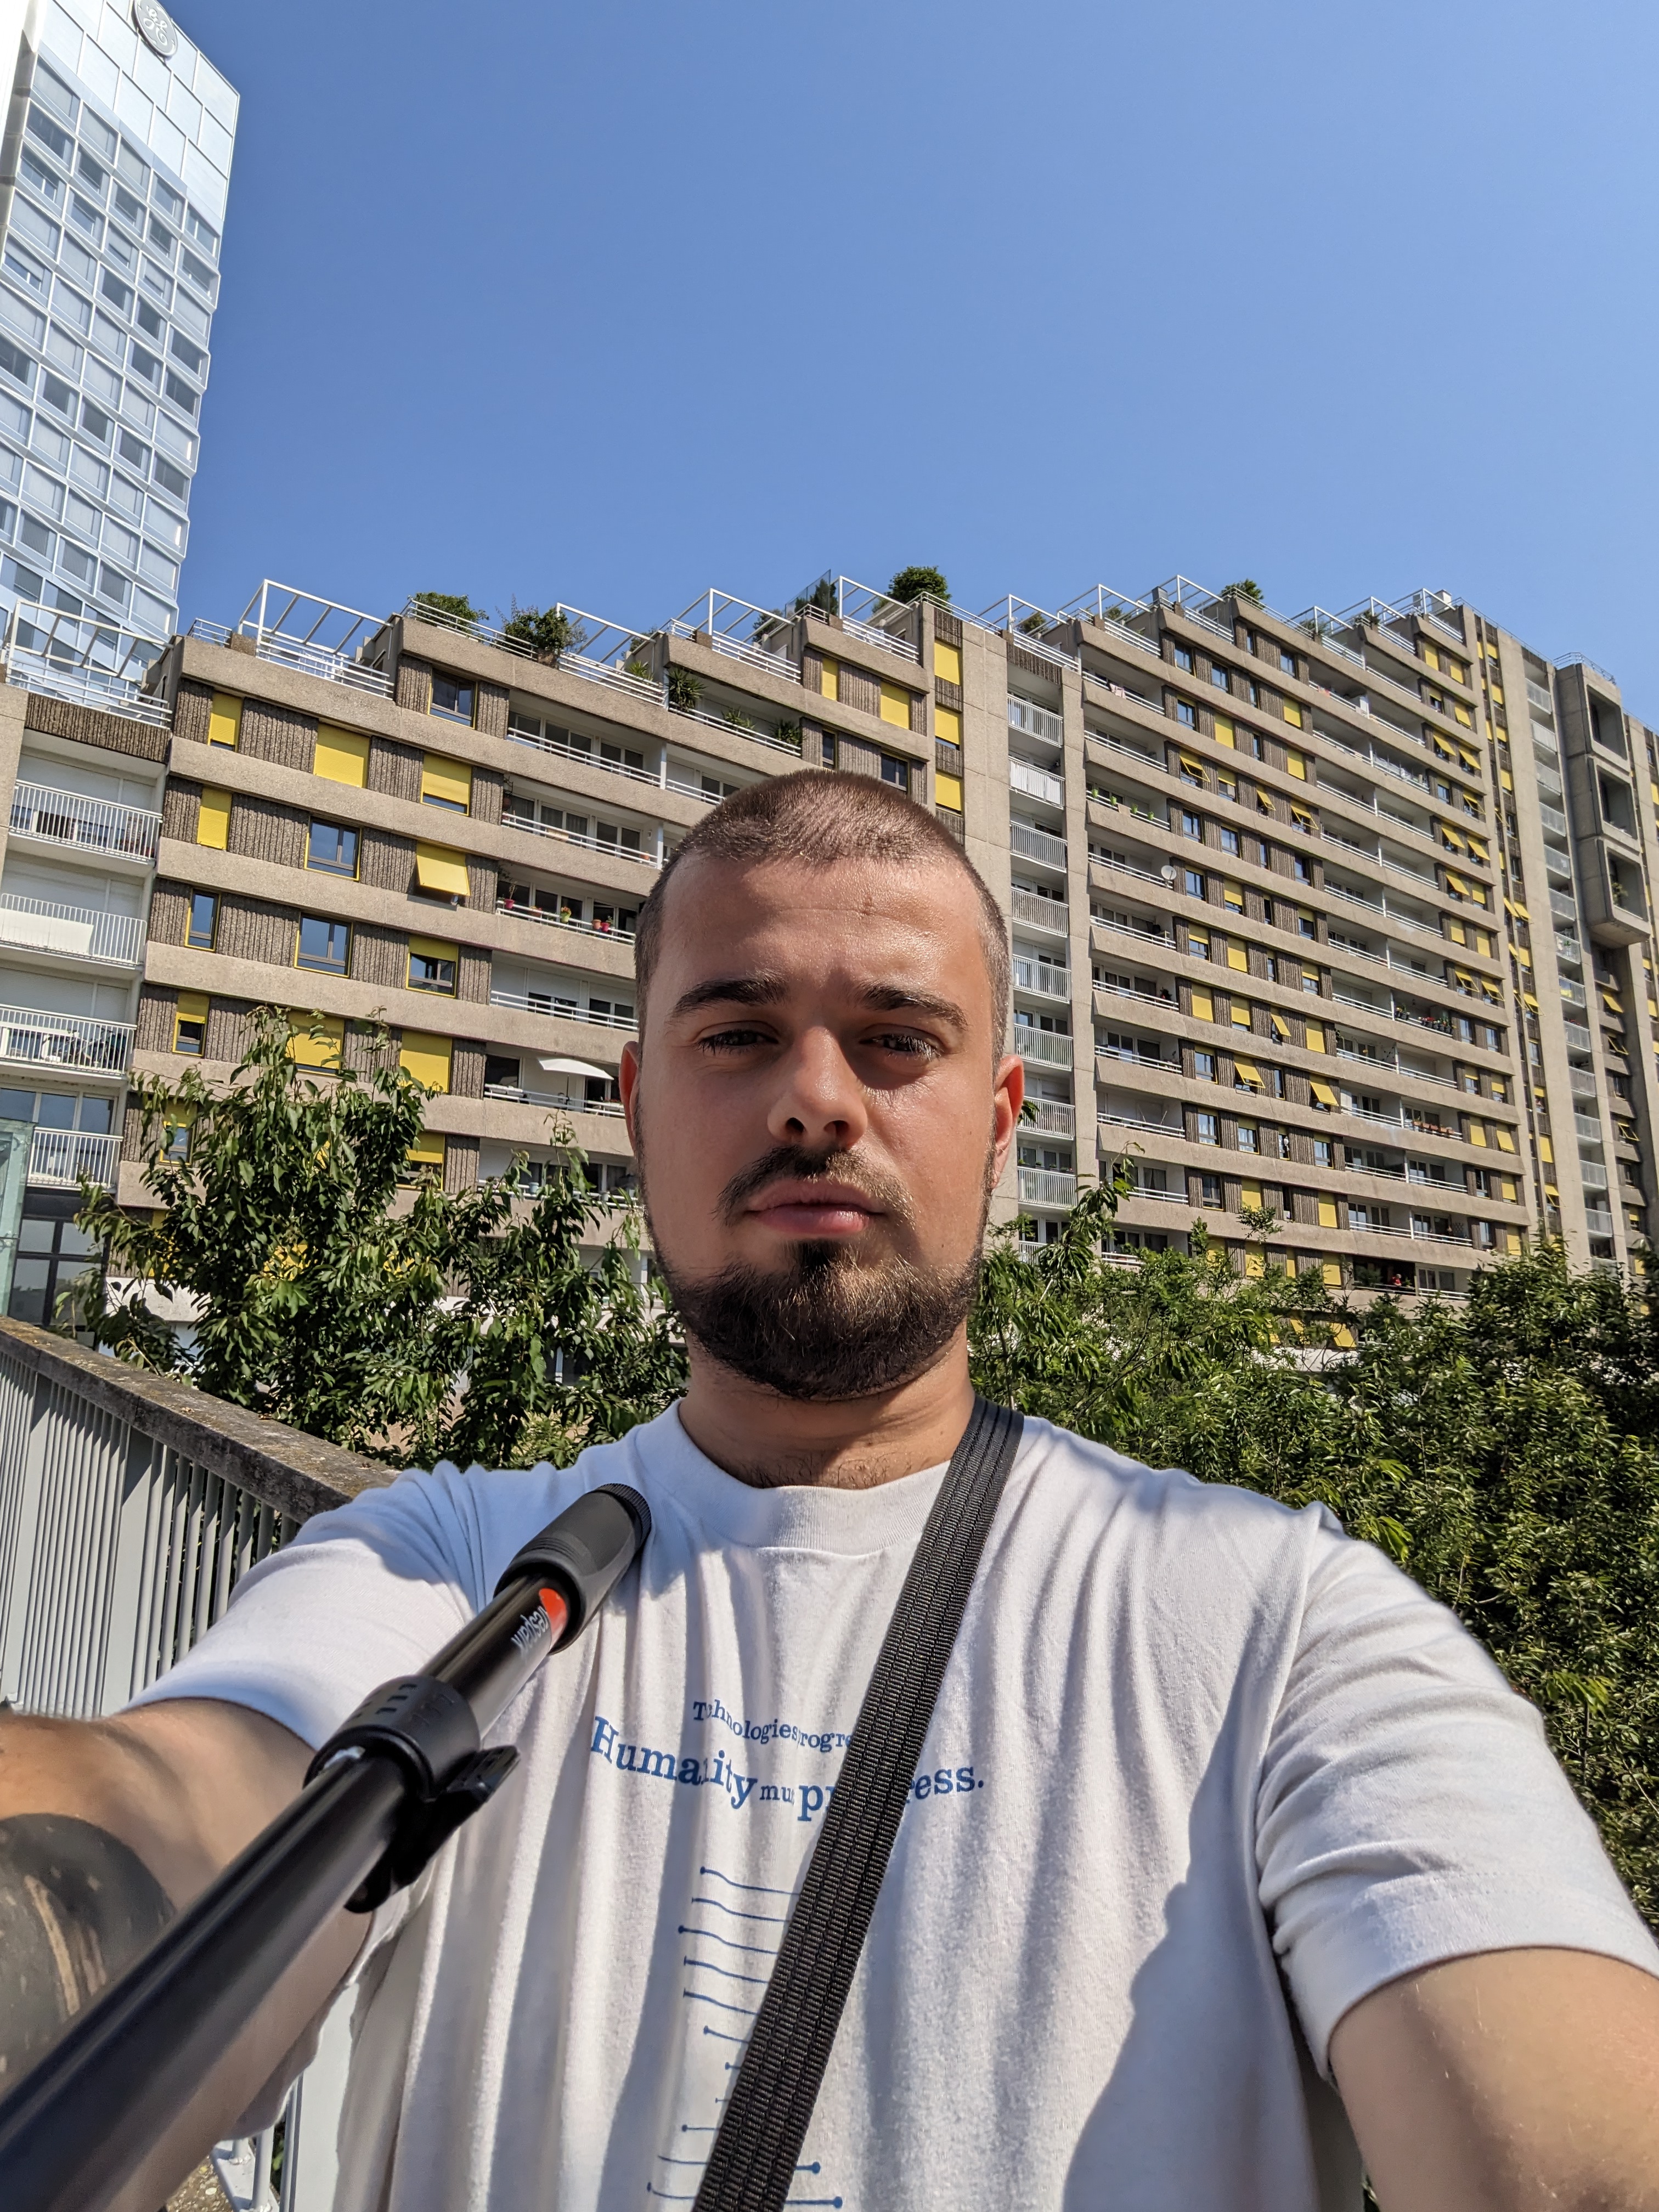
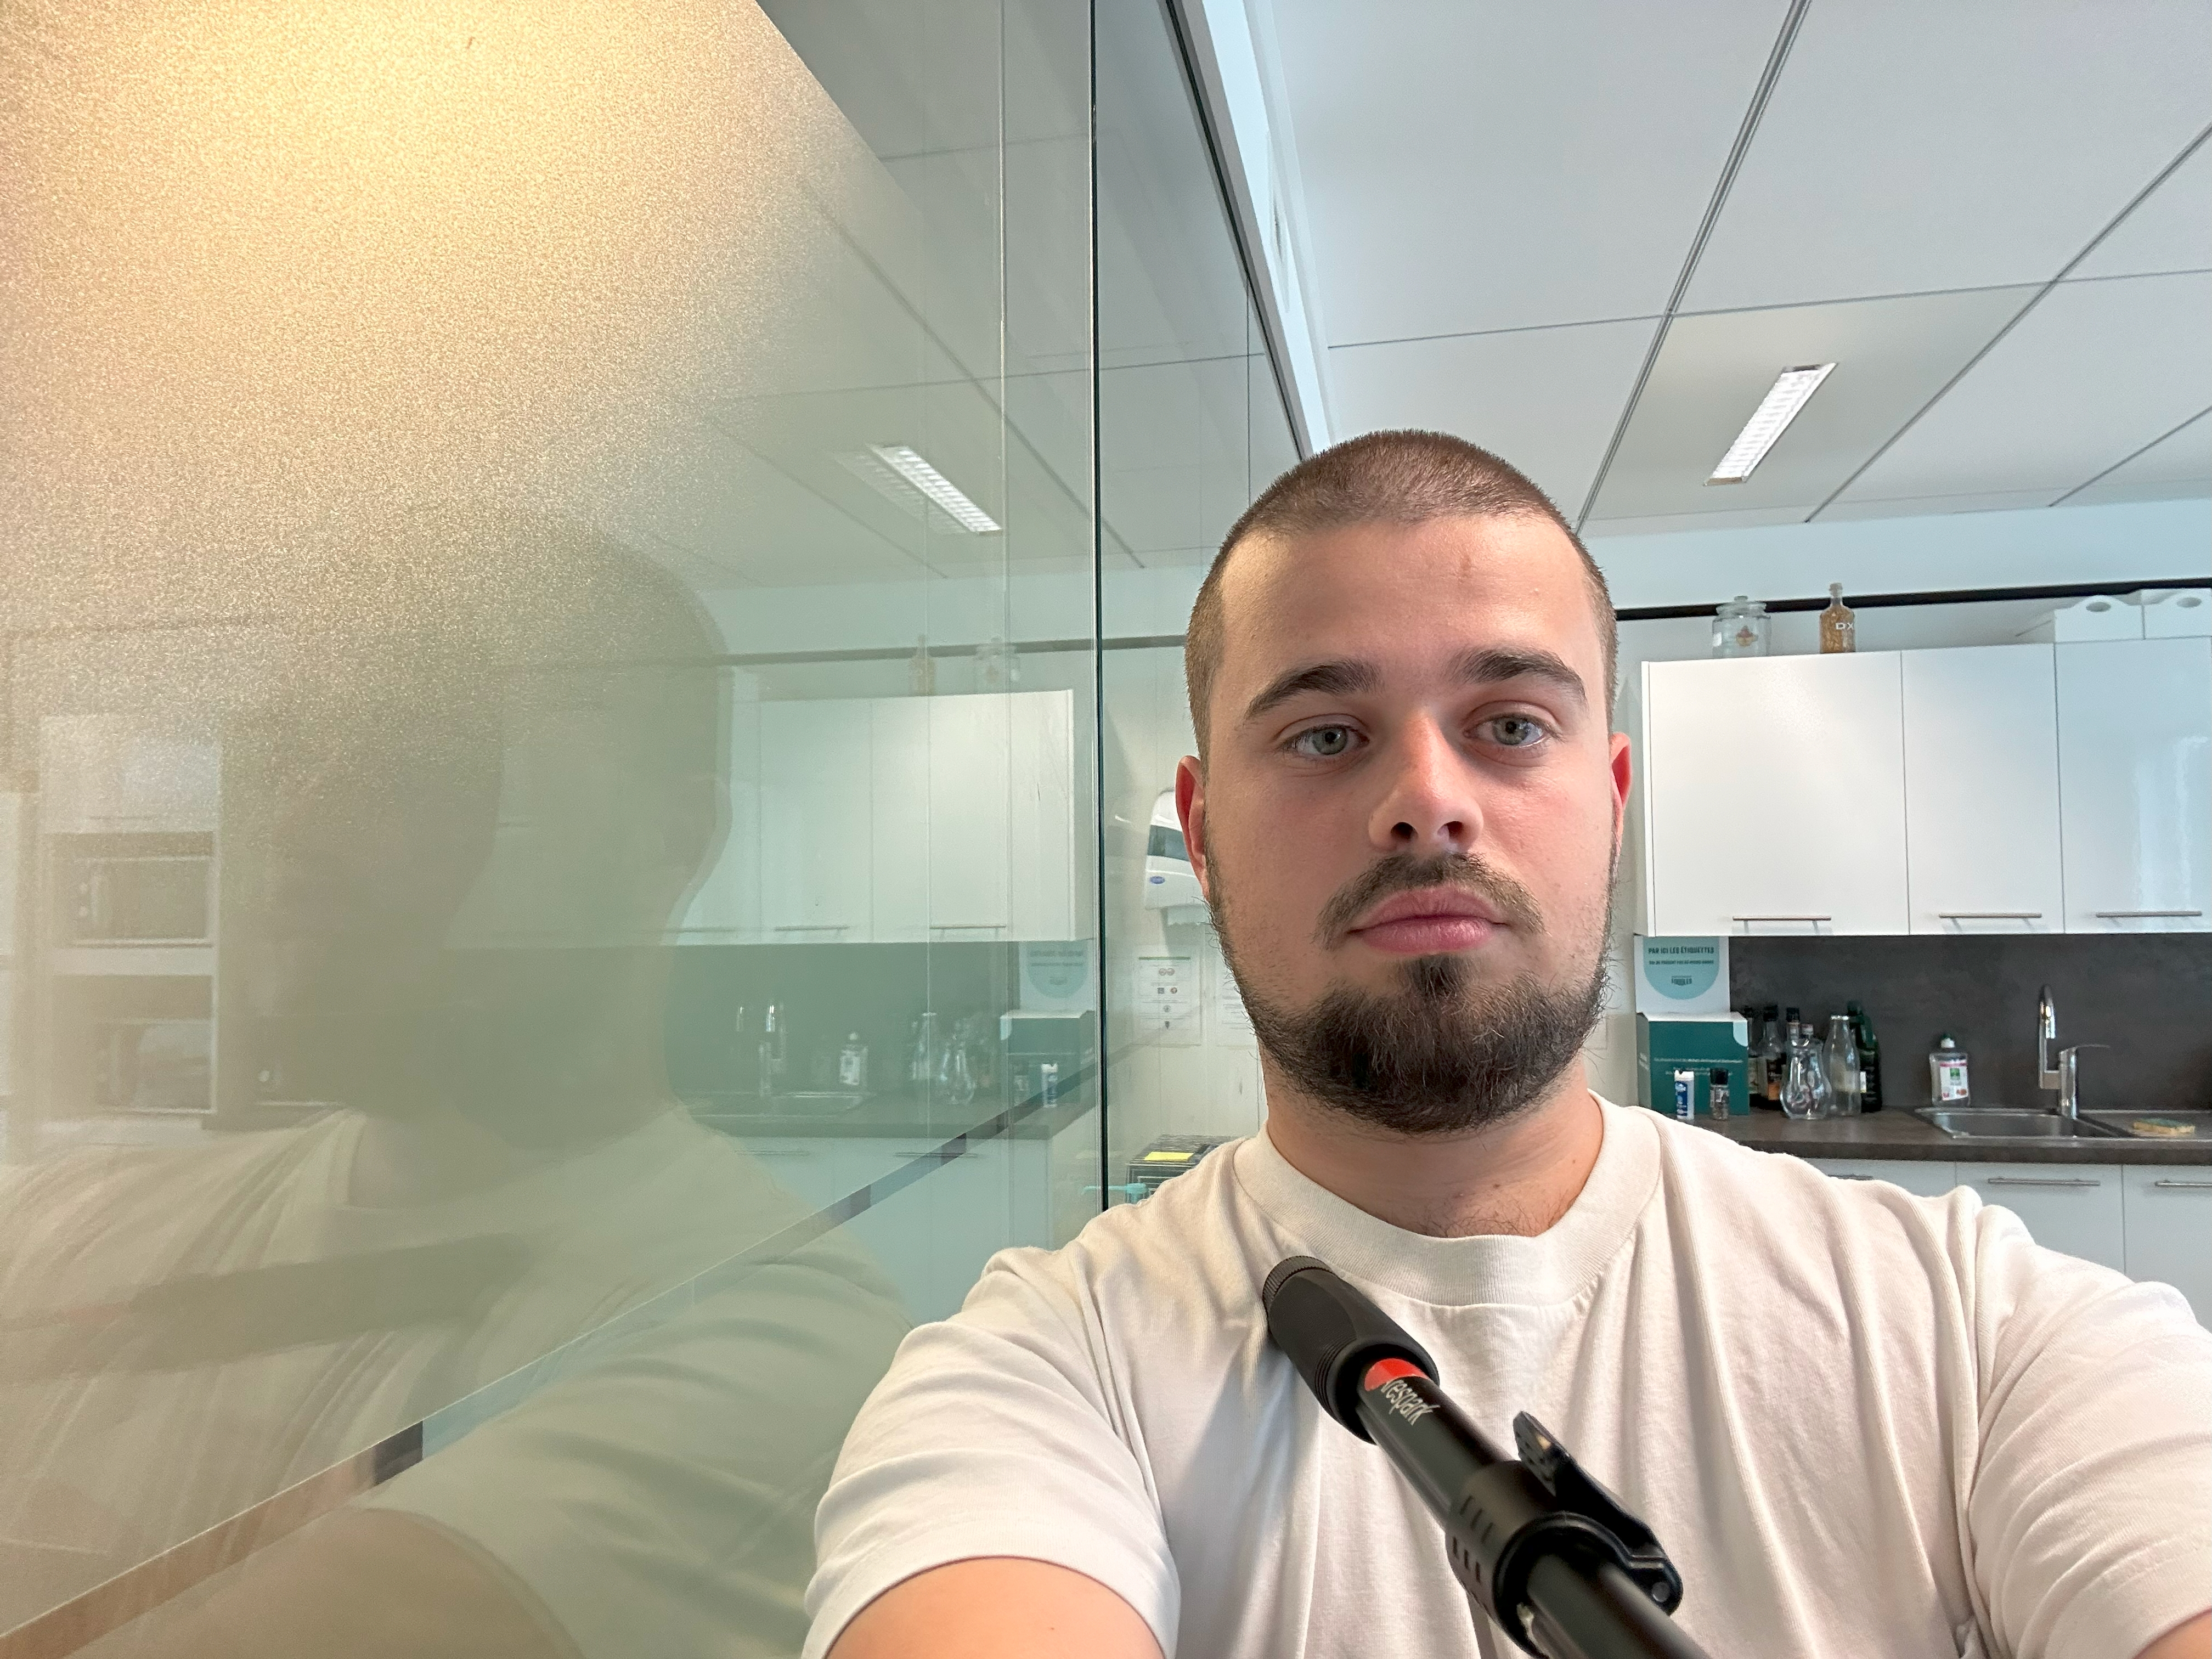
The Google Pixel 7a offered a very good performance in our DXOMARK front-camera test, with results close to the higher-tier Google Pixel 7. The good Photo score was based on the excellent exposure and vivid color rendering. Skin tones were rendered nicely across all skin types and light conditions. Our experts also liked the depth estimation in bokeh mode but noticed some noise and a loss of fine detail in low light.
The Pixel 7a also did very well in video mode, thanks to a wide dynamic range, as well as generally accurate white balance and skin tones. Video stabilization was excellent, too, effectively counteracting hand motion and stabilizing the subject’s face in the frame. On the downside, our testers noticed a lack of detail in low-light recordings, as well occasional high levels of video noise.
Test summary
About DXOMARK Selfie tests: For scoring and analysis, DXOMARK engineers capture and evaluate more than 1,500 test images both in controlled lab environments and in outdoor, indoor and low-light natural scenes, using the front camera’s default settings. The photo protocol is designed to take into account the user’s needs and is based on typical shooting scenarios, such as close-up and group selfies. The evaluation is performed by visually inspecting images against a reference of natural scenes, and by running objective measurements on images of charts captured in the lab under different lighting conditions from 1 to 1,000+ lux and color temperatures from 2,300K to 6,500K. For more information about the DXOMARK Selfie test protocol, click here. More details on how we score smartphone cameras are available here. The following section gathers key elements of DXOMARK’s exhaustive tests and analyses .Full performance evaluations are available upon request. Please contact us on how to receive a full report.
Photo
Google Pixel 7a
149

Exposure
Google Pixel 7a
99

Color
Google Pixel 7a
110
Exposure and color are the key attributes for technically good pictures. For exposure, the main attribute evaluated is the brightness of the face(s) in various use cases and light conditions. Other factors evaluated are the contrast and the dynamic range, eg. the ability to render visible details in both bright and dark areas of the image. Repeatability is also important because it demonstrates the camera's ability to provide the same rendering when shooting consecutive images in a row.
For color, the image quality attributes analyzed are skin-tone rendering, white balance, color shading, and repeatability.


Focus
Google Pixel 7a
105
Autofocus tests evaluate the accuracy of the focus on the subject’s face, the repeatability of an accurate focus, and the depth of field. While a shallow depth of field can be pleasant for a single-subject selfie or close-up shot, it can be problematic in specific conditions such as group selfies; both situations are tested. Focus accuracy is also evaluated in all the real-life images taken, from 30cm to 150cm, and in low light to outdoor conditions.

Texture
Google Pixel 7a
79
Texture tests analyze the level of details and the texture of subjects in the images taken in the lab as well as in real-life scenarios. For natural shots, particular attention is paid to the level of details in facial features, such as the eyes. Objective measurements are performed on chart images taken in various lighting conditions from 1 to 1000 lux and different kinds of dynamic range conditions. The charts used are the proprietary DXOMARK chart (DMC) and the Dead Leaves chart.


Noise
Google Pixel 7a
94
Noise tests analyze various attributes of noise such as intensity, chromaticity, grain, and structure on real-life images as well as images of charts taken in the lab. For natural images, particular attention is paid to the noise on faces, but also on dark areas and high dynamic range conditions. Objective measurements are performed on images of charts taken in various conditions from 1 to 1000 lux and different kinds of dynamic range conditions. The chart used is the DXOMARK Dead Leaves chart and the standardized measurement such as Visual Noise derived from ISO 15739.

Artifacts
Google Pixel 7a
91
The artifacts evaluation looks at lens shading, chromatic aberrations, distortion measurement on the Dot chart and MTF, and ringing measurements on the SFR chart in the lab. Particular attention is paid to ghosting, quantization, halos, and hue shifts on the face among others. The more severe and the more frequent the artifact, the higher the point deduction on the score. The main artifacts observed and corresponding point loss are listed below.

Bokeh
Google Pixel 7a
80
Bokeh is tested in one dedicated mode, usually portrait or aperture mode, and analyzed by visually inspecting all the images captured in the lab and in natural conditions. The goal is to reproduce portrait photography comparable to one taken with a DSLR and a wide aperture. The main image quality attributes paid attention to are depth estimation, artifacts, blur gradient, and the shape of the bokeh blur spotlights. Portrait image quality attributes (exposure, color, texture) are also taken into account.

Video
Google Pixel 7a
156
DXOMARK engineers capture and evaluate more than 2 hours of video in controlled lab environments and in natural low-light, indoor and outdoor scenes, using the front camera’s default settings. The evaluation consists of visually inspecting natural videos taken in various conditions and running objective measurements on videos of charts recorded in the lab under different conditions from 1 to 1000+ lux and color temperatures from 2,300K to 6,500K.
Exposure
Google Pixel 7a
87
Color
Google Pixel 7a
90
Exposure tests evaluate the brightness of the face and the dynamic range, eg. the ability to render visible details in both bright and dark areas of the image. Stability and temporal adaption of the exposure are also analyzed. Image-quality color analysis looks at skin-tone rendering, white balance, color shading, stability of the white balance and its adaption when light is changing.
Texture
Google Pixel 7a
97
Texture tests analyze the level of details and texture of the real-life videos as well as the videos of charts recorded in the lab. Natural video recordings are visually evaluated, with particular attention paid to the level of detail on the facial features. Objective measurements are performed of images of charts taken in various conditions from 1 to 1000 lux. The chart used is the Dead Leaves chart.
Noise
Google Pixel 7a
83
Noise tests analyze various attributes of noise such as intensity, chromaticity, grain, structure, temporal aspects on real-life video recording as well as videos of charts taken in the lab. Natural videos are visually evaluated, with particular attention paid to the noise on faces. Objective measurements are performed on the videos of charts recorded in various conditions from 1 to 1000 lux. The chart used is the DXOMARK visual noise chart.

Stabilization evaluation tests the ability of the device to stabilize footage thanks to software or hardware technologies such as OIS, EIS, or any others means. The evaluation looks at overall residual motion on the face and the background, smoothness and jellow artifacts, during walk and paning use cases in various lighting conditions. The video below is an extract from one of the tested scenes.
Artifacts
Google Pixel 7a
92
Artifacts are evaluated with MTF and ringing measurements on the SFR chart in the lab as well as frame-rate measurements using the LED Universal Timer. Natural videos are visually evaluated by paying particular attention to artifacts such as quantization, hue shift, and face-rendering artifacts among others. The more severe and the more frequent the artifact, the higher the point deduction from the score. The main artifacts and corresponding point loss are listed below
DXOMARK encourages its readers to share comments on the articles. To read or post comments, Disqus cookies are required. Change your Cookies Preferences and read more about our Comment Policy.