We put the HP Dragonfly Pro (2023) through our rigorous DXOMARK Laptop test suite to measure its performance both at sound, camera and display.
In this review, we will break down how it fared in a variety of tests and several common use cases.
Overview
Key specifications include (as given by the manufacturer):
- Physical specs : 12.39 x 8.78 x 0.72 in 3.42 lbs
- Display : 14”, 1920×1200, IPS, 400nits, 100% sRGB, Touch
- Audio : Quad Speakers, audio by Banf&Olufsen wide-range microphone array (1 front-facing individual, 1 world-facing conference mode)
- Webcam : 5 Mpx camera
Scoring
Use-case and feature subscores included in the calculations of the global score

HP Dragonfly Pro (2023)
84
95
84
Pros
- Accurate face exposure in simple scenes, keeping faces visible
- Intelligble voices through good noise reduction in capture, creating a good SNR, good midrange frequency response and sharp envelope
- Spatial was well handled, with wide stereo (even if it could be even wider) and easily localizable sound sources
Cons
- In video call, faces appear underexposed in challenging conditions,
- Lack of details in low-light conditions and limited dynamic range
- Limited depth of field in video calls, making objects and faces closer than 50 cm to the screen to be out of focus
- Low maximum brightness
- Higher reflectance level than other devices of its class
The HP Dragonfly’s overall performance was unimpressive. While its video call use case results were average, thanks to good audio performance in calls, its camera performance was poor.
Test summary
About DXOMARK Laptop tests: For scoring and analysis in our laptop reviews, DXOMARK engineers perform a variety of objective tests and undertake more than 20 hours of perceptual evaluations under controlled lab conditions and real-life scenarios.
(For more details about the Laptop protocol, click here.)
The following section gathers key elements of our exhaustive tests and analyses performed in DXOMARK laboratories. Detailed performance evaluations under the form of reports are available upon request. Do not hesitate to contact us.
Video Call
HP Dragonfly Pro (2023)
144
DXOMARK's Video call use case is a score that evaluates how a device handles video calls and videoconferencing in multiple conditions. This score focuses on the camera performance and the capture and playback rendering of voices. Read more about how we test the use cases of Video call score here.
The HP device’s camera handled face exposure well in unproblematic lighting conditions, but faces were underexposed in high dynamic range scenes such as backlighting. Detail was acceptable in well-lit scenes, but depth of field was limited, with objects and faces closer than 50 cm (~20 inches) out of focus. Limited dynamic range caused clipping of highlights and blocking of dark tones, and color rendering was inaccurate overall.
A good SNR, sharp envelope, and midrange frequency response meant that audio capture of voices was intelligible in most situations. Voice sources on the side were also nicely attenuated; however, some gating as well as some midrange distortion may impair the intelligibility of the main voice. The laptop also handled duplex situations nicely, but struggled to handle extraneous noises.
Camera
HP Dragonfly Pro (2023)
135
The following chart presents the camera subscores for the video call use case:
The following graphs show the objective measurements performed in our camera labs:
Audio
HP Dragonfly Pro (2023)
144
The following chart presents the capture subscores for the video call use case:
The following graphs show the frequency response, distortion and directivity in capture, recorded in our semi-anechoic room:
Music & Video
HP Dragonfly Pro (2023)
154
DXOMARK's Video and Music use case score evaluates the capability of a device to reproduce multimedia usages such as videos, movies and music playback in indoor conditions. This score focuses on the display performance and audio-playback rendering. Read more about how we test this use case here.
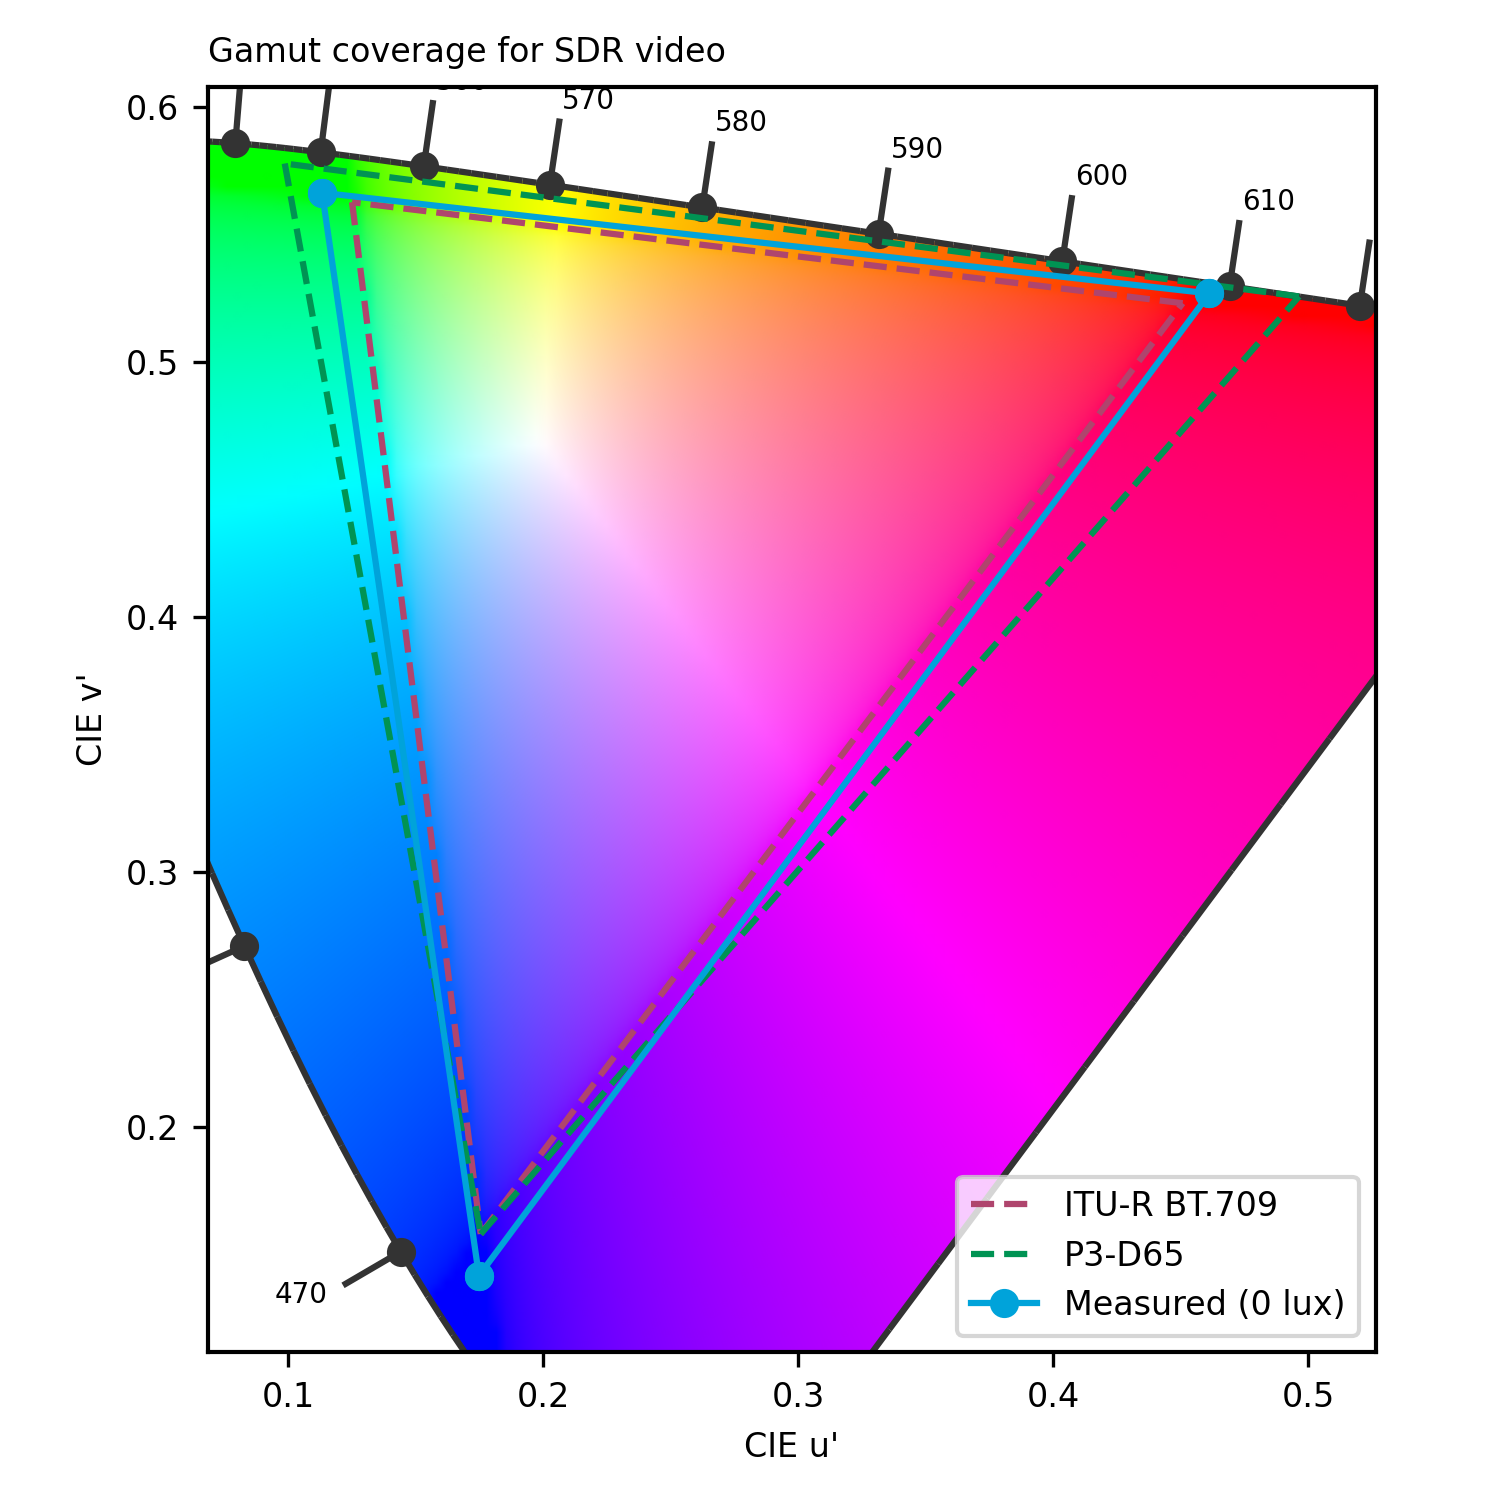
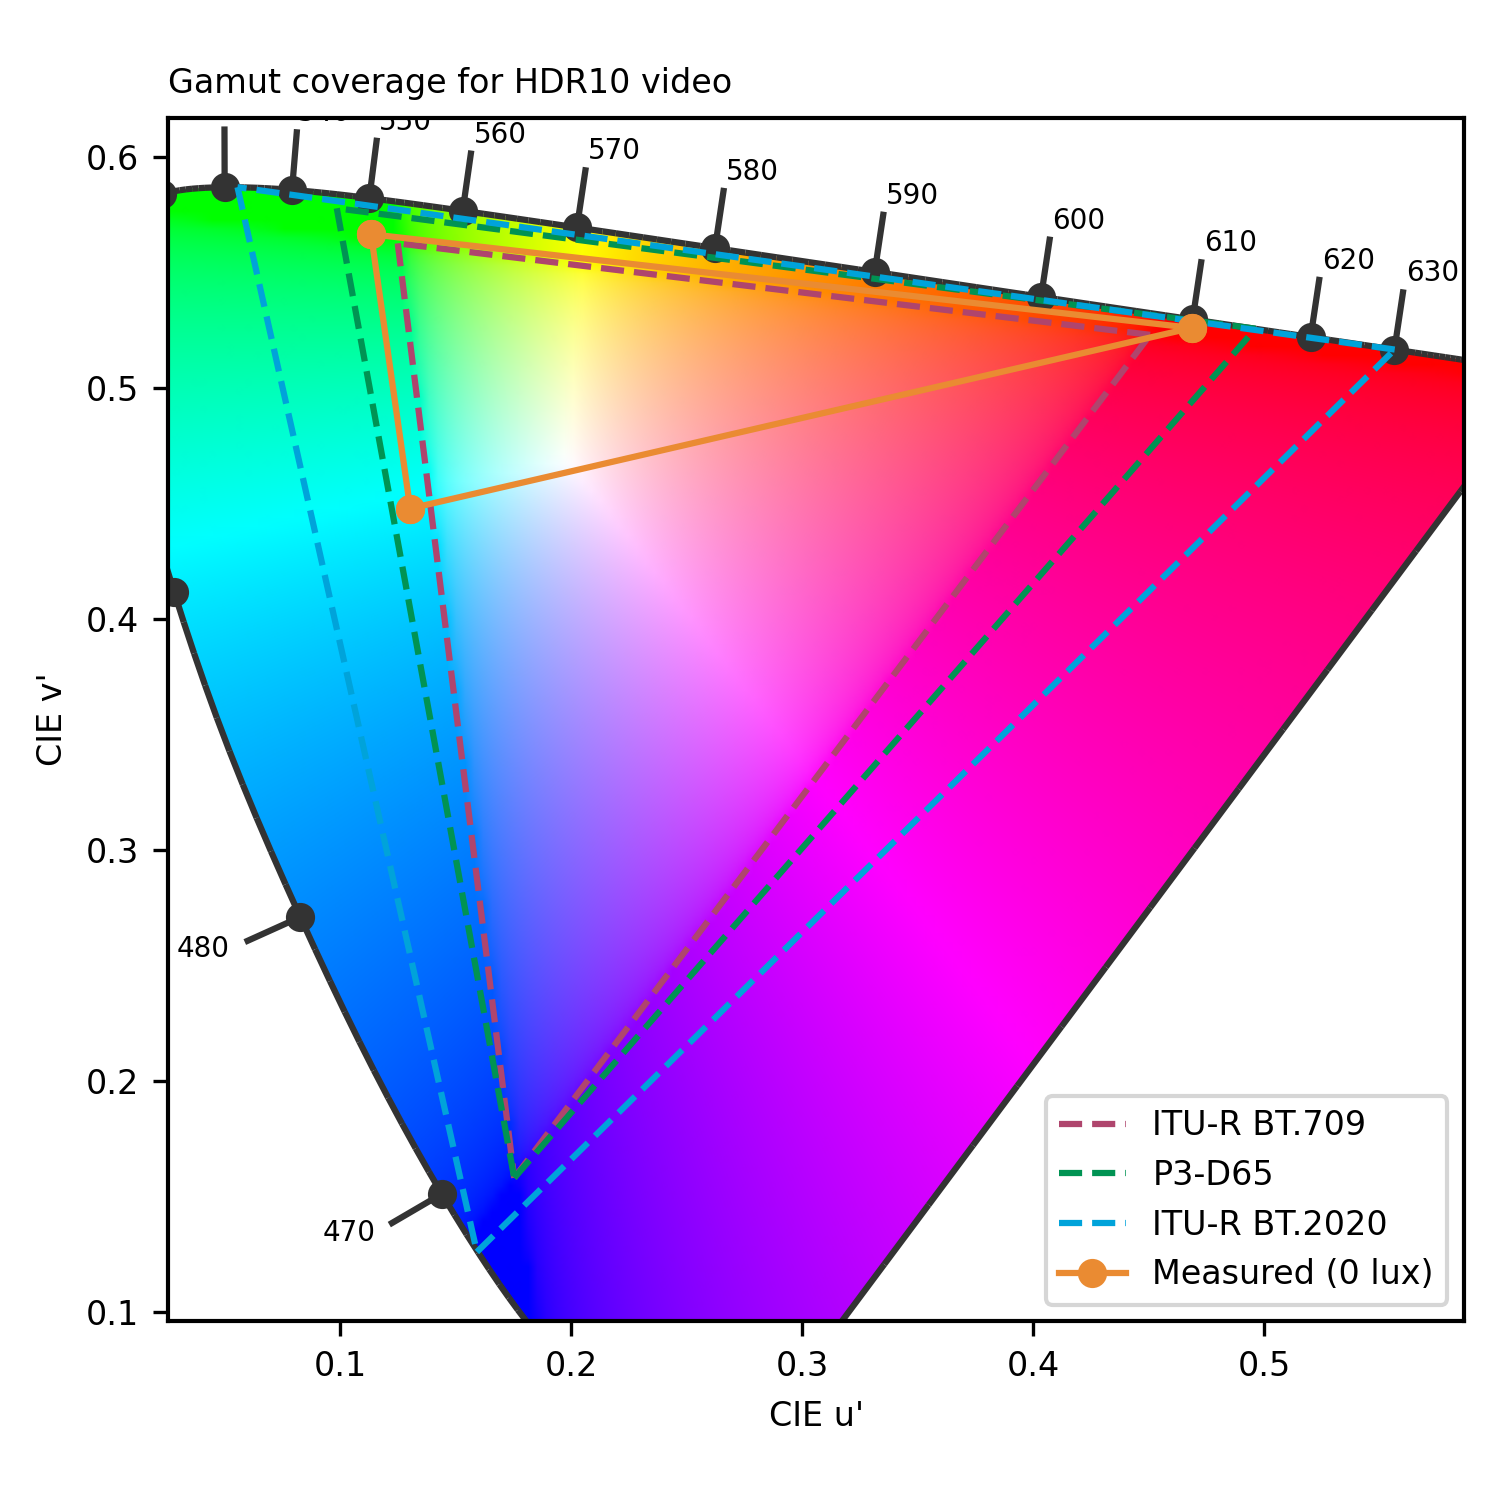
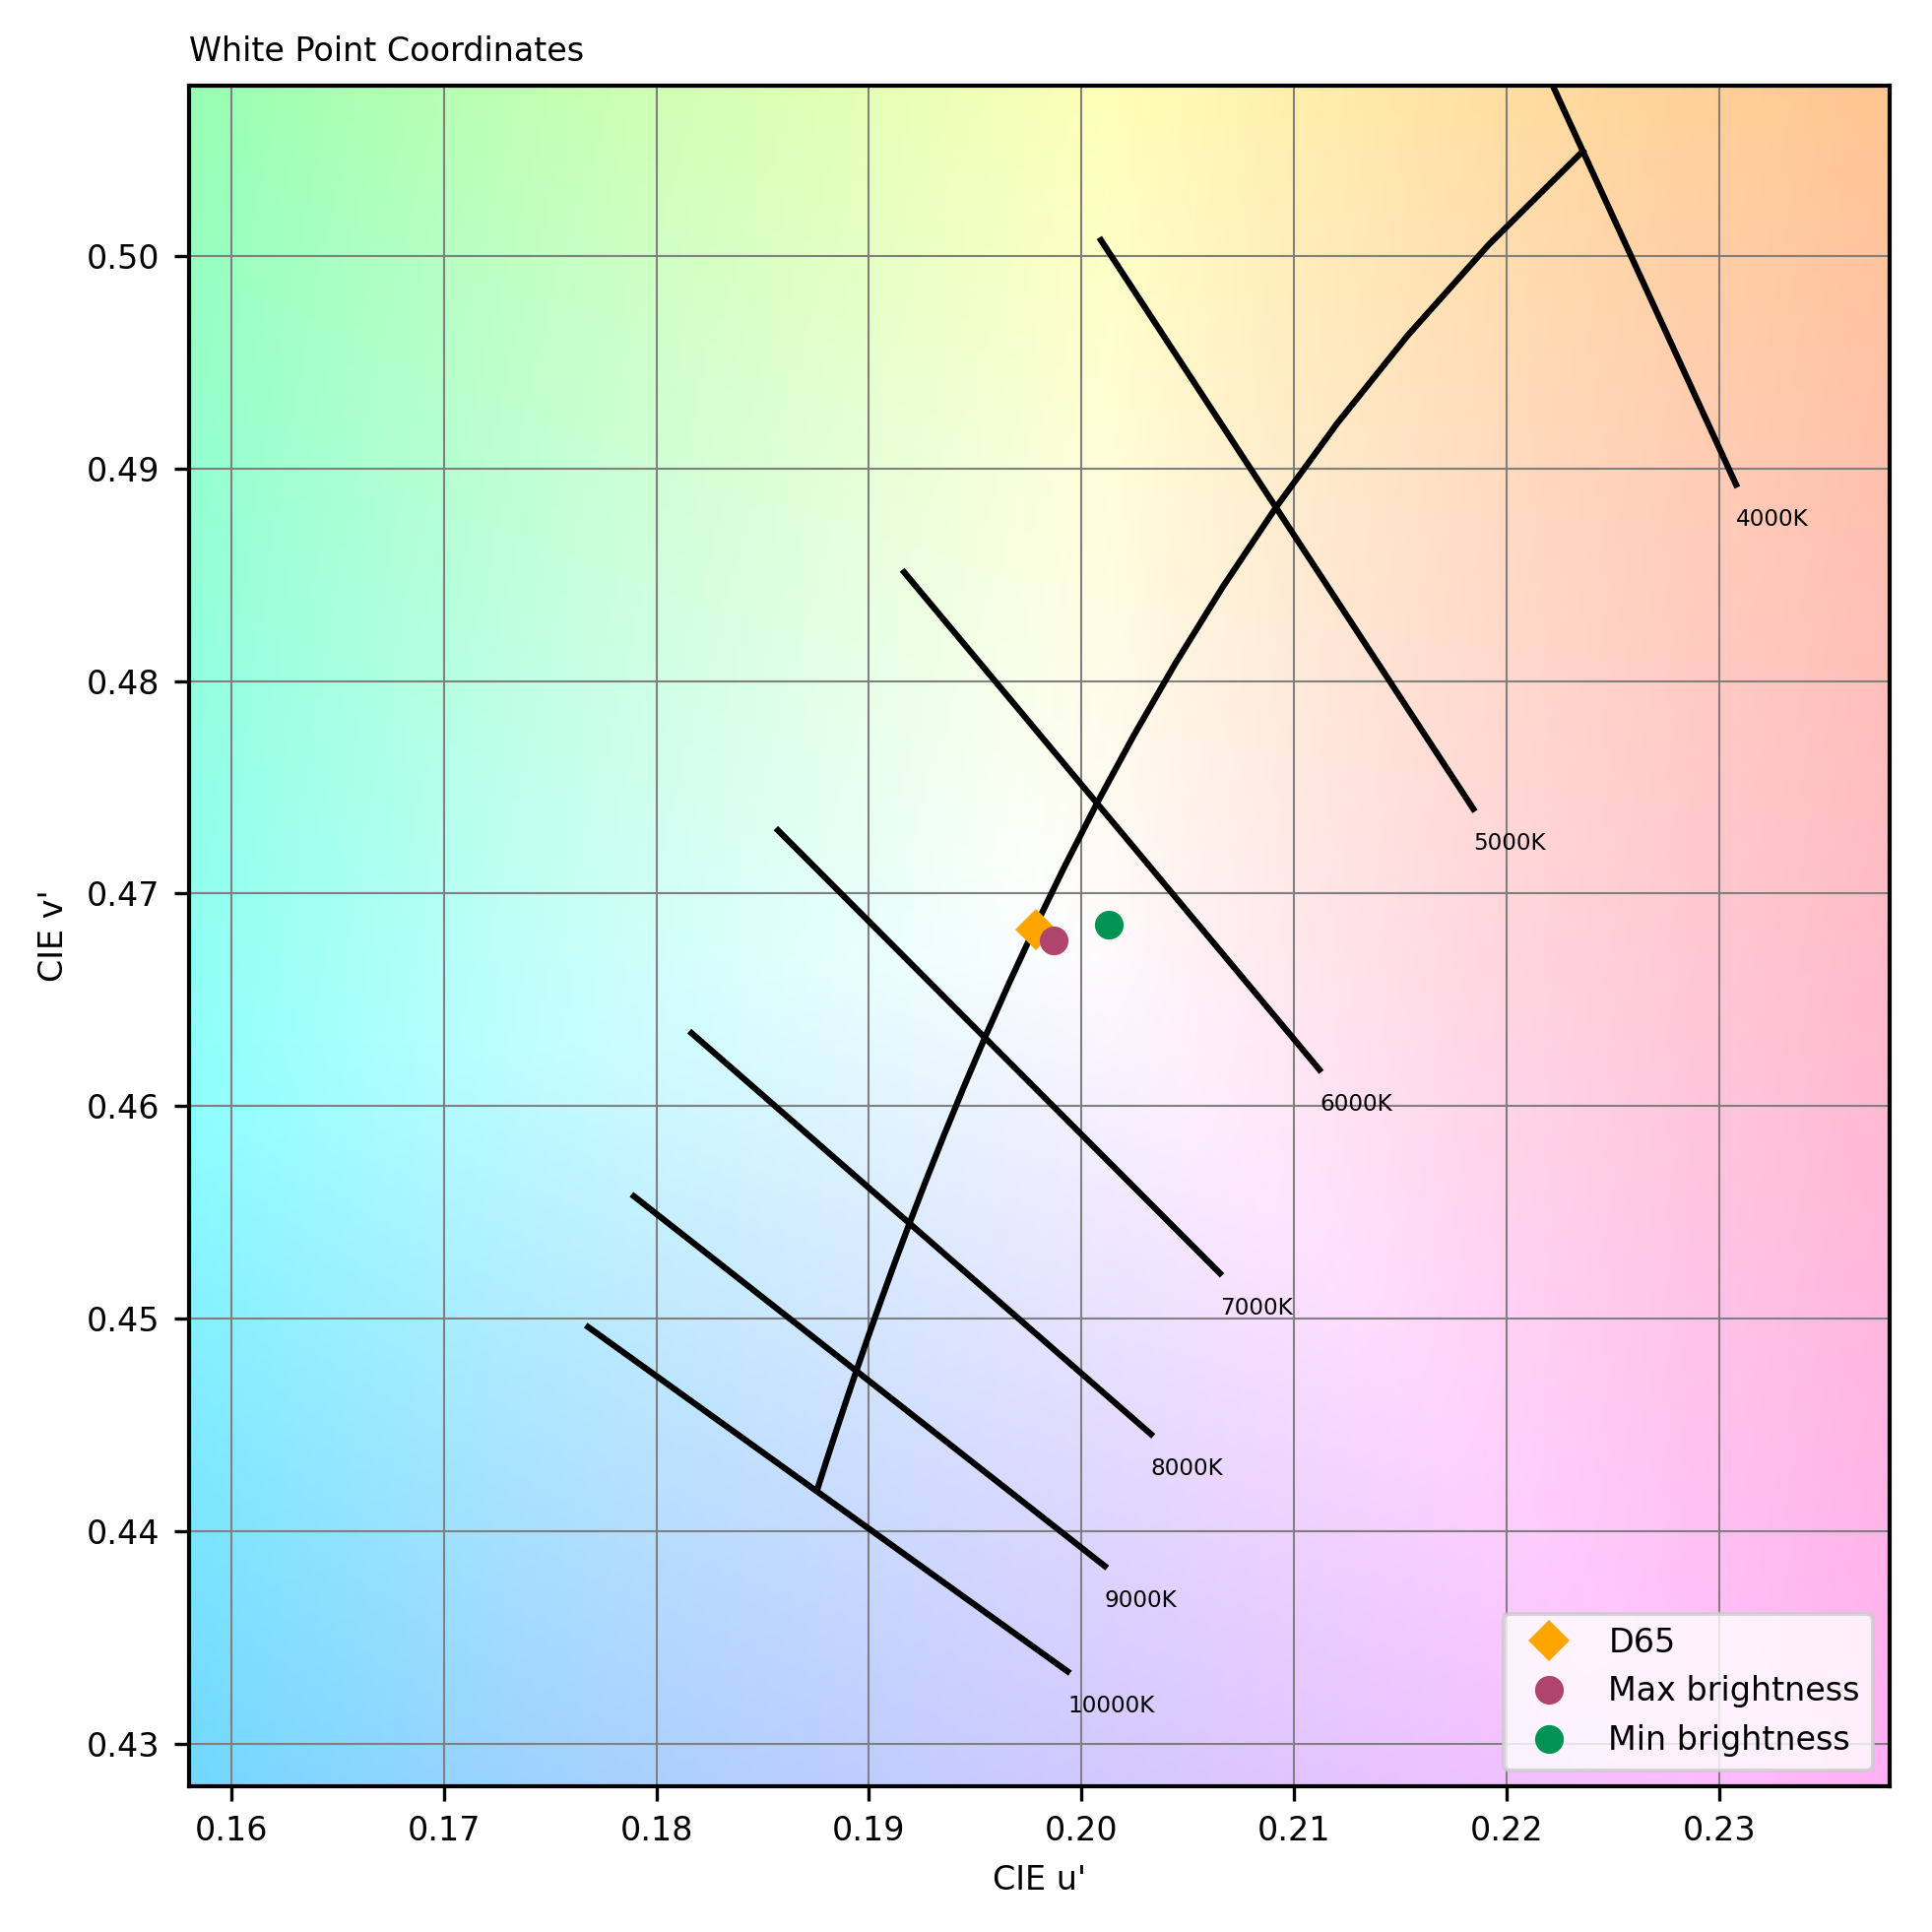
Display readability was subpar. While minimum brightness was acceptable at 10 nits, the maximum brightness, measured at 350 nits, was lower than advertised, and reflectance was higher than other laptops tested to date. SDR performance was good, however, with faithful color rendition and good color gamut.
Audio playback was decent, with wide stereo and good localization, but it lacked bass and high end extensions, rendering voice-focused content well, but adversely affecting music and movies. The lack of bass precision and punch also affected the overall dynamics. Further, there was excessive compression and pumping at loud volumes.
Display
HP Dragonfly Pro (2023)
156
The following chart presents the display subscores for the multimedia use case:
The following graphs show the objective measurements performed in our display lab:
cd/m²
cd/m²
cd/m²
cd/m²
cd/m²
cd/m²
cd/m²
cd/m²
cd/m²
 Distribution of brightness (min)
cd/m²
cd/m²
cd/m²
cd/m²
cd/m²
cd/m²
cd/m²
cd/m²
cd/m²
Distribution of brightness (max)
Audio
HP Dragonfly Pro (2023)
152
The following chart presents the playback for the multimedia use case:
The following graphs show the frequency response, distortion and directivity in multimedia playback, recorded in our semi-anechoic room:
DXOMARK encourages its readers to share comments on the articles. To read or post comments, Disqus cookies are required. Change your Cookies Preferences and read more about our Comment Policy.