We put the HP Spectre x360 (2023) through our rigorous DXOMARK Laptop test suite to measure its performance both at sound, camera and display.
In this review, we will break down how it fared in a variety of tests and several common use cases.
Overview
Key specifications include (as given by the manufacturer):
- Physical specs : 29,8 x 22,04 x 1,69 cm
- Display : 3000×2000, OLED, HDR 500nits, SDR 400nits, 100% DCI-P3
- Audio : Bang & Olufsen audio system, Quad speakers, HP Audio Boost
- Webcam : HP True Vision 5 MP
Scoring
Use-case and feature subscores included in the calculations of the global score

HP Spectre x360 (2023)
84
95
84
Pros
- In video call, well-controlled white balance, showing a high level of details in simple scenarios
- In video call, excellent SNR with a capture focused on the user’s voice
- Faithful colors when displaying HDR contents
- Good spatial performance with a wide and precise sound scene
Cons
- Instabilities in exposure in most tested scenarios, as well as under exposure in backlit scenes
- In challenging conditions, white balance can be unstable
- Limited depth of field, making user’s face out of focus if too close to the screen
- Limited audio duplex handling, impaired by gating
- Minimum brightness is too high at 23 nits, which can interfere with readability in low-light environments
HP’s Spectre x360 (2023) laptop put in an average overall performance, with a better experience in multimedia than in video conferencing. Display performance was above average, while camera performance was underwhelming and audio performance was in line with other similarly priced devices.
Test summary
About DXOMARK Laptop tests: For scoring and analysis in our laptop reviews, DXOMARK engineers perform a variety of objective tests and undertake more than 20 hours of perceptual evaluations under controlled lab conditions and real-life scenarios.
(For more details about the Laptop protocol, click here.)
The following section gathers key elements of our exhaustive tests and analyses performed in DXOMARK laboratories. Detailed performance evaluations under the form of reports are available upon request. Do not hesitate to contact us.
Video Call
HP Spectre x360 (2023)
144
DXOMARK's Video call use case is a score that evaluates how a device handles video calls and videoconferencing in multiple conditions. This score focuses on the camera performance and the capture and playback rendering of voices. Read more about how we test the use cases of Video call score here.
Except in very challenging situations, the Spectre’s camera controlled white balance well, and images showed a high level of detail. However, exposure was unstable in most tested scenarios. Significant underexposure in backlit scenes meant that faces were sometimes not visible, especially those with darker skin tones. Depth of field was limited, so users’ faces were out of focus when too close to the screen (≤50 cm/20 inches). Audio capture had excellent SNR and focused on the user’s voice, thanks to good directivity and good control of room acoustics. Gating impaired intelligibility when more than one person was talking.
Camera
HP Spectre x360 (2023)
135
The following chart presents the camera subscores for the video call use case:
The following graphs show the objective measurements performed in our camera labs:
Audio
HP Spectre x360 (2023)
144
The following chart presents the capture subscores for the video call use case:
The following graphs show the frequency response, distortion and directivity in capture, recorded in our semi-anechoic room:
Music & Video
HP Spectre x360 (2023)
154
DXOMARK's Video and Music use case score evaluates the capability of a device to reproduce multimedia usages such as videos, movies and music playback in indoor conditions. This score focuses on the display performance and audio-playback rendering. Read more about how we test this use case here.
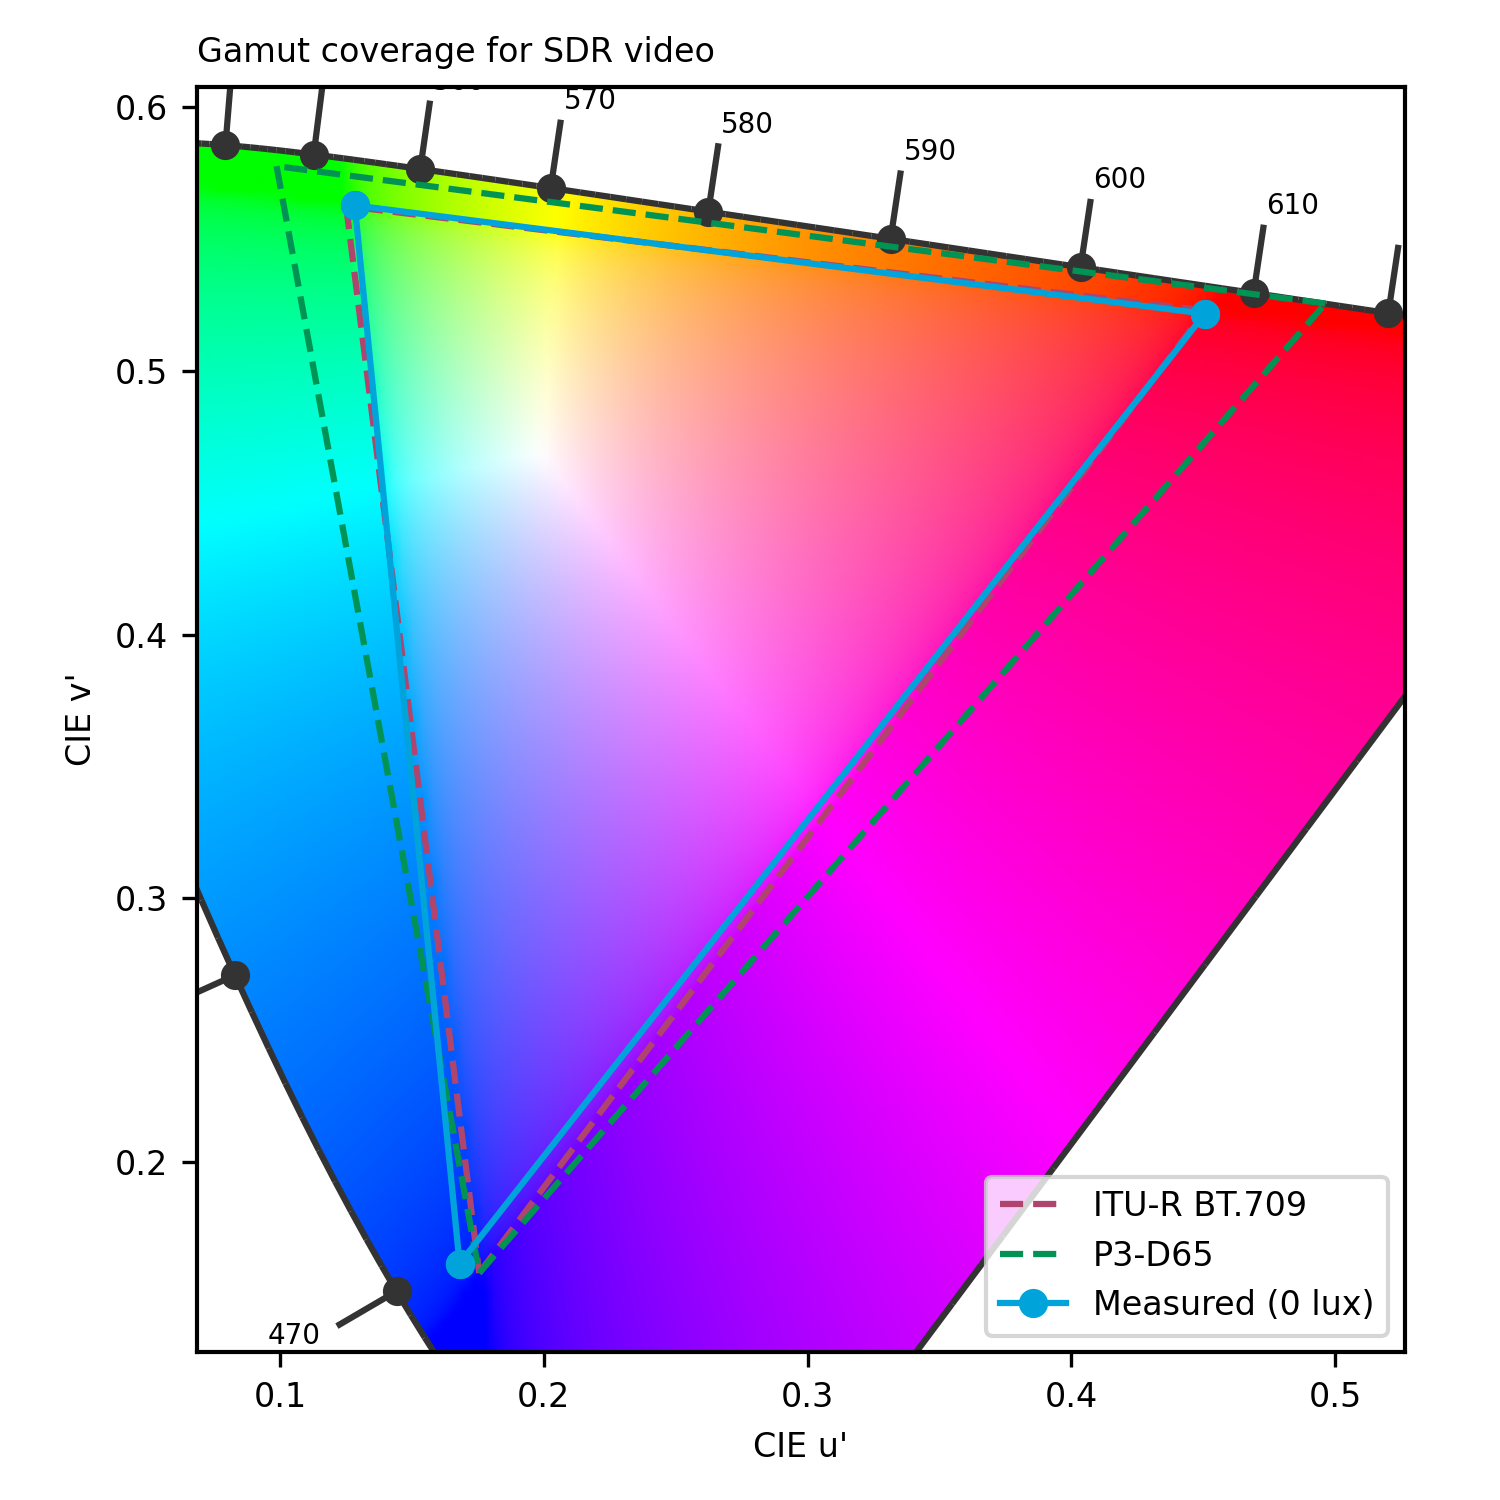
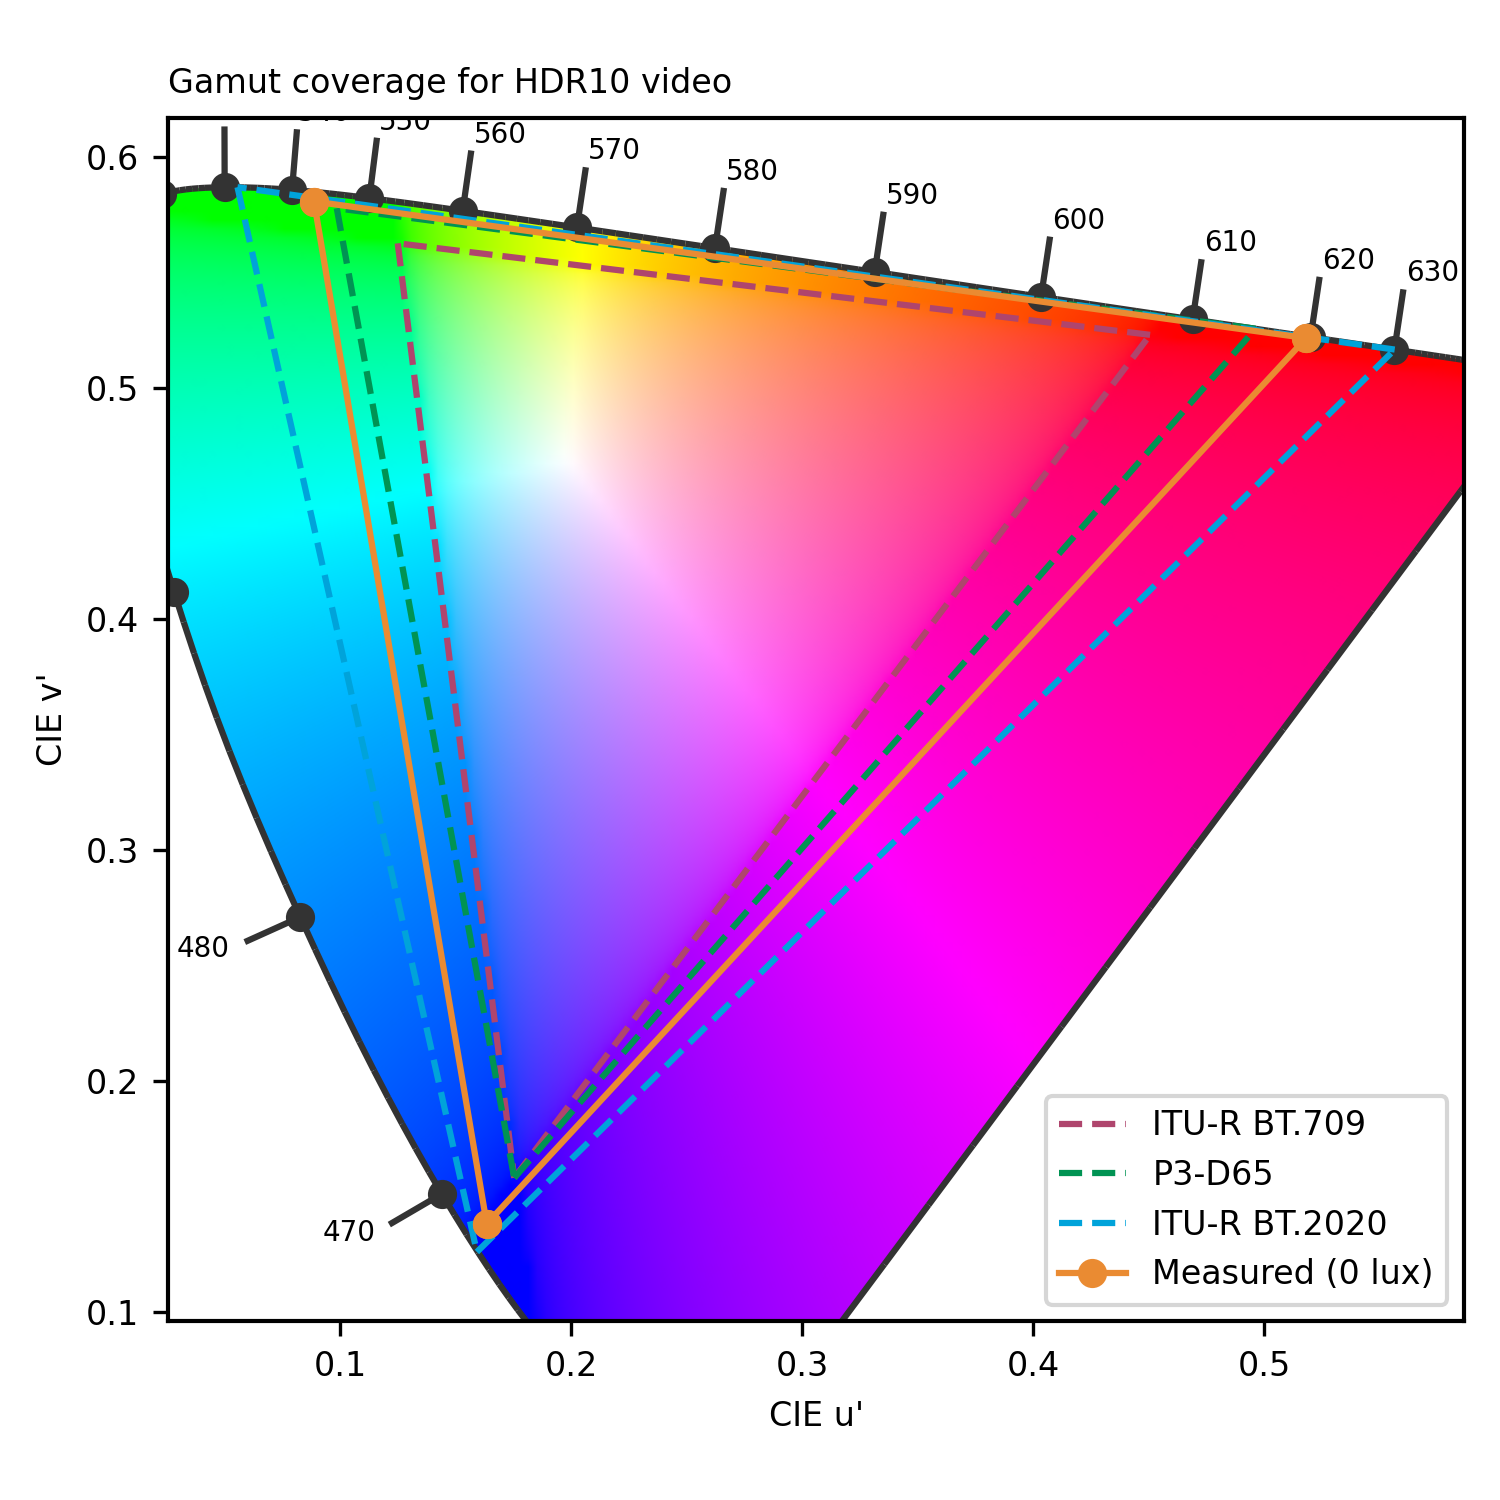
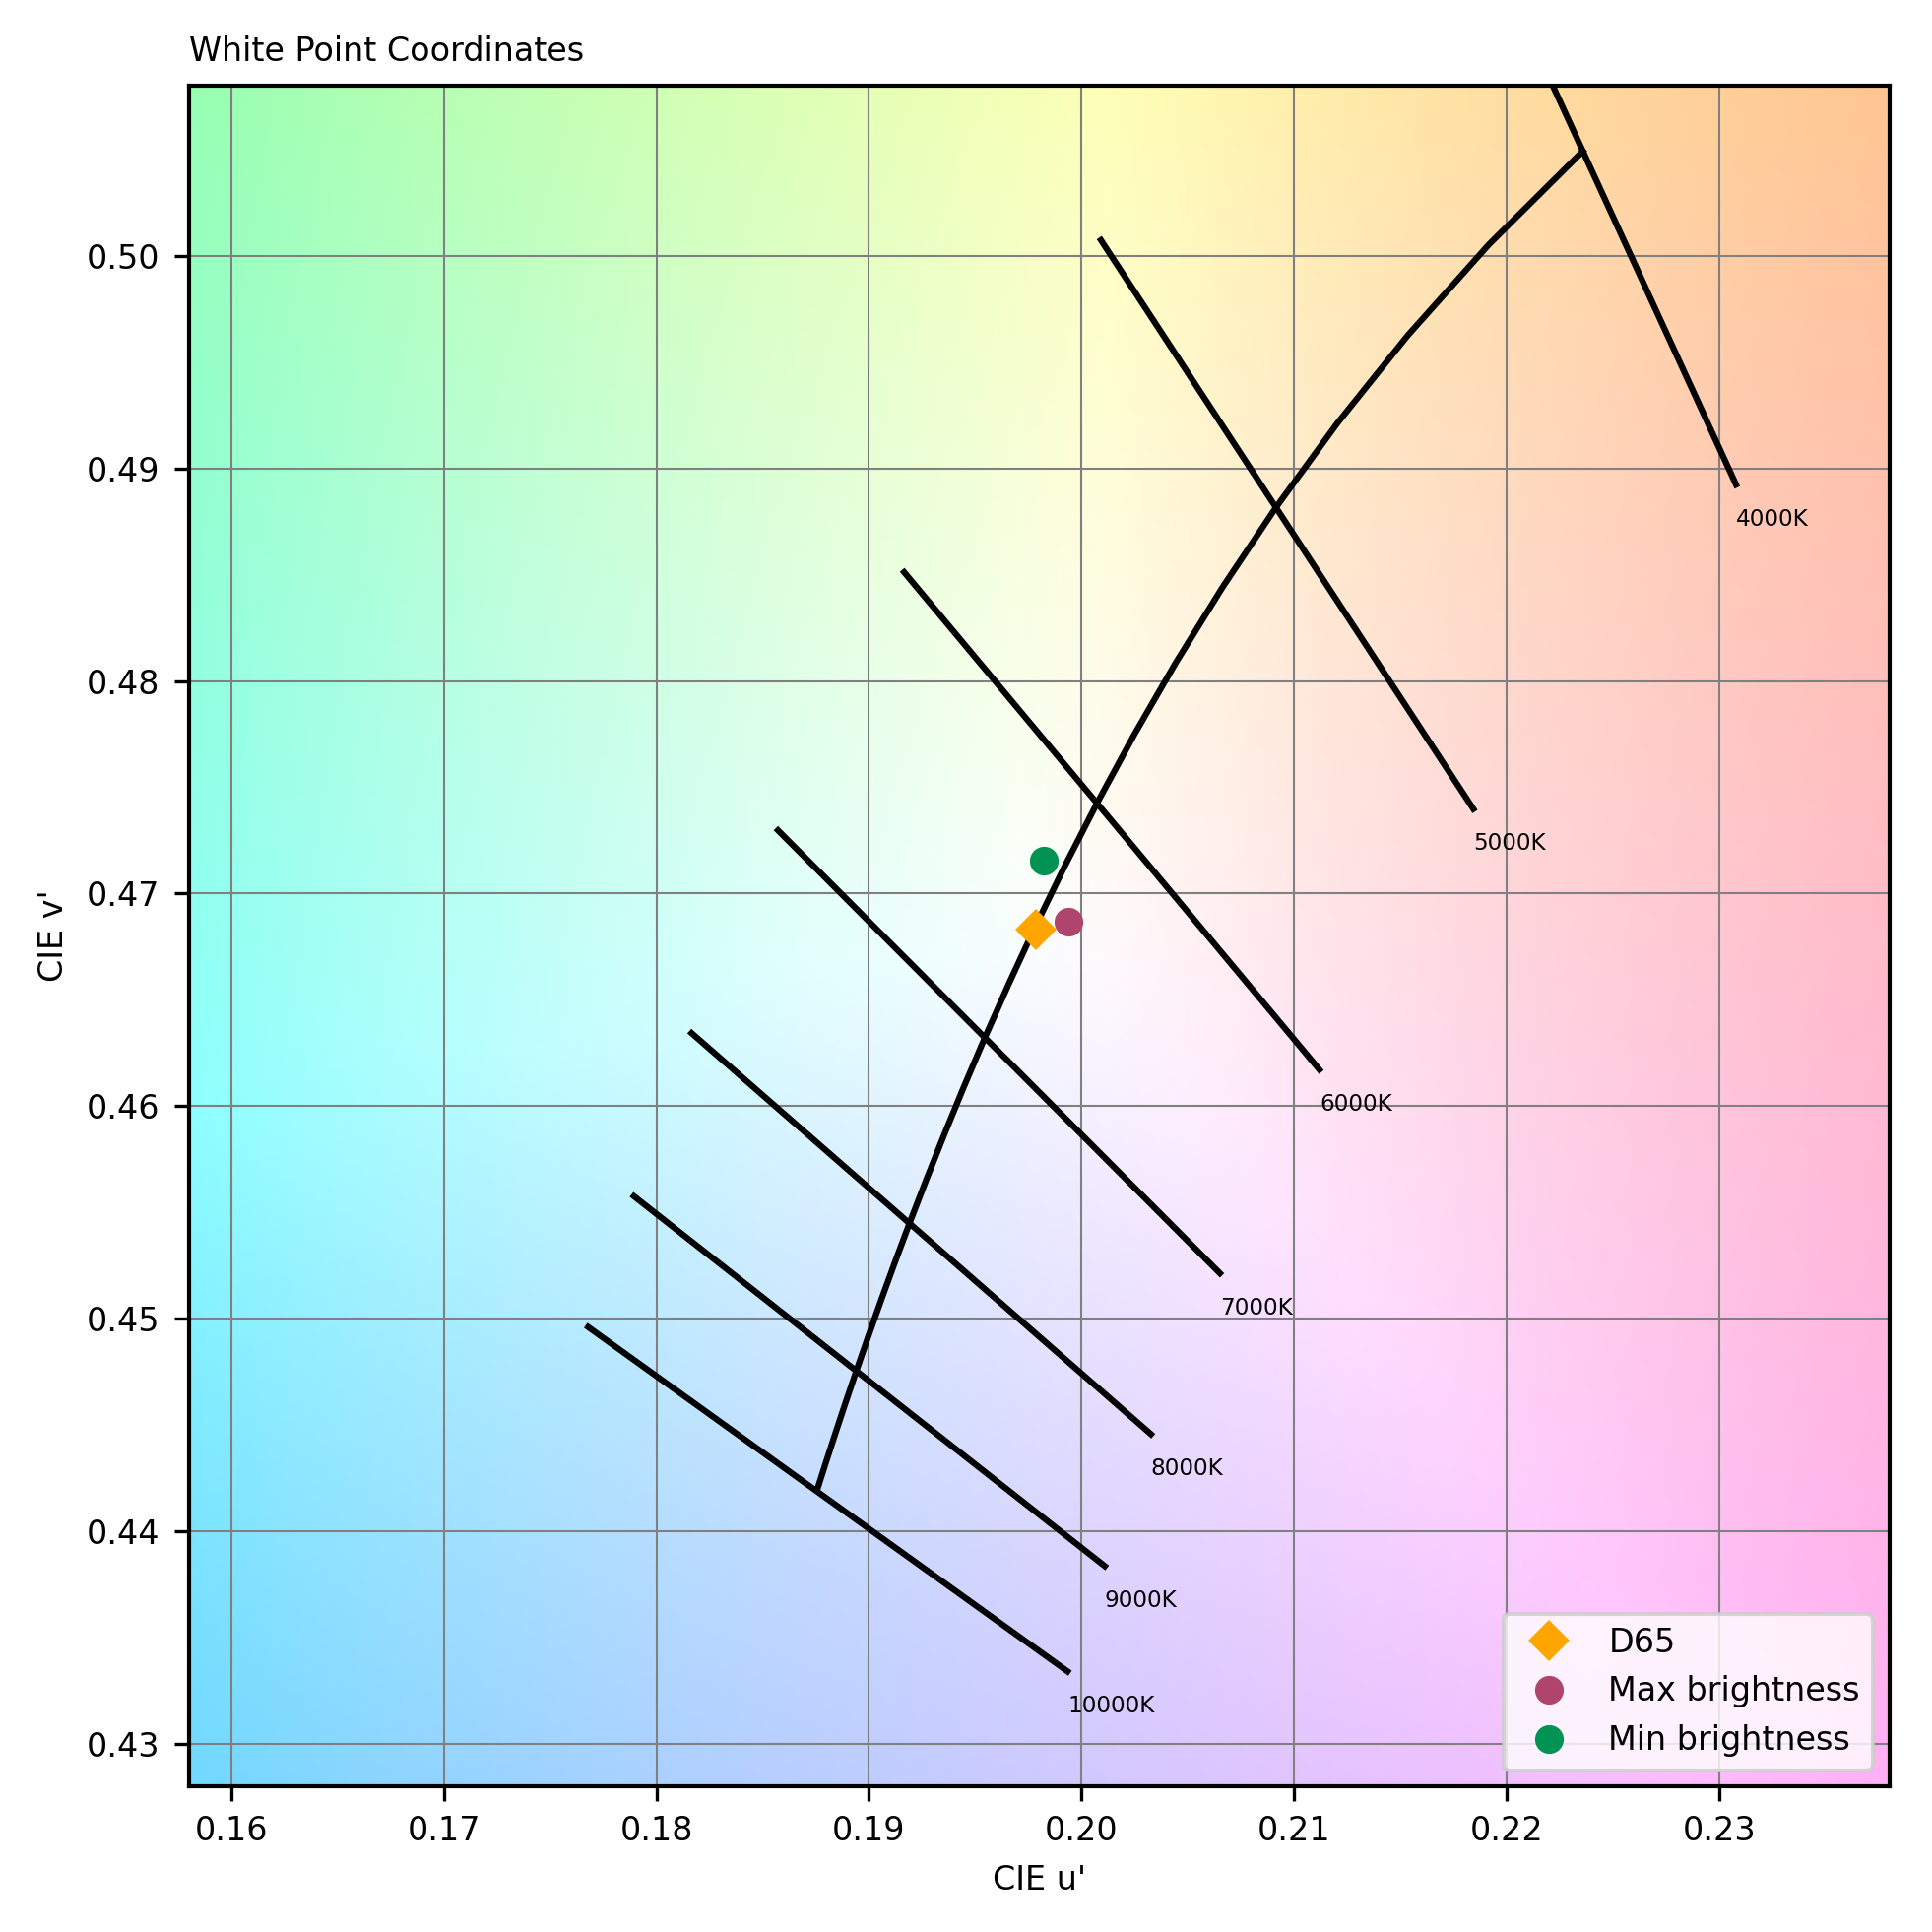
At 23 nits, minimum brightness on the HP display was high, at 23nits, which can be disturbing when using the laptop in low-light environments. Measured brightness for SDR (363 nits) and HDR (413 nits) were both below listed specifications. The device had good coverage of both the BT-2020 and BT-709 color spaces, with faithful colors in HDR, while slightly desaturated blues and reds in SDR.
EOTF in HDR had rendering issues, with 60% grey appearing brighter than full white, which may affect highlight rendering. Although bass and extensions were somewhat insufficient, the timbre rendition was well balanced for midrange content, despite a slightly muffled sound profile. Attack was generally sharp, but lacked punch. The laptop provided a nicely wide and precise sound scene.
Display
HP Spectre x360 (2023)
156
The following chart presents the display subscores for the multimedia use case:
The following graphs show the objective measurements performed in our display lab:
cd/m²
cd/m²
cd/m²
cd/m²
cd/m²
cd/m²
cd/m²
cd/m²
cd/m²
 Distribution of brightness (min)
cd/m²
cd/m²
cd/m²
cd/m²
cd/m²
cd/m²
cd/m²
cd/m²
cd/m²
Distribution of brightness (max)
Audio
HP Spectre x360 (2023)
152
The following chart presents the playback for the multimedia use case:
The following graphs show the frequency response, distortion and directivity in multimedia playback, recorded in our semi-anechoic room:
DXOMARK encourages its readers to share comments on the articles. To read or post comments, Disqus cookies are required. Change your Cookies Preferences and read more about our Comment Policy.