When DXOMARK first started testing smartphone camera image quality in 2012, the protocol was called DXOMARK Mobile, and the No.1 camera was the Nokia 808 PureView, with a score of 61. Now, after five revisions, the protocol is called DXOMARK Camera V5, and the top devices achieve scores of more than 150! In just over 10 years, smartphone photography has evolved dramatically, putting into consumers’ hands the kinds of powerful image technologies that were once only possible with full-sized professional cameras.
The image-quality team at DXOMARK has scrupulously followed the evolution of smartphone camera technology and continues to do so, adapting its testing protocol to ensure that the evaluation remains rigorous and up-to-date as possible.
This article takes a comprehensive and in-depth look at the latest version of the DXOMARK Camera protocol and scoring system, which was released in October 2022. This article presents in never-before-seen details the intense efforts that go into evaluating image quality. Discover step by step how DXOMARK tests every smartphone camera, its testing philosophy and methodology, including all image quality attributes and sub-scores. For the first
time, DXOMARK is also proud to share its full-score formula, including the weights of the sub-scores.
We hope you enjoy this journey into our laboratories!
Disclaimer: This article contains copyrighted material we believed to be covered by section 107 of the US Copyright Law, known as ‘fair use’.
Testing method
The heart of our testing method is to represent the user experience. We evaluate it scientifically and relay the results with transparency and independence. We regularly study the evolution of user preferences. We then update and complement our testing in the lab or in real-life scenarios.
How to evaluate image quality?
Image Quality Evaluation (IQE) on natural scenes is not a new subject. It is almost as old as the photographic art itself. It consists in mathematically quantifying and predicting the pictorial quality distribution produced by an imaging system under actual consumer usage. To do so, one needs to integrate different and calibrated psychometric experiments to construct quality rulers for the assessment of individual quality attributes by our expert analysts[1].
The source of the evaluation can be an objective measure, or a comparative, perceptual metric. The first one requires a controlled capture environment, found in a lab setup. The latter is performed in a lab or in a natural setting, as long as it allows a fair comparison. At DXOMARK, we use both lab setups and natural scenes. In the first one, we perform both objective and perceptual evaluations. We use the perceptual method for our assessment of natural scenes. We made this choice because we believe natural and lab scenes enter a dialogue, with only one goal in mind: to produce a score matching real users’ preferences.

We perform a perceptual analysis when there is no existing objective measure, or when it provides a complementary viewpoint on an image quality attribute. The reason for this is two fold: First, a lab cannot reproduce every complex scene; second, modern smartphones recognize and adjust to some types of natural scenes.
Here is an example of the dialogue between objective and perceptual evaluation:
When analyzing the texture in the lab, we first measure an objective texture acutance. Then, we appraise detail preservation using an artificial-intelligence-computed score on a chart. Our experts add to these the perceptual scores from the testing of real-life situations. These cover detail preservation, local loss of texture and unnatural detail rendering.
Our philosophy is to generally do all testing using the smartphone’s default mode. We also use the default camera application. However, there are some exceptions: flash auto/off, zoom, portrait (depth or bokeh) mode and video resolution and frame rate. For these, we select manually the mode to test (see later in this article). Aside from the difficulty in testing an arbitrary number of camera apps and modes, this approach reflects the experience of the majority of smartphone photographers. We found that the majority of users take images with the default setting. Indeed, according to a DXOMARK-YouGov survey [2], 78% of smartphone users declare using it often in default mode, while only 11% use the pro mode often.
Lab tools and setups: extensive and repeatable image-quality evaluation
DXOMARK was already making image-quality lab hardware and software in 2003, nine years before testing its first smartphone! All our protocols rely on our homegrown lab setups for objective and perceptual measurements. They reproduce what our photographers, engineers and scientists have observed in the real world. A lab simulates situations controlled by parameters such as lighting, tilt, vibration or white balance.
Tests are therefore fast and repeatable to a level that is not possible with natural shooting plans. Furthermore, we are able to compare devices from one shoot to another because we know that we perfectly control the environment.
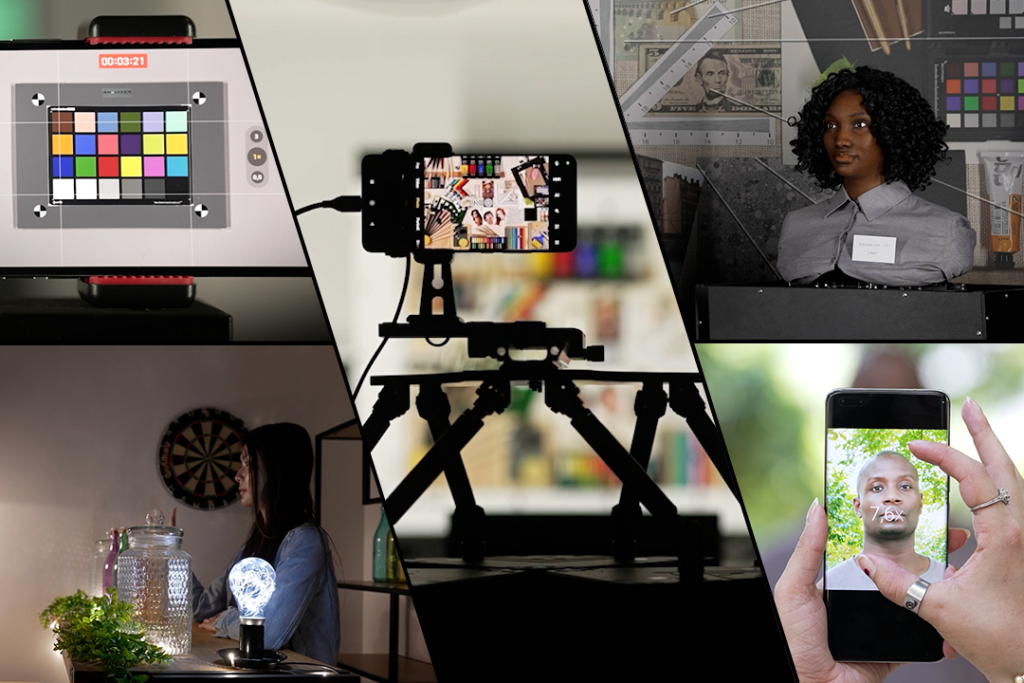
Although the Camera protocol uses a dozen lab setups, it relies for the most part on:
- The fixed charts setup, a set of reference hardware including our iconic DMC (DXOMARK Chart).
- The HDR Autofocus, Motion and Timing Setup – AKA AF-HDR – developed for advanced evaluation of autofocus, noise and more in High Dynamic Range lighting conditions.
- The HDR Portrait, which aims at reproducing a portrait with slight to strong backlit conditions.
- The Bokeh Perceptual Setup, which aims at pushing computational bokeh to its limits.


Motion and Timing Setup


In the fixed chart setup, we use a shaking platform to reproduce the natural shake of a human hand holding a camera. We also use a proprietary Automatic Lighting System, which recreates lighting environments between 1 lux and 1000 lux. Finally, we use a set of charts, among which is the DMC, or DXOMARK Chart, to test specific aspects. It is ideal to evaluate detail preservation, resolution, noise, color shading, moiré, aliasing and exposure. Beyond the DMC, we also use a Color Checker, a Visual Noise, and much more. We assemble and test all this hardware in our own workshop. There, it undergoes stringent quality assessment and calibration to ensure measurement repeatability.
The HDR Autofocus, Motion and Timing Setup reproduces with fidelity real-life situations and test attributes such as Autofocus, Texture, Noise and Exposure. For autofocus, we execute difficult scenarios with fast appearance and disappearance of objects in front of the camera. We also evaluate shutter lag, using the timer box on the right. This box also measures capture time. This setup assesses texture through a pattern of different sizes and various shades of gray. The moving chart on the left provides a mean to evaluate motion blur texture. Finally, the bright charts on top and on the right simulate the difficult scenario of High Dynamic Range scenes.
All these setups and their associated measuring tools can be purchased through our Analyzer division, allowing anybody to reproduce our lab protocol in their own test environment.
Natural Scenes: Assessing image quality outside of the lab
Photography starts with a scene. Is it a landscape? A portrait? Maybe a life still? And what makes it a worthwhile picture? The answer to this last question is that you need a good photographer and a good camera. DXOMARK cannot make you a good photographer, but it can evaluate the latter. Yet, with so many new technologies packed into the latest smartphones, the device sometimes behaves like a behind-the-scenes assistant photographer, trying to improve your final images.
Most smartphones today are able to take decent photos and videos in many conditions. They often even challenge DSLR cameras. We demonstrated this in our 2020 article on how the image-quality gap is closing between cameras and smartphones[3]. Although lab scenes allow for great repeatability, they can only test what they were designed for. By adding tests in diverse real life scenes, we are able to check if the camera performs the same way it did in the lab. We can also use natural scenes to hunt for unexpected behaviors, which can be linked to new technologies, bugs, artifacts or even new human-to-smartphone interactions.
That is why finding a smartphone camera’s weaknesses takes more effort. Hence, our smartphone Camera protocol contains an extensive shooting plan in natural environments. It was designed by our photographers and experts, who unleashed their creativity to set up challenging scenarios for both photo and video.
Our shooting plan contains a wide range of scenes. They represent most of the scenarios a smartphone photographer might encounter, often embedding multiple challenges. They can be outdoor, indoor, low light or night pictures. For each scene defined in our shooting plan, we lay out very clear instruction for repeatability control:
- We take each picture at least five times to evaluate both repeatability and to make sure we choose the best one for a fair comparison.
- We shoot with multiple devices, including reference devices from previous tests. This is for comparison purposes.
- Professional photographers shoot every capture. We train them for multiple days before they conduct their first shoot.
- Every scene is framed with the same method, described in our shooting instruction book.
- We use professional models in our pictures. They are trained to have similar expressions and postures in each of their scenes. Our shooting plan also specifies the model’s skin tone in each scene.


Here are 20 photos from 16 devices of one scene over six months.
Evaluating with quality rulers
Once the shooting is over, we evaluate the pictures in a controlled viewing room. Each viewing room uses calibrated screens and a controlled lighting level. IQE engineers and experts then compare the pictures of all the cameras used during the shooting, one by one. They grade or video with quality rulers.
A quality ruler is a tool used to attribute quantitative value to a subjective analysis. It works like this: For each picture and each image attribute, the analyst must answer a question, attached to a score. Is the face on this portrait is underexposed (2 points), well exposed (5 points), or strongly overexposed (-2 points)? Does the sky in a landscape show strong clipping (-2 points), some clipping (2 points) or no clipping (5pts)? IQ rulers are critical to an effective device scoring. To give you an order of magnitude, just for indoor photo scenes, we use 53 IQ perceptual rulers!

Our teams of engineers, experts and photographers designed and improved these quality rulers over time. We also conduct regular consumer surveys and panels. For example, for the 2022 revision of the camera protocol, we conducted a consumer survey with YouGov. We found that 50% of users were not satisfied with their phone’s performance in low light. This led us to investigate in depth the low-light exposure, color and contrast challenges.
To do that, we built a user panel. Beyond our own experts, we included professional photographers, photography students and consumers without any photography knowledge. They were from Europe, India, and China. Using a pairwise comparison methodology[4], we extracted Just Objectionable Difference (JOD) scores as a function of exposure or white balance cast. This put a value on real user preferences. We then refined the range of acceptance and rejection in our perceptual image quality rulers. Thus, our IQ rulers comply with the needs of actual smartphone camera users.


Defining objective measurement acceptance
This careful definition of user preferences then made its way into our objective evaluation in the lab. In the context of color, for example, we charted the user-preferred white balance coordinates in L*a*b* color space. This takes the form of an ellipsis that includes not only the accurate white point, but also the zone of the space where users found the image the most pleasant. The measure is objective, but we base the criterion for differentiating good from bad pictures on actual user preference, and not on an arbitrary spec. We perform this process for each scene, considering both lighting condition and actual color temperature.


What’s in a score?
Scoring is at the heart of DXOMARK’s mission. For each given image quality attribute, we compute scores at the lowest level. We also compute scores based on lighting conditions, such as low light, outdoor and indoor. Since its inception, we have split our overall smartphone camera score into sub-scores. As of today, we count five of these main sub-scores: Photo, Video, Zoom, Preview and Bokeh.
List of Sub-scores
Still photography is the most important element of a smartphone camera. We weight this part of our score to 50% of the global result. This was validated by our latest consumer survey. In the 2022 revision of our protocol, the Photo sub-score saw radical changes. We extended the photo space, updated our low-light photography analysis framework, and created the Portrait HDR lab setup. In previous versions, we could only assess the latter with natural scenes and perceptual appraisal.
The DXOMARK Photo space
We call photo space the span of photographic scenarios covered in our photo shoots. We aim at increasing the photo space for each new revision of the Camera protocol. Our 2022 revision now includes 1,800 photos taken in the laboratory across 20 setups, and more than 600 images from natural scenes, covering 25 typical scenes a smartphone user is likely to shoot. Here are some examples of these use cases: landscape, cityscape, architecture, still life, objects, people and family, backlit portrait, close-up, etc.
We ensure the validity of our protocol, not by the fact that we assess 100% of the different scenarios, but by covering all the technical challenges encountered by cameras in these scenarios. We break down these challenges into six image quality attributes: exposure, color, autofocus, texture, noise and artifacts. We dive deeper into the specificities of these attributes in the second part of this article.

The latest addition to our photo space is the close-up category of photos. Although most smartphone cameras claim to have macro capabilities, it is still rare to have one that can actually shoot a 1:1 magnifying ratio, which corresponds to the standard definition of macrophotography. By putting them to a selection of close-up tests, we can determine which ones are more genuine macro performers.
We defined a shooting plan in two parts: First, we shoot a series of three progressively more close-up shots of an official ID document, reaching a magnifying level under at least 1:5 in order to evaluate whether the device under test can pass a minimum image quality level. In 2022, the test was successful in only 30% of the cases.
Then, we shoot a new series of close-up pictures representing typical macrophotography scenes, and we perform a perceptual test. A close-up score is then calculated on an open scale, which we integrate into the photo sub-score calculation. On top-score devices, the close-up score represents less than three percent of the photo sub-score.


Portraits

Photographs or videos of people represent more than 50% of all camera activities around the globe, according to a DXOMARK and YouGov survey[2]. Whether it is a graduation ceremony or a winter afternoon at home, the situations for taking portraits are countless. Capturing people involves many challenges such as face rendering, contrast, motion, skin tones and many more.
In practice, exposure and color require perfect settings to bring a portrait to life while staying true to the emotion of the model. The famous 1985 “Afghan Girl” portrait by Steve McCurry [5] shows a perfect balance of exposure and color between foreground and the background, between fabric and hair, skin and eyes.
The more challenging aspect of a portrait has become the HDR portrait: It is the situation in which the subject and the background show an important difference of illuminance. Either the the subject is in a low-light foreground and the background is very bright, or vice-versa. This often leads to only the person or the background to show proper exposition.
")
Just a few years ago, only the best photographers could master such a challenge, such as Annie Leibovitz in her 2007 portrait of Queen Elizabeth II [6]. In this historical portrait, even the darkest parts of the picture show incredible detail, while the face of the face of the monarch remains well exposed from the light coming from the window. Today, most phones can perform this magic in a blip.
In order to evaluate the image quality of such a difficult scene on smartphone cameras, we have developed a dedicated lab setup, which includes both bright background and realistic mannequins. Thanks to our Image Quality and AI expertise, we developed four dedicated evaluation metrics on the HDR Portrait setup: face exposure, background exposure (bright preservation), local contrast quality, and an AI-based detail preservation measurement.
The Decisive Moment
Parents of young children know this: Catching the perfect picture during a fun time is hard. Not only do they have to trigger the shot at the perfect moment, but also they need to freeze the shot to get a sharing-worthy picture. This is also why street photography is an art of its own.
With the two challenges in mind, DXOMARK developed the HDR Autofocus, Motion and Timing (AFHDR) setup. It is based on our expertise in natural scenes. Its 2022 revision improves upon the previous one by adding moving objects. They reproduce realistic motions in the frame. Used extensively in the DXOMARK smartphone camera protocol, AFHDR enables objective measurements of autofocus, including shutter lag and motion blur texture.
Beyond the AFHDR setup, we also perform real-life photography of action moments. On those we measure shutter lag and evaluate motion blur. We do not aim at creating artistic photos here, but at creating a wide range of lighting conditions and use cases. The lighting conditions are outdoors or indoors, in sunlight ,or at night-time. This holistic approach to motion allows the DXOMARK score to represent the real user experience.


According to the DXOMARK-YouGov survey[2], 24% of smartphone users use video as their primary mode of taking images. It is also a fast-growing usage of smartphone cameras. To represent both the present and the future, we set this sub-score weight to 28.5% of our global score. The video sub-score embeds 10 years of research and development on video quality evaluation. We regularly publish papers about our research for the scientific community and the industry[7][8].
Choosing the right video mode
In video mode, we use the resolution settings and frame rate that provide the best video quality. To do so, we shoot a short test before launching our full test protocol. For example, a smartphone might offer a 4K video mode but use 1080p Full-HD by default. In these cases, we will select 4K resolution 30FPS mode manually, which will greatly benefit detail preservation, if we detect no strong degradation of stabilization or noise management, for instance, compared to the 1080p default mode.
As for the output format, we favor 10-bit HDR video formats when available. We do not favor any HDR format, whether it is Dolby Vision, HDR10+, Vivid HDR or any other kind. Depending on the format (SDR or HDR), our experts perform the perceptual analysis on a suitable calibrated display.
Same image quality attributes, different approach
In video, we define image quality by the same six essential image quality attributes as in photo, with the addition of stabilization. However, the way we evaluate them is different to take in account the temporal aspect of these attributes. Indeed, what good is it to start a recording with great exposure, color or focus, if it changes completely after a few frames?
We have therefore adapted our evaluation method. We have developed a series of challenging scenes for the video camera to test the ability of the smartphone camera to adjust to changing environments. For example, we test drastic and fast changes of light, progressive introduction of outdoor light in a shadow area, or turning on the lights in an apartment. If the camera transitions fast and smoothly, it gets a high score.
On the front of the artifacts, we also evaluate video-specific ones, such as frame rate issues, blocking (image compression issues), judder or flicker.
Video space
Our video space covers a wide selection of scenes. Just like for the photo space, they cover three lighting conditions: outdoor, indoor and low light. We precisely scripted them to test all attributes, including stabilization and their temporal aspect. They include a wide range of motion and light transitions. These use-case scenes include low-light dinners, a bar, apartment tour, walking and running outdoor videos, subject tracking, video panning, and many others.


Computational photography enables the simulation of continuous zoom by using two to four fixed lenses. But not all smartphones are created equal. Despite touting great hardware specifications, the quality of the extra lenses sometimes leads to results poorer than the main lens and its 23 mm to 27 mm equivalent focal length.
DXOMARK introduced its first smartphone camera zoom evaluation in 2017. First only for tele, we included ultra-wide score in 2019. Smartphone vendors use the power of ISP chips to perform zoom, generally through image fusion from multiple camera modules. Today, systems have become so complex that the full range of focal lengths require our assessment. That is why in 2022, the Camera v5 protocol introduced an extensive image quality evaluation over the full zoom range, both for ultra-wide and tele focal lengths. We evaluate between eight and 10 focal lengths for all quality attributes. We also include all the preset zoom buttons from the camera UI.
The development of this test is a complete overhaul from the previous version of the test. We include objective tests from the lab and perceptual evaluation in the lab or natural scenes. This extensive setup allows us to provide a score per focal distance. We then produce a curve of the zoom performance beyond the native focal length of each camera module.
DXOMARK LAB ZOOM SETUP
Our lab setup is made of a smartphone on a shaking platform that reproduces a handheld motion. This platform can be moved back and forth from our DXOMARK “DMC” chart thanks to a rail on which the stage can glide. We move the stage from a short distance, matching a 12 mm equivalent focal distance, up to a distance simulating a 200+ mm equivalent focal length. For each distance, we pinch to zoom on the phone screen to frame the DMC chart similarly every time. After this, we set up the phone in its default zoom ratios using the UI buttons (eg: x0.5, x1 and x3). If the buttons correspond to a zoom ratio not tested yet, we also measure the image quality at this zoom level. The attributes we evaluate in the lab are exposure, texture (detail preservation and resolution) and noise. We also launch our series of measures in outdoor, indoor and low-light lighting conditions. We then extract the final synthetic score.
Some surprise can arise from our in depth measurements, such as medium zoom levels that can produce lower image quality than some more extreme ones. The following chart shows, for example, our zoom IQ chart for two older devices: the Google Pixel 6 Pro and the Apple iPhone 13 Pro Max. We observe that the iPhone does show issues in the 35-70 mm range, while the Google device suffers in the next bucket (70-85 mm). They also differ by their maximum effective zoom ratio. The iPhone shows good image quality up to 4x. Meanwhile, the Pixel can reach 6x before its image quality truly declines.
![]()
Video zoom

That is why we introduced in 2022 a specific video zoom score. We evaluate up to six focal lengths on texture, noise, exposure and resolution on the DMC chart. The in-lab measurements are complemented with perceptual evaluations of zoom smoothness. This shows the ability of the camera to switch zoom smoothly between camera modules. The combined score resulting from the test is integrated into the overall zoom score.
In the world of traditional photography, bokeh was a hardware-only property. Major lens makers were fighting for providing the fastest aperture. These lenses create a “depth effect” that blurs the plans beyond the subject of the picture. This was the sole way to properly separate subject from background.

Good bokeh is especially necessary for portrait pictures because of the attention must be on the model. This famous portrait of Naomi Campbell by David Demarchelier for Vogue in 1987[10] shows a great example of that. In movies, separating plans improves narration by emphasizing the important part of the image. For example, filmmaker Stanley Kubrick used bokeh effects, in his 1975 Barry Lindon and 1999 Eyes Wide Shut[11] movies.

With the introduction of computational bokeh on the iPhone 7 series, the portrait has become a staple of mobile photography. Smartphone bokeh is different from the one found in classical photography. On smartphones, bokeh is the result of using two or more camera modules to evaluate the depth of field needed for creating the blur. Another way is through AI systems that segment the scene itself into foreground, subject and background. The progress since 2016 has been staggering. Indeed, some modern smartphone now even produce native bokeh, thanks to bigger sensors and wide-aperture lenses. The best smartphone cameras in that field use a smart approach of using both natural bokeh and algorithms.
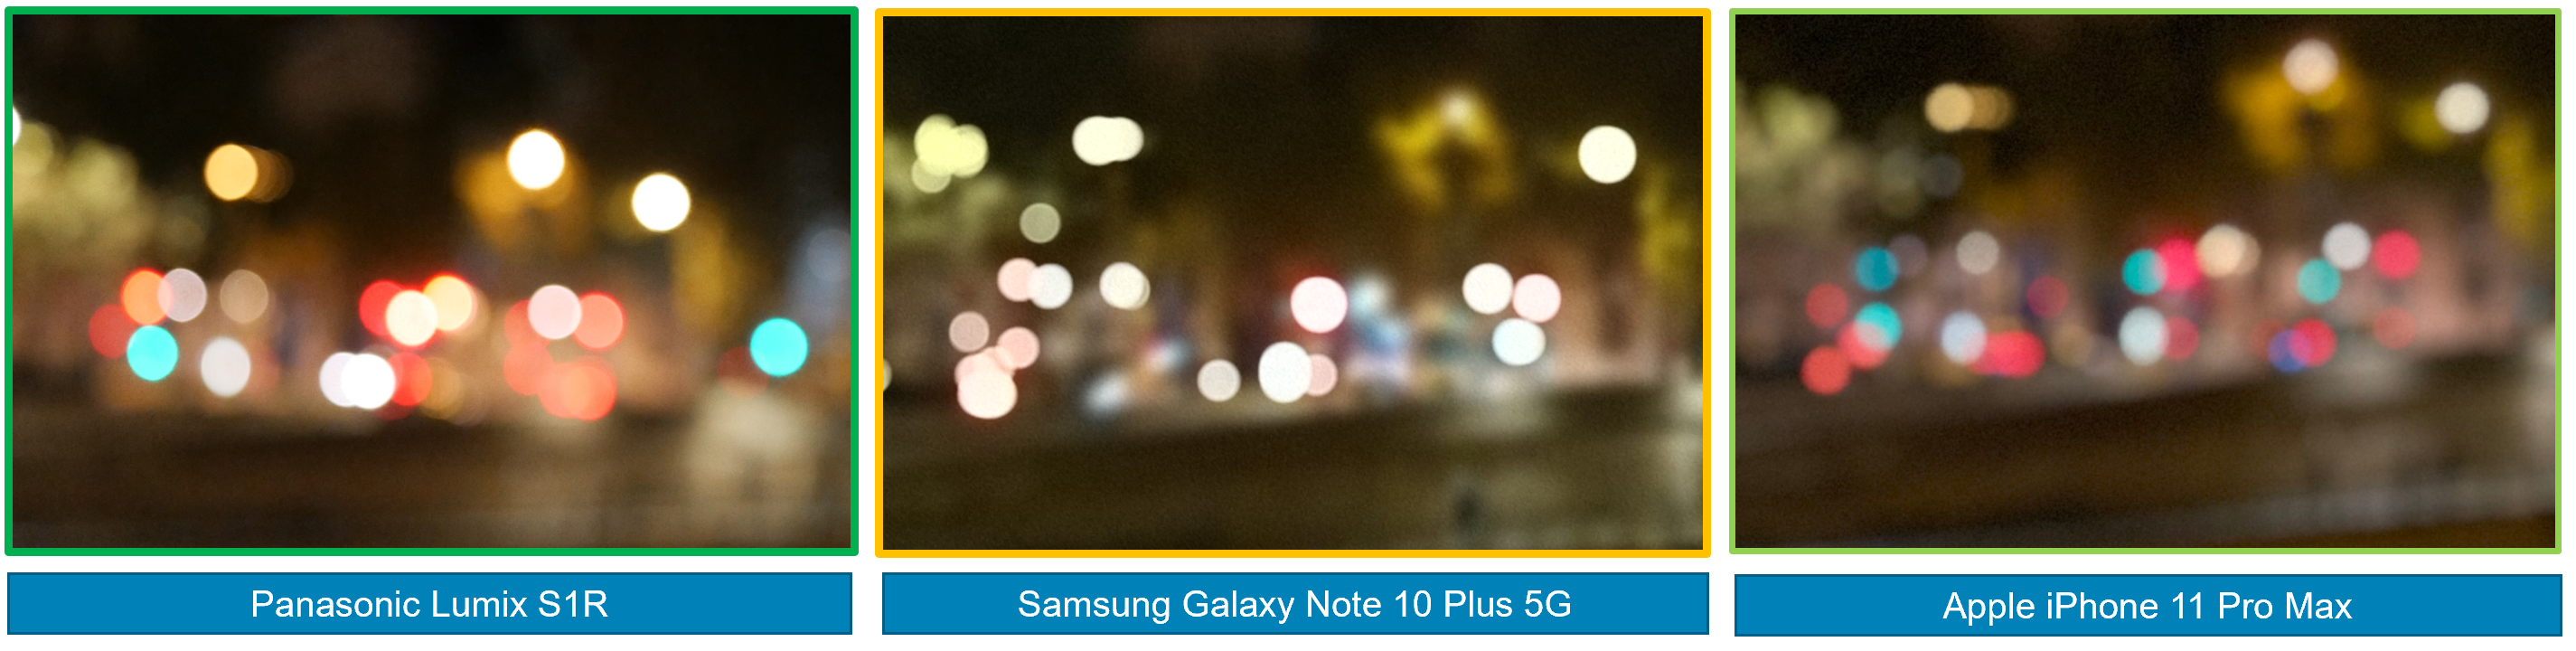
The quality of the computational bokeh effect can be a problem for smartphones, compared to full-frame cameras. Here you can see that while the full-frame camera has natural blur with proper color and shape, the Samsung phone has blur with the proper shape but little color, while the iPhone preserves the color but has an elliptical shape. First we show the entire image, then tight crops on the lights along the street:
We launched our first bokeh protocol in 2017, and we kept improving it year after year. We explain in detail how we test bokeh in this article. We evaluate how accurately the phone blurs outside the areas in focus. We also judge the quality and smoothness of the blurring effect. We use the bokeh of a professional camera as a reference standard, for example, a wide-open, 50 mm f/1.8 lens on a full-frame DSLR.

Testing for bokeh required entirely new evaluation scenes and tests. We measure how well cameras blur the background, and how well they deal with a variety of tricky situations. Examples of these are backlit portraits or objects presenting spiky elements, such as a crown. We also use the natural setups to detects flaws in automatic scene detection algorithms. For example, some cameras use face detection to blur everything in the image not looking like a face, but this approach is quite prone to errors, and it frequently leads to an aesthetically displeasing result.

Modern smartphone cameras heavily use post-processing to generate the best pictures. This leads to potential differences between the photo the user thinks he is taking and the actual result. Aligning the preview and the captured picture is a complex engineering challenge. Indeed, the live view uses light image processing, unlike the actual image processed in the background afterwards. Sometimes the final image is finalized a few seconds after it has been shot! Because of constraints in terms of battery consumption, computing power, or overheating of the phone, smartphone engineers must agree on trade-offs between these and the quality of the preview.
This is why DXOMARK has been scoring preview image quality on smartphone cameras since 2019. Our unique testing protocol allows to put a score on the quality of the preview mode, and therefore to favor smartphone makers who take a global approach to the photographic experience on their camera. We first perform a delta analysis of the live picture with the photography taken in outdoor, indoor and low-light conditions. We call the resulting score “wysiwyg” (What You See Is What You Get). We then include zoom smoothness, quality of bokeh and presence or not of frame drops.


Image quality attributes: The backbone of the DXOMARK score
In each sub-score, we appraise seven image quality attributes. These attributes are common to the whole camera industry as well as the scientific community[12]. Image quality attributes are: exposure, color, autofocus, texture, noise and artifacts.
List of Image Quality Attributes
Exposure measures how well the camera adjusts to and captures the brightness of the subject and the background. It relates as much to the correct lighting level of the picture as to the resulting contrast. For this attribute, we pay a special attention to high dynamic range conditions, in which which we check the ability of the camera to capture detail from the brightest to the darkest portions of a scene.
Conditions and challenges: We set up our lab to evaluate the smartphone camera exposure performance in situations ranging from low light (1 lux) to bright light conditions (1,000 lux). We have also created difficult challenges that reproduce difficult lighting conditions (such as portraits with backlit scenes) or with a large variation between light and dark areas (similar to sunlight in a forest). We compliment the lab evaluations by many carefully designed natural scenes outdoors, indoors, and in low light or night situations.
Assessment: We assess scene or face exposure, dynamic range, contrast and the repeatability of the exposure over consecutive shots. The objective measurements we use are L* lightness and Local Contrast Preservation Entropy. We also use Local Contrast Quality indicator. On the perceptual front, we use quality rulers that cover perceived target exposure, presence of dark or bright clipping, and contrast. In particular, we use a great diversity of portrait scenes. In these, we use models for the entire skin-tone spectrum to better evaluate skin exposure reproduction.
The color attribute is a measure of how accurately the camera reproduces color under a variety of lighting conditions. It also covers how pleasing its color rendering is to viewers. As with exposure, good color is important to nearly everyone. In particular, landscape and travel photographs depend on pleasing renderings of scenes and scenery. Pictures of people benefit greatly from natural and pleasant skin-tone representation, too.

Conditions and challenges: We measure color rendering by shooting a combination of industry-standard color charts (color checker, gray charts, etc.). We set up carefully calibrated custom lab scenes, and natural scenes under a variety of conditions. In the lab, a closed-loop system controls the lighting to ensure accurate light levels and color temperatures. The lighting conditions, here again, range from very low light to outdoor conditions. We split natural scenes between portraits and non-portraits.
Assessment: To test color, we evaluate how well and how repeatably the camera estimates white balance. Then we assess how pleasantly it renders colors in the scene. The objective tests always start from average and standard deviation of a*b* measurements. As for our perceptual set of evaluations, it looks into white balance accuracy and stability, skin tones and color rendering, presence of color artifacts, or visible color shading. For our 2022 camera protocol, we updated the acceptable ranges of color reproduction after conducting a thorough panel study of camera users.
Our evaluation acceptance range was designed to respect the camera manufacturer’s signature color rendering, as it is an important selling point for many companies and a matter of personal preference. For example, some cameras maintain slightly warm colors to convey the atmosphere created by low tungsten light. That is why we do not penalize cameras that remain consistent with the long history of the industry standards of color reproduction, dating from the film era. In the latest version of our protocol, color evaluation also takes into account how colors are perceived by the Human Visual System (HVS) under different levels of brightness or illuminant color temperatures.
The Autofocus (AF) attribute looks at how quickly and accurately the camera can focus on a subject in varying lighting conditions. Anyone who photographs action, whether it is children playing or a sporting event, knows that it can be difficult to get the subject in focus on time to capture the desired image.
Conditions and challenges: Our lab setup pushes the limits of the autofocus with a set of moving objects aimed at reproducing two main scenarios: family and landscape. To reproduce handheld motion, we use a robotic platform calibrated to actual human measurements. Here again, we explore a wide range of lighting conditions. When measuring autofocus performance, we defocus the camera before each shot, using a chart a few centimeters away from the camera, hiding a scene at infinity. We then measure the exact interval between when the close chart disappears, when our automation presses the shutter, and when the camera captures the image. We also extract the shutter time. In addition to our Analyzer LED Universal Timer, we have created a system that uses an artificial shutter trigger and multiple beams of light to ensure the accuracy of our autofocus measurements.
Assessment: We measure a camera’s autofocus accuracy and speed performance. At the heart of our objective measures, we use AF acutance and time lag measurements. We also count of the number of failures (out of focus images) versus the number of shots. On the perceptual front, we look at hundreds of scenes and evaluate whether the photographic subject is well tracked and in focus (subject’s face, near plane, middle plane or far plane depending on the scene). We introduced our shutter lag evaluation protocol in 2017. It remains one of DXOMARK most iconic measurement. Many players in the camera industry use it as their reference benchmark. We evaluate the autofocus performance on two axes: shutter lag, measured in seconds, which represents the speed of AF, and acutance, which represents the accuracy of the AF.

From these measurements, we extract four metrics illustrated in the image above and used to compute objective scores for autofocus:
-
- Average sharpness of the subject: It should be at least higher than 90%, having the subject always in focus is paramount.
- Sharpness repeatability: This metric should be as close to 0 as possible.
- Average time lag shows how fast the device captures the images: It should be as short as possible; the closer the points are from the dashed blue line, the better. If it is not the case, the key moment you are trying to capture might be missed, especially with fast-moving subjects like children or sports action.
- Time lag repeatability should also be as close to 0 as possible in order to be predictable for its user.
The texture attribute focuses on how well the camera can preserve small details. This has become especially important because camera vendors have introduced noise reduction techniques (for example, longer shutter times or multi-frame fusion). These sometimes have the side effect of lowering the amount of detail or add motion blur. For many types of photography, especially casual shooting, the preservation of tiny details is not essential. But those users who expect to make large prints from their photographs, or who are documenting artwork, will appreciate a good texture performance score. Expansive outdoor scenes and portraits are also best captured when details are well preserved.


Conditions and challenges: To cover all the different scenarios in which texture matters, DXOMARK uses three lab setups: our flagship DMC (DXOMARK Chart), then own AF HDR lab setup, and finally a HDR Portrait setup. The last one includes realistic mannequins, made to reproduce with fidelity the facial features (eyes, hairs, mouth…) and skin texture. We also use our own version of the “Deadleaves chart” in the AF HDR setup, which is compliant with IEEE’s Camera Phone Image Quality (P1858). Thanks to these, we can evaluate not only the intrinsic detail preservation but also the motion blur induced by situations such as children moving in a family shot. We also evaluate all our natural scenes for texture, with a split between portrait and non-portrait.
Assessment: One of DXOMARK’s new tool for texture is a set of Artificial Intelligence metrics called “Detail Preservation,” measured on the DMC chart and on the realistic mannequin. This new metric replaces analysis previously done perceptually. We developed the model for this metric using the large database of annotated images collected over the years. The images came from smartphone cameras, DSLRs and mirrorless high resolution cameras. We do also measure motion blur through a DXOMARK-developed metric called Blur Directional Unit, or BDU, which estimates the length of the movement captured when blur occurs (lower is better).
Our perceptual tests on natural scenes look into unwanted renderings that impact image quality (local loss of detail, oversharpening or unnatural rendering of facial details). We also appraise the presence of motion blur on moving objects.
Texture and noise are two sides of the same coin. Improving one often leads to degrading the other. The Noise attribute represents the amount of noise in the overall camera experience. Noise comes from the light of the scene itself, but also from the sensor and the electronics of the camera. In low light, the amount of noise in an image increases rapidly. If you take a lot of night or indoor photos, it is very important to find a phone camera with a good score. This guarantees minimum or no noise. Sometimes a very fine luminance noise remains, which is acceptable in some lighting conditions and a nod to the the film era. Some smartphone cameras increase the integration time but with poor stability or post-processing, they produce images with blurred rendering or loss of texture. Image overprocessing for noise reduction also tends to decrease detail and smooth out the texture of the image.


Conditions and challenges: The texture-noise trade off is a key issue in image processing. This is one of the reasons, we perform tests in a wide range of lighting conditions. In the lab, we use two internally-developed setups that have become standards in image quality for smartphone cameras. They also enable texture evaluation. The autofocus, motion and timing setup allows capturing a scene with motion, to simulate the user’s movements and backlit conditions. Our Analyzer software computes an AI-based noise analysis on the DMC chart.
The smartphone camera image-processing software can also detect elements of the scene, such as portraits or cars in motion, and process this type of content differently. Our photo and video spaces include such scenes as well across all light conditions to assess these optimized algorithms. Besides, we defined our natural scenes to challenge any side effects of excessively long shutter times or excessive image processing.
Assessment: We perform visual noise evaluation through an innovative automatic noise analysis on a still life chart. Thanks to the many photos classified by DXOMARK’s experts on the DMC, our team has been able to develop measurements based on neural networks and machine learning [13][14]. In particular, the software uses two crops ideal for identifying noise: a feather and a woman’s portrait. We evaluate noise on the subject of a portrait and the background, and noise management in the field or on moving objects.
Below is an example of a comparative chart extracted from our noise evaluation at various lighting levels.
The artifacts attribute quantifies image defects not included in the other attributes, caused either by a camera’s lens, sensor, or its processing. These can range from straight lines looking curved or strange multi-colored areas that failed demosaicing. In addition, lenses tend to be sharper at the center and less sharp at the edges, which is also measured as part of this sub-score. Other artifacts can be the consequence of computational photography, like ghosting or a halo effect. Each noticeable artifact has points deducted from a base value of 100. The aim is to achieve an artifact score as close to 100 as possible, have the most natural images possible.

Conditions and Challenges: Our laboratory testing solutions allow us to highlight chromatic aberrations and geometry defects in particular with two charts. Our MTF and Dots charts may appear simple. In fact, they are the best tools to evaluate the standard performances of a lens system.
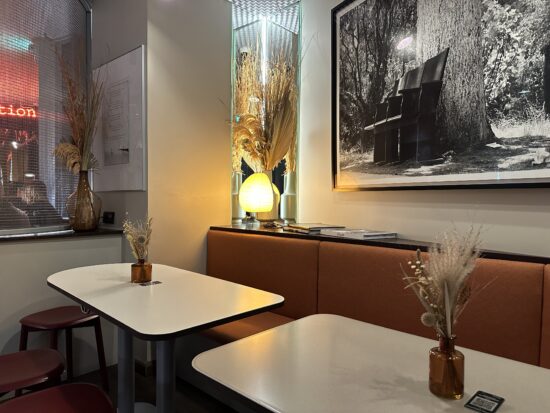
We complete our optical artifacts lab measurements by a comprehensive set of natural scenes for perceptual evaluations. Indeed, given the nature of these flaws, it is imperative to test a large number of conditions to identify them all. For example, to improve the quality of images, many smartphone cameras merge several images. This digital process can introduce some failures, one of the most common in modern computational photography being halo effect in HDR scenes. The two images below illustrate this artifact well.


Another common artifact is ghosting, visible for instance with a person waving hand and the fingers appearing in the wrong place on the picture. Therefore, motion in the test scenes is essential when evaluating artifacts.

Assessment: We use our own MTF chart. It is made of a slightly slanted black-and-white grid. The changes between light and dark areas allow computing the netting of this line (acutance) in the field and also the ringing effect. The Dots chart pattern consists of equidistant points that allow measuring the distortion, the decrease in brightness in the field (lens shading), and the chromatic aberrations introduced by the optical system.
With perceptual analysis, we evaluate other defects such as aliasing, flares, ghosting, color quantization, color fringing, or any new unexpected flaw in images.
Stabilizing a handheld video camera has been a major challenge for cinema since its invention. The famous scene of the boxer Rocky triumphantly running up the museum steps was made possible only by the Steadicam, a camera stabilizing system first used in 1976. The Steadicam can move smoothly in any direction, up stairways, around corners, along gravel roads[15]. But the the Steadicam was a cumbersome and heavy solution. Since then, technology advancement has made it possible to integrate optical image stabilization even in the smallest camera modules of a smartphone. Today, amateur videographers in Philadelphia can reproduce the Rocky scene with their 300-gram pocket camera.
The stabilization attribute measures how well the camera eliminates motions that occur while capturing video. Unless the phone is mounted on a tripod or on an external stabilizer when shooting video, it will wobble a bit – no matter how carefully it is held. The same is true when shooting while walking or running, or from a moving vehicle such as a bus or boat. For these and other reasons, handheld videos often appear shaky. To minimize that effect, many smartphones offer either electronic (EIS) or optical (OIS) image stabilization, or both, when capturing videos. A higher score here means steadier and more pleasing videos. Each type has pros and cons depending on the nature of the camera motion.
Conditions and challenges: We set up many outdoor, indoor and low-light scenes designed to create motion. We target four types of shooting motion: handheld static, handheld panning, handheld walking and running (outdoor only).
Assessment: To evaluate stabilization, our video experts will evaluate two scores: motion compensation and artifacts. Motion is the evaluation of the actual stabilization performance, whether from digital or hardware origin. The second type of evaluation, called artifacts, relates mostly to the computational aspect of stabilization. It covers a wide range of artifacts: change scene effects, frame shift, “jello” effect, residual motion and differences in sharpness between frames.
Score equation: How to sum up image quality into one number
The most frequently cited score for a mobile device camera is the overall score. We compute it from the sub-scores. The resulting number gives a sense of the device’s total image quality performance. It is a user-centric score. Providing the overall score is important for two reasons: It conveniently summarizes all the aspects of a smartphone camera’s performance without having to search through the test results. Plus, it is easy to rank. In this section, you can find out how DXOMARK generates the Overall score using sub-scores and weights.
Trustability: An important concept behind our scoring system
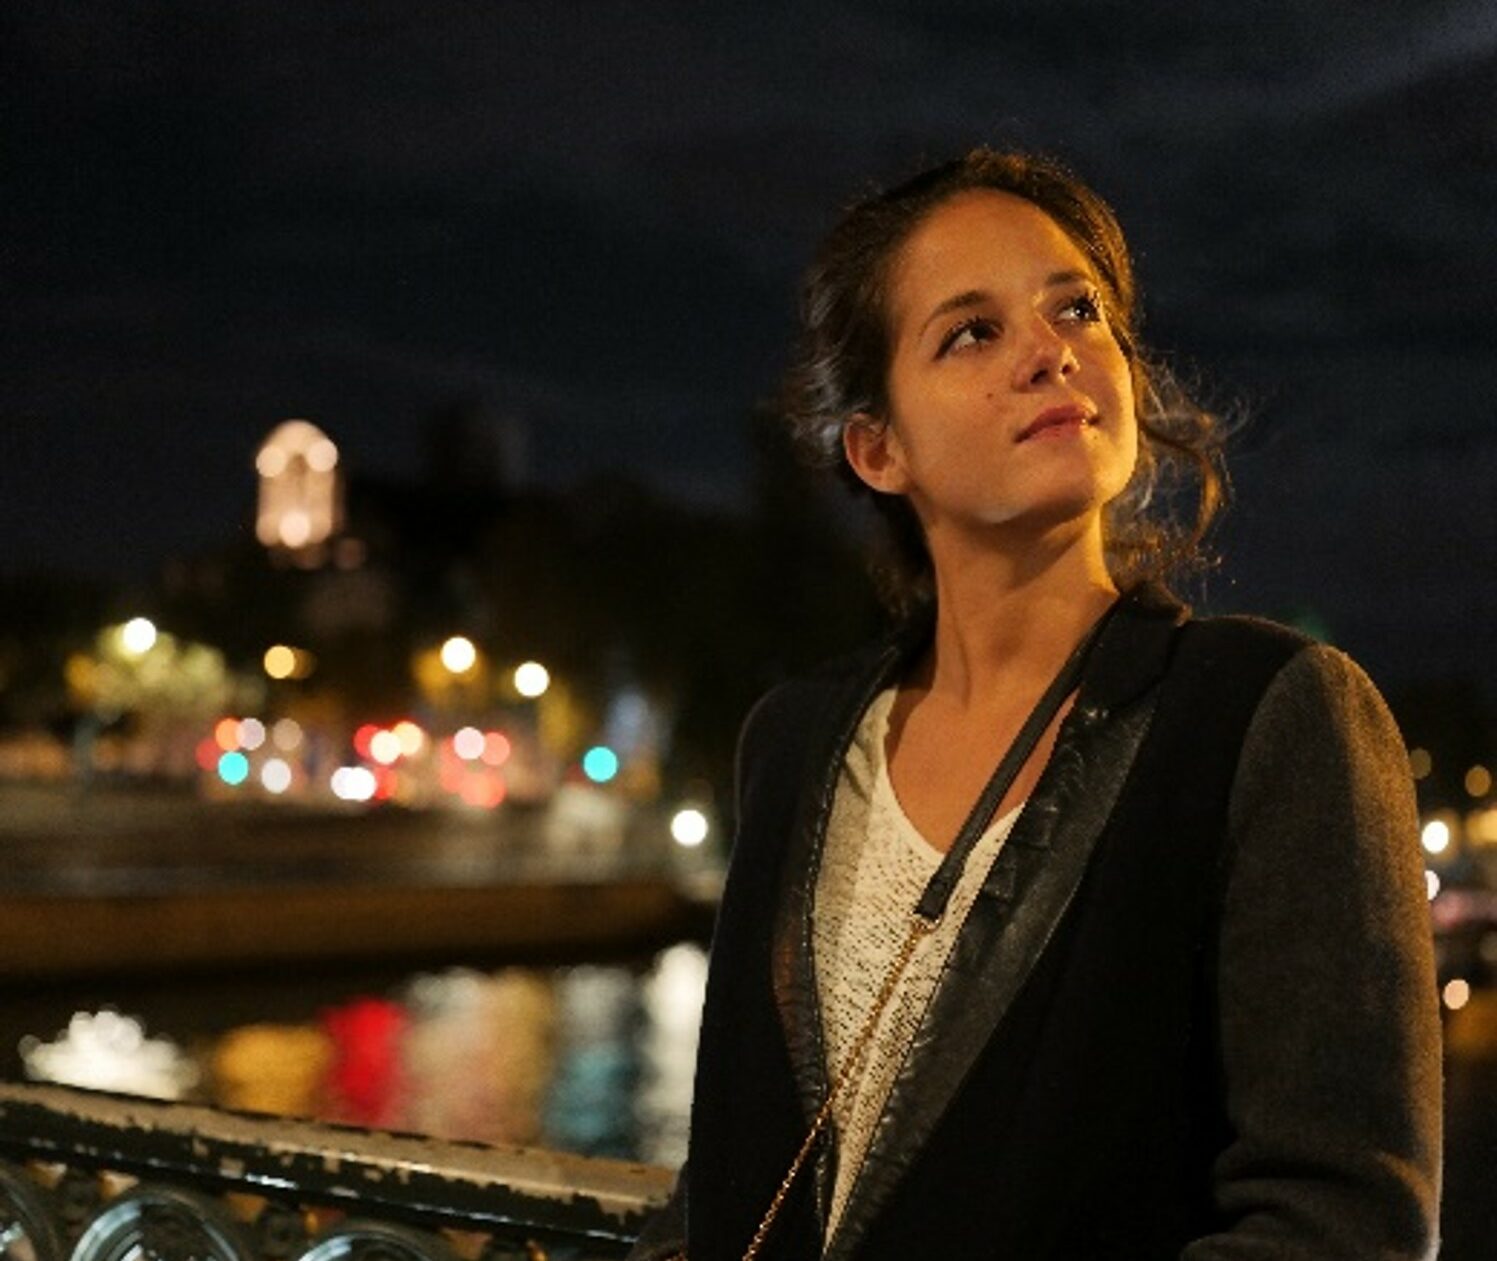
Even the most modern and high-end smartphone cameras can deliver excellent results in one test scene, only to fail in a similar but different scene. In other words, just because a camera does well in some situations does not mean it will perform well all the time. Phone cameras are now being used in all kinds of photographic situations, including difficult conditions that would previously have required a DSLR or mirrorless camera, low-light scenes, fast-moving subjects or long-range zoom. It is important for smartphone cameras to provide good image quality on a consistent basis across all scenes. After all, if the best camera is the one in your pocket, then it must not fail you for your once-in-a-lifetime shot.
Introduced in 2020, trustability scoring aims to answer this challenge. It incorporates a new logic in the scoring of each image quality attribute. Our score will penalize failure more than success. For each scene, whether a natural one or in the lab, we establish the core attributes that must succeed to for photo to be considered a success. Is it a portrait in low light? Then we will put more weight on the success rate for texture, noise and autofocus. Is it a sports picture taken outdoors? Then we will look closer at the performance of the zero shutter lag and the motion blur rendition. The images below show examples of smartphones used in difficult “once-in-a-lifetime” situations.


Score structure
We compute the DXOMARK Camera overall score from a wide array of sub-scores. In total, there are nine score levels. Below the Overall score, the main sub-scores (level-2) are Photo, Video, Zoom, Preview and Bokeh.
We defined a weighting system that assigns different levels of importance to sub-scores. It is used to calculate the overall and higher level sub-scores. We created this system using the results of a smartphone camera user survey that DXOMARK undertook with YouGov[2], We also used consumer panels and interviewed photographers. The ultimate goal is to make the final score as user-centric as possible. When calculating the overall score, photo performance is considered to be of top importance, so it is assigned a weight of 1.75. Video is the second most important score, and gets a weight of 1. Zoom is weighted at 0.48, preview at 0.16 and bokeh at 0.11.

Hereafter are more details about the five main subscores (level-1):
- Photo score, calculated from three level-3 sub-scores. These are Outdoor, Indoor and Lowlight, with respective weights of 4, 3, 3. The photo score also include a close-up score.
- The video score, calculated from three level-3 sub-scores. These are Outdoor, Indoor and Lowlight, also with respective weights of 4, 3, 3.
- The zoom score, extracted from four level-3 sub-scores. These are Video Zoom, Photo Outdoor, Photo Indoor and Photo Lowlight. We break out each photo level-3 sub-score into photo focal range sub-scores (level-4): Ultra-Wide, Super-Wide, Close-Range, Medium-Range and Long-Range zoom.
- The bokeh score, split between outdoor (weight 2) and indoor+lowlight (weight 1) level-3 subscores; these are split into object (weight 1) and portrait (weight 3) level-4 sub-scores
- The preview score uses four level-3 sub-scores: WYSIWYG, zoom smoothness, bokeh, and frame rate. Each of these, except for zoom smoothness, are then split by level-4 scores by lighting condition (Outdoor, Indoor, Lowlight).
Level-4 and Level-5 sub-scores aggregate results by attribute or evaluation type (perceptual / objective). We compute these sub-scores from even lower level scores and measurements. For example, in order to compute the indoor photo exposure objective sub-score (level-5), we combine two level-6 scores: “standard objective exposure” and “HDR objective exposure.” We extract the standard objective exposure from level-7 objective scores such as “contrast,” “target exposure” and “exposure repeatability.” Because we evaluate exposure on three different lab setups, the target exposure score is the geometric mean of three level-8 target exposure scores taken in each setup from raw L* lightness measurements, which can be considered as a level-9 score.

But that is not all! We do also extract overall smartphone camera image quality attribute scores that merge the three lighting conditions (outdoor, indoor, lowlight) to display in our camera test results pages.

Use-Case Scores
With the latest version 5 of the DXOMARK Camera test protocol, we have introduced use-case scores. This was to allow easier comparison between devices in the most common usage scenarios.
Smartphone users told us that 50% of their photos were of people[2]. That is why we designed the Friends and Family use case to showcase the device’s ability to capture technically good photos and videos of family, friends and pets. We extract it from data of people and moving subjects recorded during those photo, video, bokeh and preview tests. This is a total of 500+ pictures in all lighting conditions, both in the lab and real-life scenes with models.
A big pain point for users is low light. Indeed, 50% of smartphone snappers show dissatisfaction with their low-light pictures and videos[2]. That is why we designed a lowlight score. This use case represents a device’s ability to capture good photos and videos in the most challenging light conditions. We compute it from data recorded during those photo, zoom, video, bokeh and preview tests that occur at light levels below 50 lux. We also added indoor and outdoor scores. They are the equivalent use cases for light levels between 50 and 700 lux, and above 700 lux, respectively.

Formula
The DXOMARK smartphone Camera score formula converts the test results, sub-scores, and weights into an overall score. In the 2022 version of the Camera protocol, we compute the score with a geometric mean. This move from the original arithmetic mean used before better rewards well-balanced devices. This means that a device with good scores across the board will receive a higher overall rating than one that has a few excellent strengths and some noticeable weaknesses.
Photo, video and zoom score ranges show a similar dynamic as the overall score (from about 20 to 160 at the time of writing this article). Bokeh and preview mode quality still have some way to go to match the three others. Their ranges remained the same as in version 4 of the protocol (from about 25 to 85). We apply a +90 offset to them in order to put them on the same order of magnitude as the 3 other sub-scores. This way, the geometric mean is well-balanced.
The complete score formula of the Smartphone Camera v5 score is as follows:

We hope you enjoyed this deep dive into DXOMARK’s methodology, protocol, and score. Do not hesitate to contact us if you have more questions about smartphone cameras!
Appendix
[1] Keelan, B. (2002). Handbook of Image Quality: Characterization and Prediction. CRC Press.
[2] YouGov RealTime survey conducted on behalf of DXOMARK from December 17 to 23, 2021, among 2,000 people per country, representative of the national population aged 18 and over (France, Great Britain, USA), the urban population for India and the online population for China, using the quota method.
[3] Guichard, F. (2020, January 29). Camera vs smartphone: How electronic imaging changed the game. Image Quality and System Performance XVII, Burlingame, California, United States.
Also: “Camera vs Smartphone: How electronics imaging changed the game”. DXOMARK
[4] Mikhailiuk, A., Wilmot, C., Perez-Ortiz, M., Yue, D., & Mantiuk, R. (2020). Active Sampling for Pairwise Comparisons via Approximate Message Passing and Information Gain Maximization (arXiv:2004.05691). arXiv. URL
[5] Steve McCurry, “Afghan Girl”, National Geographic, Vol 167 N°6, June 1985. URL
[6] Annie Leibovitz, HM Queen Elizabeth II Wearing Garter Robes, Buckingham Palace, March 28, 2007, 2007, C-print, 31.6 x 48 cm (Royal Collection Trust) – RCT
[7] Cormier, E., Cao, F., Guichard, F., & Viard, C. (2013). Measurement and protocol for evaluating video and still stabilization systems (P. D. Burns & S. Triantaphillidou, Éds.; p. 865303). URL
[8] Baudin, E., Bucher, F.-X., Chanas, L., & Guichard, F. (2020). DXOMARK Objective Video Quality Measurements. Electronic Imaging, 32(9), 166-1-166–167. URL
[9] “C’era una volta il West”, By Sergio Leone, Euro International Films and Paramount Pictures, 1968 IMDb
[10] David Demarchelier, Naomi Campbell. Conde Nast NPG
[11] “Eyes Wide Shut”, By Stanley Kubrick, Warner Bros, 1999, IMDb
[12] Burningham, N., Pizlo, Z., & Allebach, J. P. (2002). Image Quality Metrics. In Encyclopedia of Imaging Science and Technology. John Wiley & Sons, Ltd. URL
[13]Belkarfa, S., Choukarah, A. H., & Tworski, M. (2021). Automatic Noise Analysis on Still Life Chart. London Imaging Meeting, 2(1), 101–105. URL
[14] Bourbon, T., Hillairet, C. S., Pochon, B., & Guichard, F. (2022). New visual noise measurement on a versatile laboratory setup in HDR conditions for smartphone camera testing. Electronic Imaging, 34(9), 313-1-313–318. URL
[15] Kenigsberg, B. (2016, December 16). The Invention That Shot Rocky Up Those Steps. The New York Times.
The material on this article is provided for commentary, educational and informational purposes. All photos that haven’t been taken by DXOMARK have either been purchased, used with permission, credited and linked back to their original sources or believed to be public domain. In addition, copyrighted material without license are used the following way:
- They are not the main subject of the article.
- They are shown only for the purpose of commentary and education.
- They do not interfere with the media’s original purpose.
- Pictures and Videos material are presented with a low a lower resolution that would be unlikely to impact the copyright owner’s ability to resell or otherwise profit from the work
- DXOMARK will not make profit out of the copyrighted medias used without authorization of the original users
It is believed that this constitutes a ‘fair use’ of any such copyrighted material as provided for in section 107 of the US Copyright Law. In accordance with Title 17 U.S.C. Section 107, the material on this article is distributed without profit to those who have an interest in using the included information for research and educational purposes.If you wish to use copyrighted material from this site for purposes of your own that go beyond ‘fair use’, you must obtain permission from the copyright owner. The information on this site does not constitute legal or technical advice.
DXOMARK encourages its readers to share comments on the articles. To read or post comments, Disqus cookies are required. Change your Cookies Preferences and read more about our Comment Policy.