We put the Samsung Galaxy Z Flip 3 5G through our rigorous DXOMARK Camera test suite to measure its performance in photo, video, and zoom quality from an end-user perspective. This article breaks down how the device fared in a variety of tests and several common use cases and is intended to highlight the most important results of our testing with an extract of the captured data.
Overview
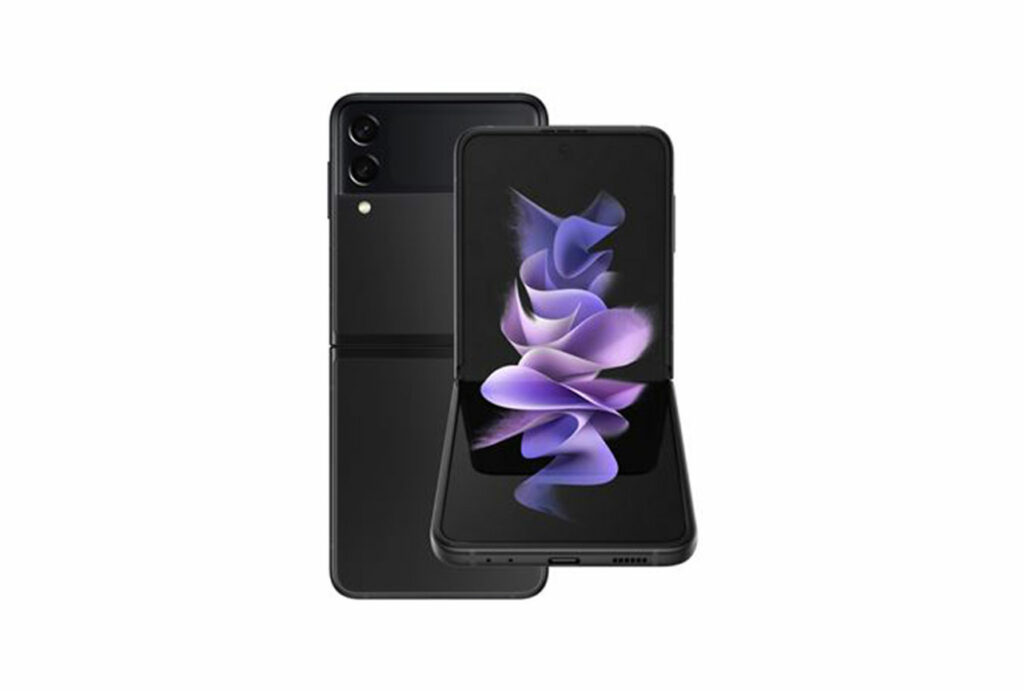
Key camera specifications:
- Primary: 12MP sensor, 1.4μm pixels, 27mm eq, f/1.8-aperture lens, Dual Pixel AF, OIS
- Ultra-wide: 12MP sensor, 1.12μm pixels, 14mm eq, f/2.2-aperture lens
- Video: 4K at 30/60fps, 1080p at 30/60fps
Scoring
Sub-scores and attributes included in the calculations of the global score.

Samsung Galaxy Z Flip3 5G
Use cases & Conditions
Use case scores indicate the product performance in specific situations. They are not included in the overall score calculations.
Outdoor
Photos & videos shot in bright light conditions (≥1000 lux)
Indoor
Photos & videos shot in good lighting conditions (≥100lux)
Lowlight
Photos & videos shot in low lighting conditions (<100 lux)
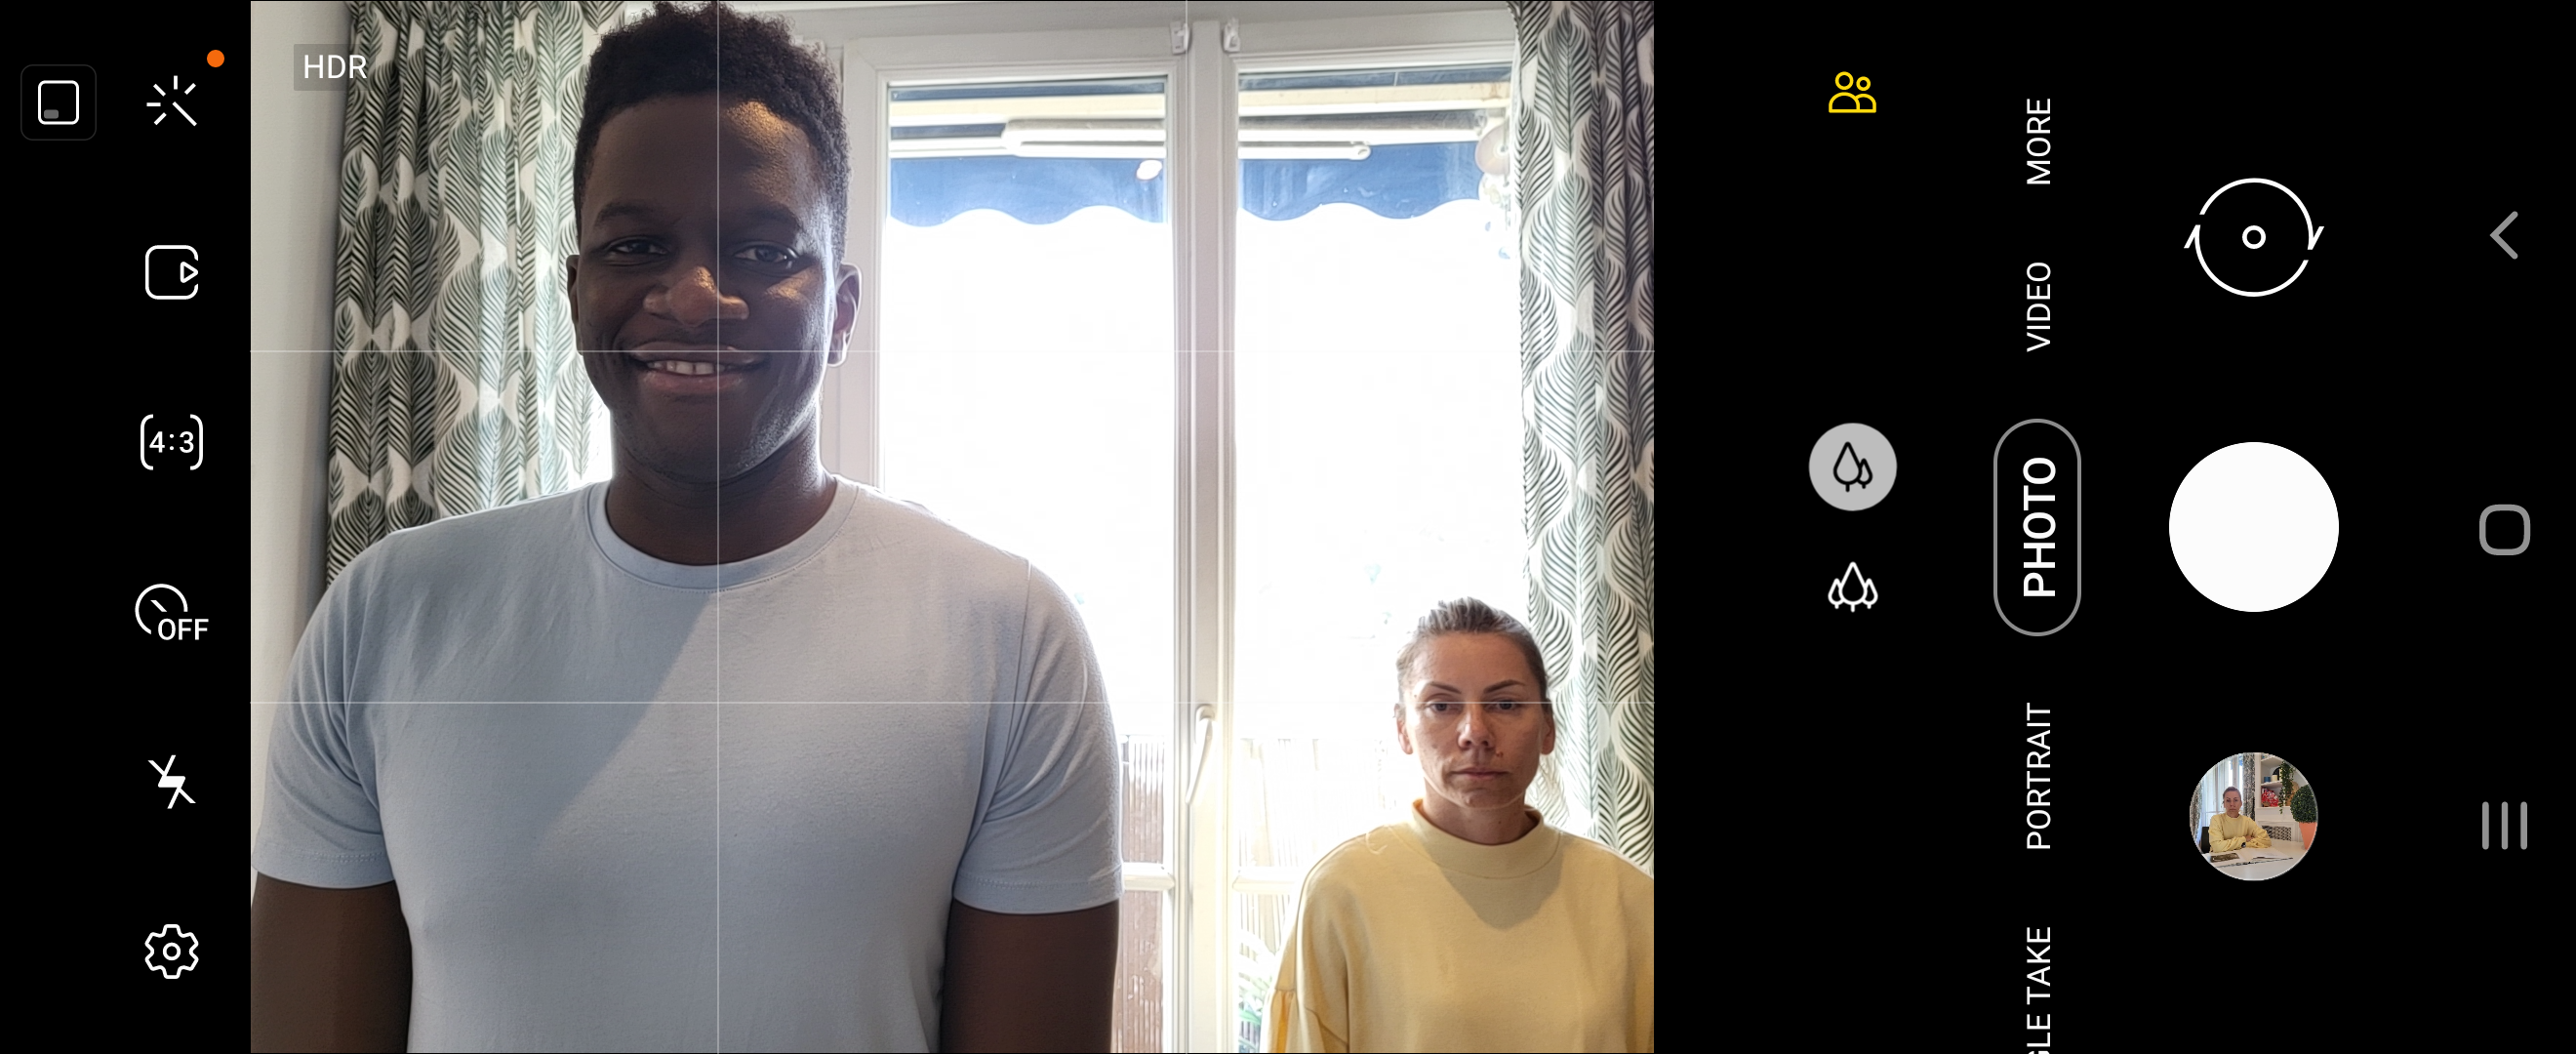
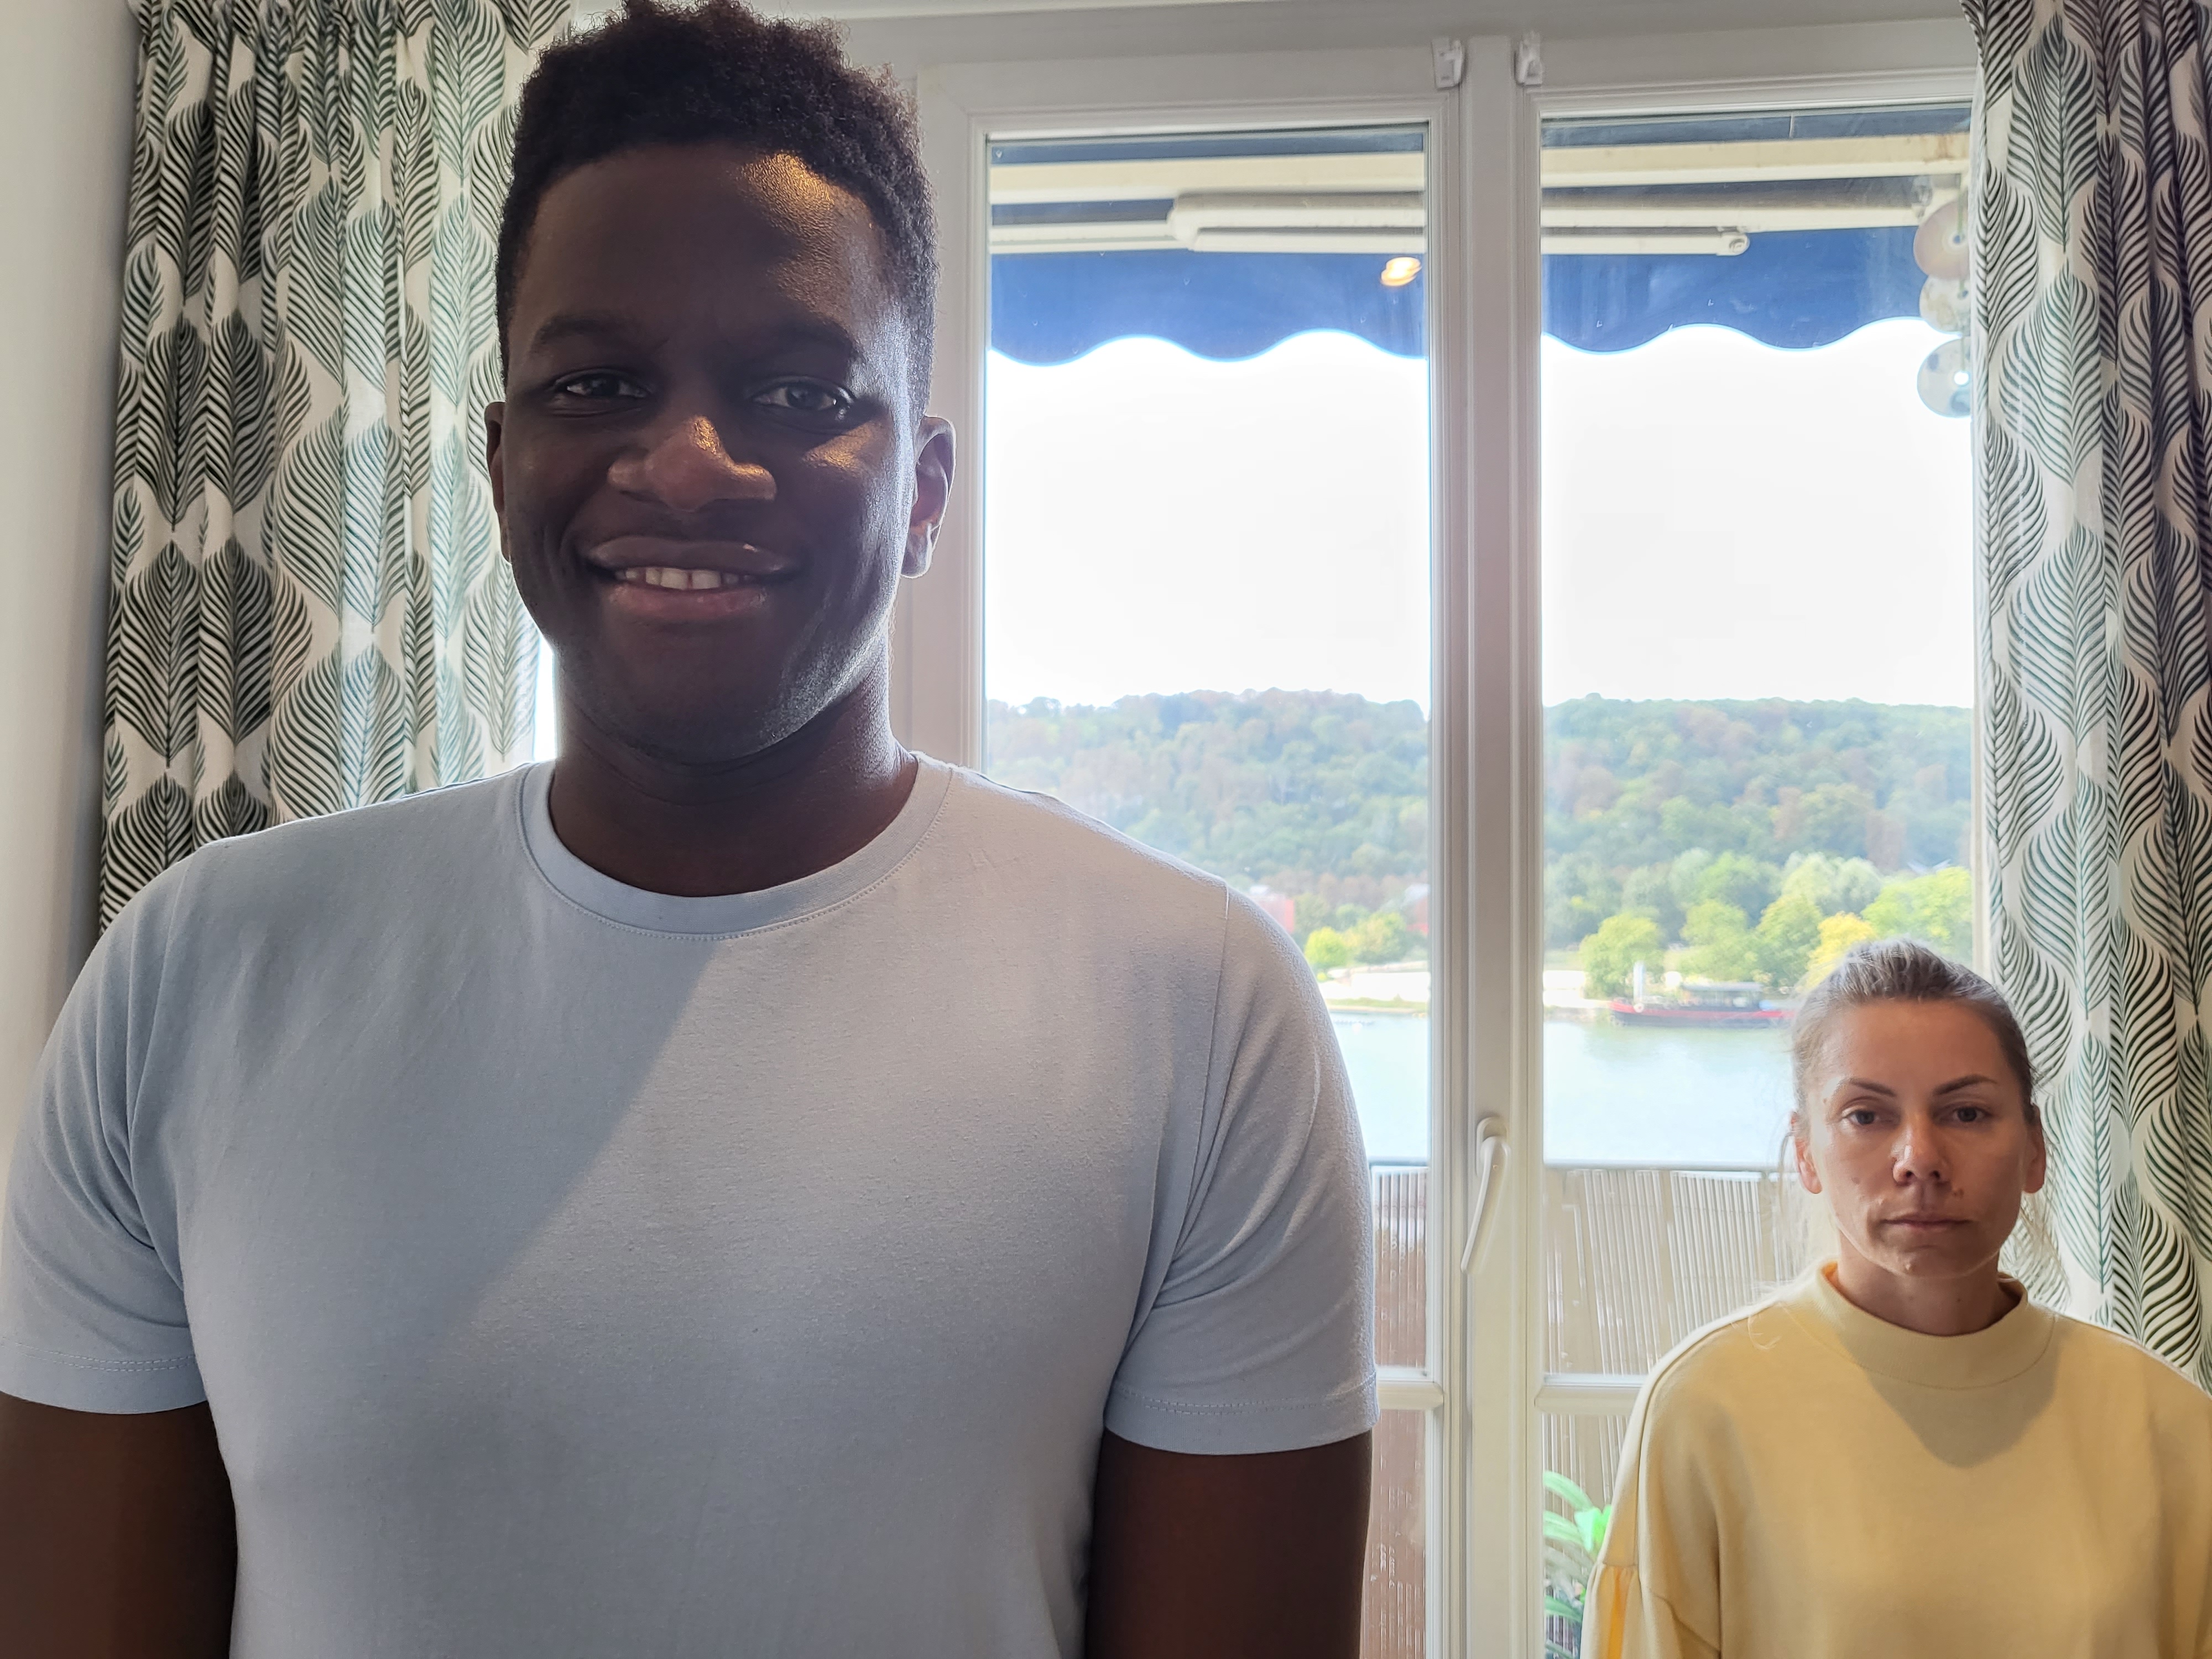
Friends & Family
Portrait and group photo & videos
Pros
- Accurate target exposure
- Nice colors and accurate white balance in bright light and indoors
- Accurate autofocus and good detail outdoors and indoors
- Effective video stabilization on static handheld scenes
- Good exposure and accurate autofocus in bright light and indoor videos
- Fairly neutral to slightly warm video white balance
Cons
- Highlight clipping and exposure instabilities
- Image noise and artifacts, such as ringing, hue shift and color quantization
- Low level of detail at tele settings
- High levels of video noise
- Aliasing, ringing and color quantization artifacts in video
- Unnatural rendering of detail in low light video
- Occasional frame shift effect in video
The Samsung Galaxy Z Flip3 5G competes in the Ultra Premium segment and is an unusual device insofar that it comes with a foldable display, which can be used as a camera support in low-light situations or for selfie shooting, but otherwise, the camera is used in the same way as on most non-foldable phones.
With its DXOMARK camera score, the Z Flip3 5G occupies a mid-table position in our Ultra Premium ranking, and in terms of camera performance, it is a clear improvement over the original Z Flip. However, the lack of a dedicated tele lens means it cannot keep up with more conventional Ultra Premium devices when it comes to zoom results.
Test summary
About DXOMARK Camera tests: DXOMARK’s Camera evaluations take place in laboratories and in real-world situations using a wide variety of subjects. The scores rely on objective tests for which the results are calculated directly by measurement software on our laboratory setups, and on perceptual tests in which a sophisticated set of metrics allow a panel of image experts to compare aspects of image quality that require human judgment. Testing a smartphone involves a team of engineers and technicians for about a week. Photo, Zoom, and Video quality are scored separately and then combined into an Overall score for comparison among the cameras in different devices. For more information about the DXOMARK Camera protocol, click here. More details on smartphone camera scores are available here. The following section gathers key elements of DXOMARK’s exhaustive tests and analyses. Full performance evaluations are available upon request. Please contact us on how to receive a full report.
Photo
Samsung Galaxy Z Flip3 5G
169
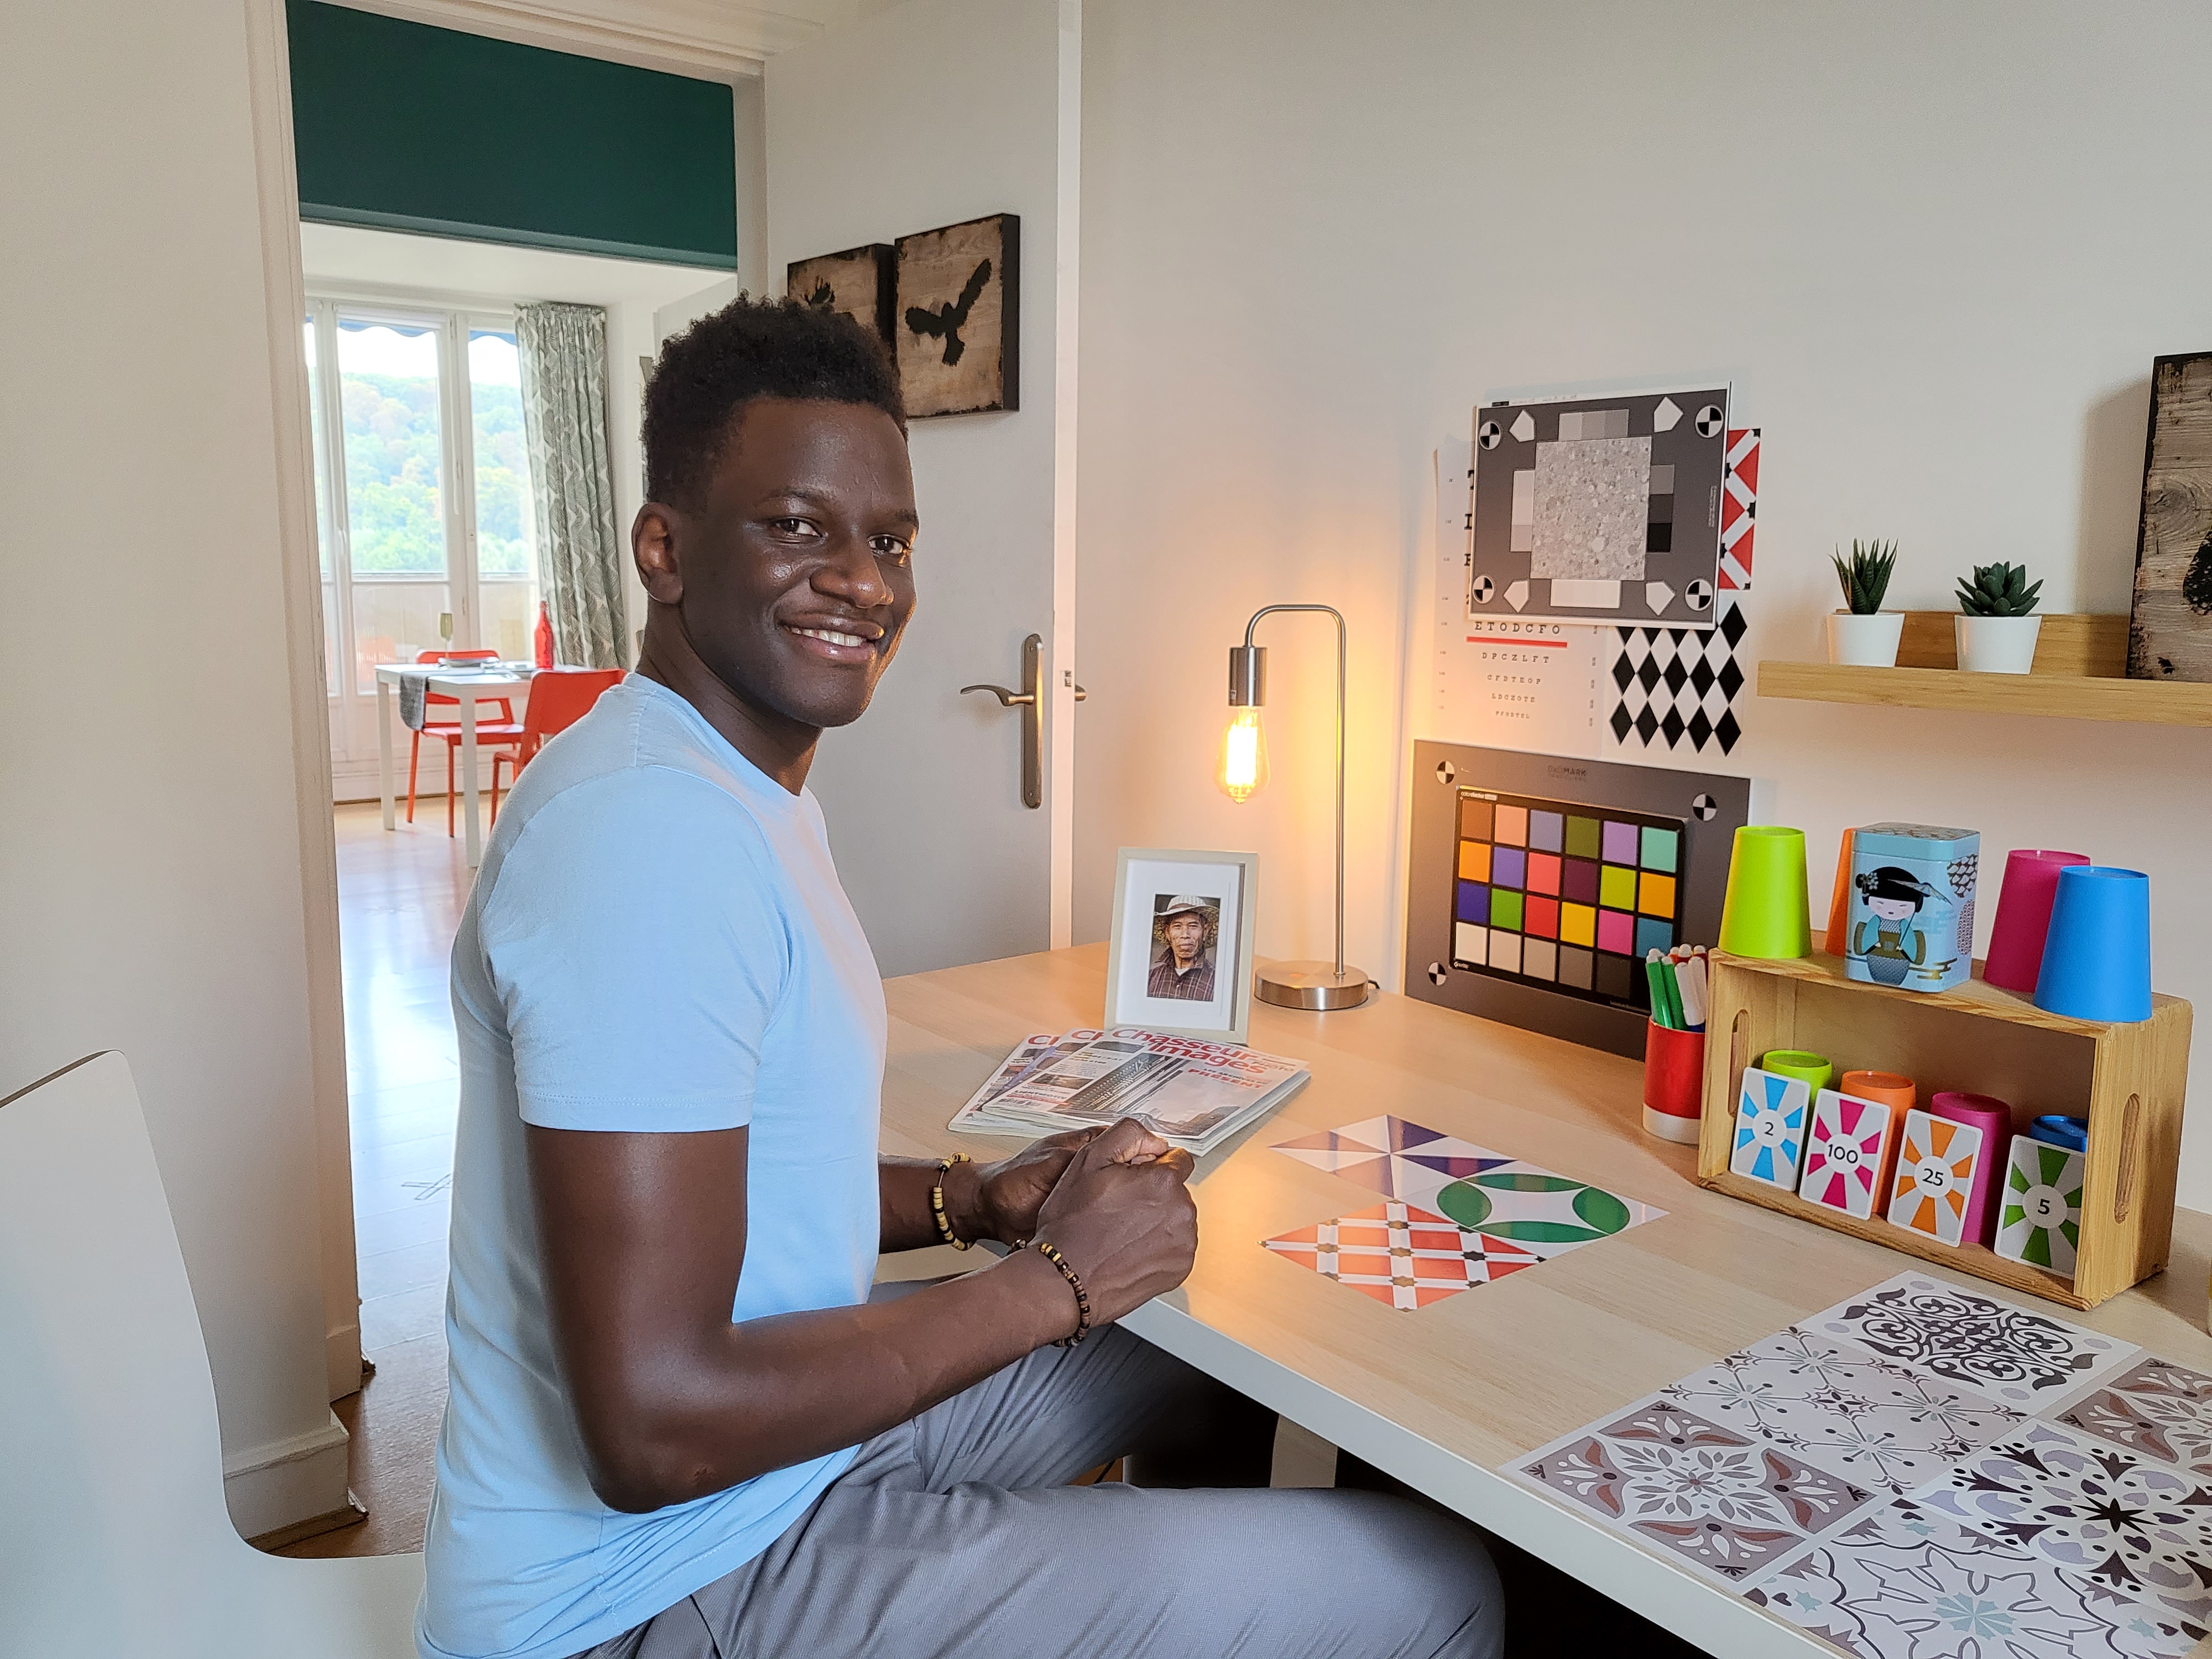
For scoring and analysis, DXOMARK engineers capture and evaluate more than 2,600 test images both in controlled lab environments and in outdoor, indoor and low-light natural scenes, using the camera’s default settings. The photo protocol is designed to take into account the main use cases and is based on typical shooting scenarios, such as portraits, family, and landscape photography. The evaluation is performed by visually inspecting images against a reference of natural scenes, and by running objective measurements on images of charts captured in the lab under different lighting conditions from 1 to 1,000+ lux and color temperatures from 2,300K to 6,500K.
When shooting still images, the Z Flip3 5G is capable of achieving good image results that in some areas (for example color and exposure) are close to the more conventional Premium and Ultra Premium devices in Samsung’s Galaxy S21 series. The autofocus generally works accurately but comes with the same shutter lag in high-contrast scenes that we have seen on other Samsung devices. This means that in such situations there is a danger of just missing out on the decisive moment.
Compared to the best in class, our testers also noticed a drop-off in terms of texture/noise compromise as the light gets dimmer. On the plus side, depth of field is wider than on the Galaxy S21 Ultra for example, so subjects in the background will be rendered sharper.

Exposure
Samsung Galaxy Z Flip3 5G
130

Color
Samsung Galaxy Z Flip3 5G
130
Exposure and color are the key attributes for technically good pictures. For exposure, the main attribute evaluated is the brightness of the main subject through various use cases such as landscape, portrait, or still life. Other factors evaluated are the contrast and the dynamic range, eg. the ability to render visible details in both bright and dark areas of the image. Repeatability is also important, because it demonstrates the camera's ability to provide the same rendering when shooting several images of the same scene.
For color, the image quality attributes analyzed are skin-tone rendering, white balance, color shading, and repeatability. For color and skin tone rendering, we penalize unnatural colors but we respect a manufacturer's choice of color signature.

Autofocus
Samsung Galaxy Z Flip3 5G
125
Autofocus tests concentrate on focus accuracy, focus repeatability, shooting time delay, and depth of field. Shooting delay is the difference between the time the user presses the capture button and the time the image is actually taken. It includes focusing speed and the capability of the device to capture images at the right time, what is called 'zero shutter lag' capability. Even if a shallow depth of field can be pleasant for a single subject portrait or close-up shot, it can also be a problem in some specific conditions such as group portraits; Both situations are tested. Focus accuracy is also evaluated in all the real-life images taken, from infinity to close-up objects and in low light to outdoor conditions.

Texture
Samsung Galaxy Z Flip3 5G
125
Texture tests analyze the level of details and the texture of subjects in the images taken in the lab as well as in real-life scenarios. For natural shots, particular attention is paid to the level of details in the bright and dark areas of the image. Objective measurements are performed on chart images taken in various lighting conditions from 1 to 1000 lux and different kinds of dynamic range conditions. The charts used are the proprietary DXOMARK chart (DMC) and the Dead Leaves chart.

Noise
Samsung Galaxy Z Flip3 5G
117
Noise tests analyze various attributes of noise such as intensity, chromaticity, grain, structure on real-life images as well as images of charts taken in the lab. For natural images, particular attention is paid to the noise on faces, landscapes, but also on dark areas and high dynamic range conditions. Noise on moving objects is also evaluated on natural images. Objective measurements are performed on images of charts taken in various conditions from 1 to 1000 lux and different kinds of dynamic range conditions. The chart used is the Dead Leaves chart and the standardized measurement such as Visual Noise derived from ISO 15739.

Artifacts
Samsung Galaxy Z Flip3 5G
82
The artifacts evaluation looks at lens shading, chromatic aberrations, geometrical distortion, edges ringing, halos, ghosting, quantization, unexpected color hue shifts, among others type of possible un-natural effects on photos. The more severe and the more frequent the artifact, the higher the point deduction on the score. The main artifacts observed and corresponding point loss are listed below.

Preview
Samsung Galaxy Z Flip3 5G
169
Preview tests analyze the image quality of the camera app's preview of the image, with particular attention paid to the difference between the capture and the preview, especially regarding dynamic range and the application of the bokeh effect. Also evaluated is the smoothness of the exposure, color and focus adaptation when zooming from the minimal to the maximal zoom factor available. The preview frame rate is measured using the LED Universal Timer.
Zoom
Samsung Galaxy Z Flip3 5G
169
DXOMARK engineers capture and evaluate over 400 test images in controlled lab environments and in outdoor, indoor, and low-light natural scenes, using the camera’s default settings and pinch zoom at various zoom factors from ultra wide to very long-range zoom. The evaluation is performed by visually inspecting the images against a reference of natural scenes, and by running objective measurements of chart mages captured in the lab under different conditions from 20 to 1000 lux and color temperatures from 2300K to 6500K.
In the Zoom category, the Galaxy Z Flip3 5G lags somewhat behind the competition in the Ultra Premium segment. This is mainly due to the lack of a dedicated tele lens, which results in a drop in detail when zooming into the distance. This said, at the other end of the zoom spectrum, the ultra-wide camera does a decent job, offering a very wide focal length and overall well-rounded image quality that is on par with many devices in the segment.

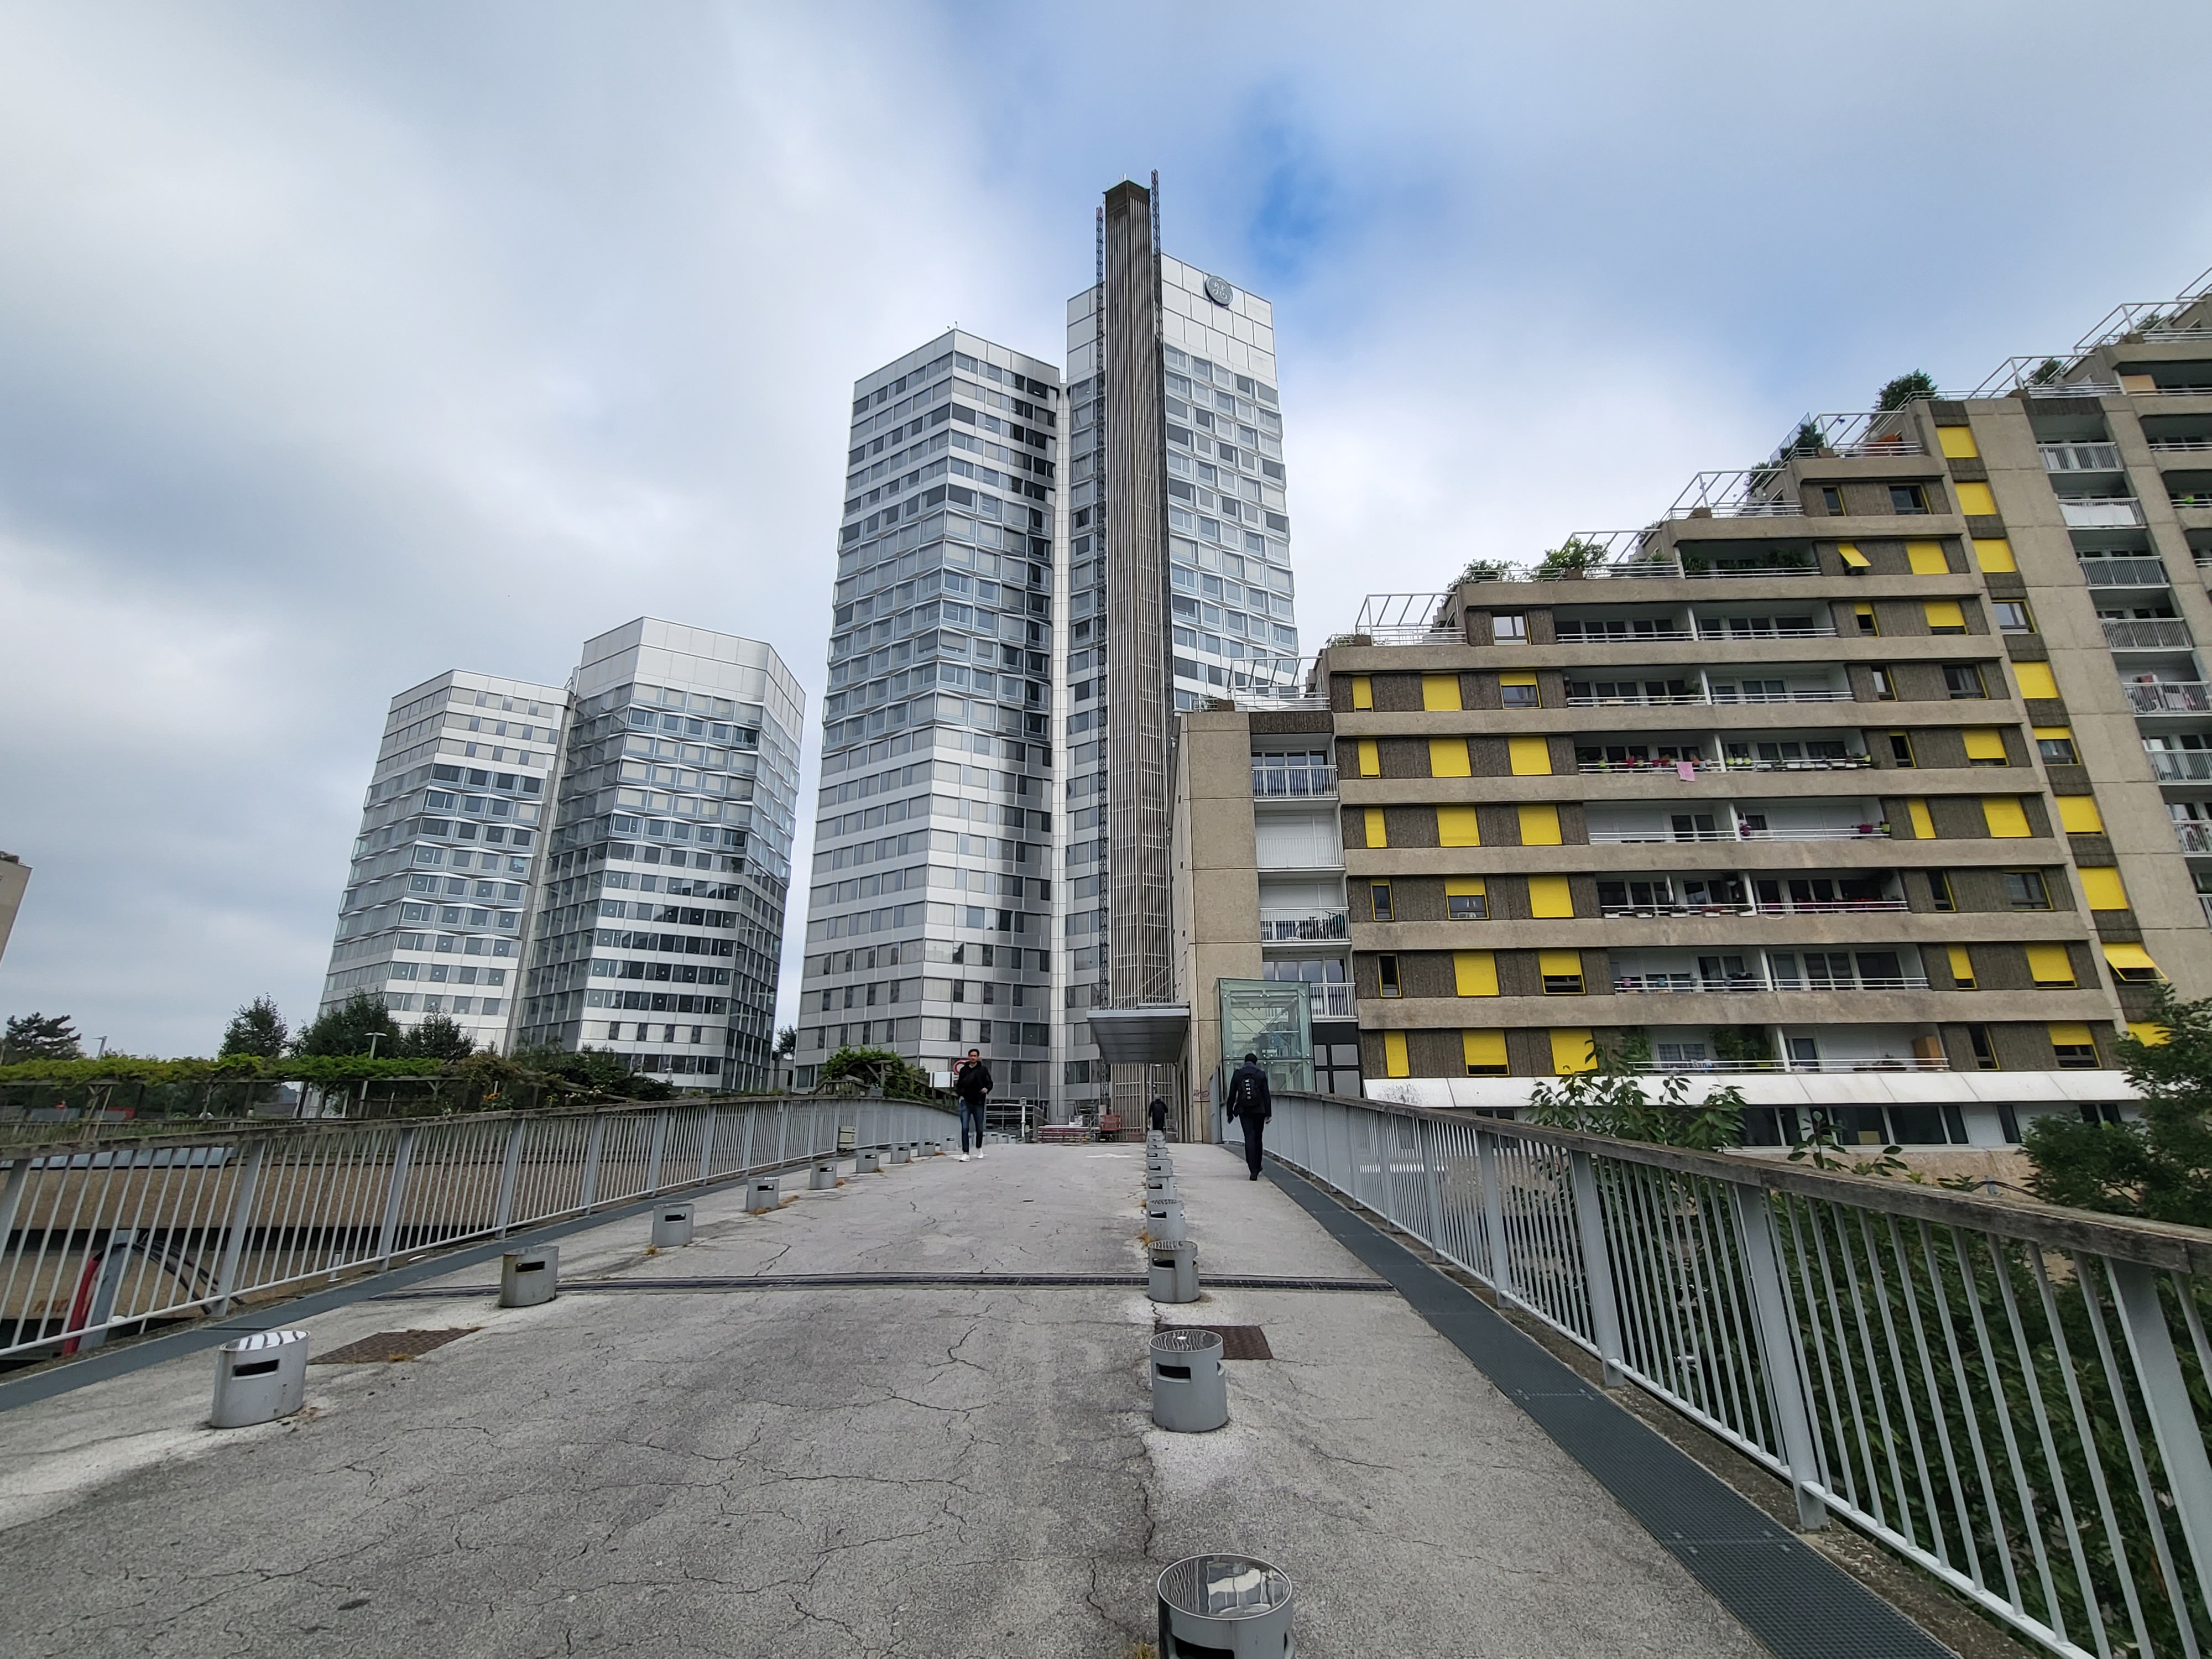
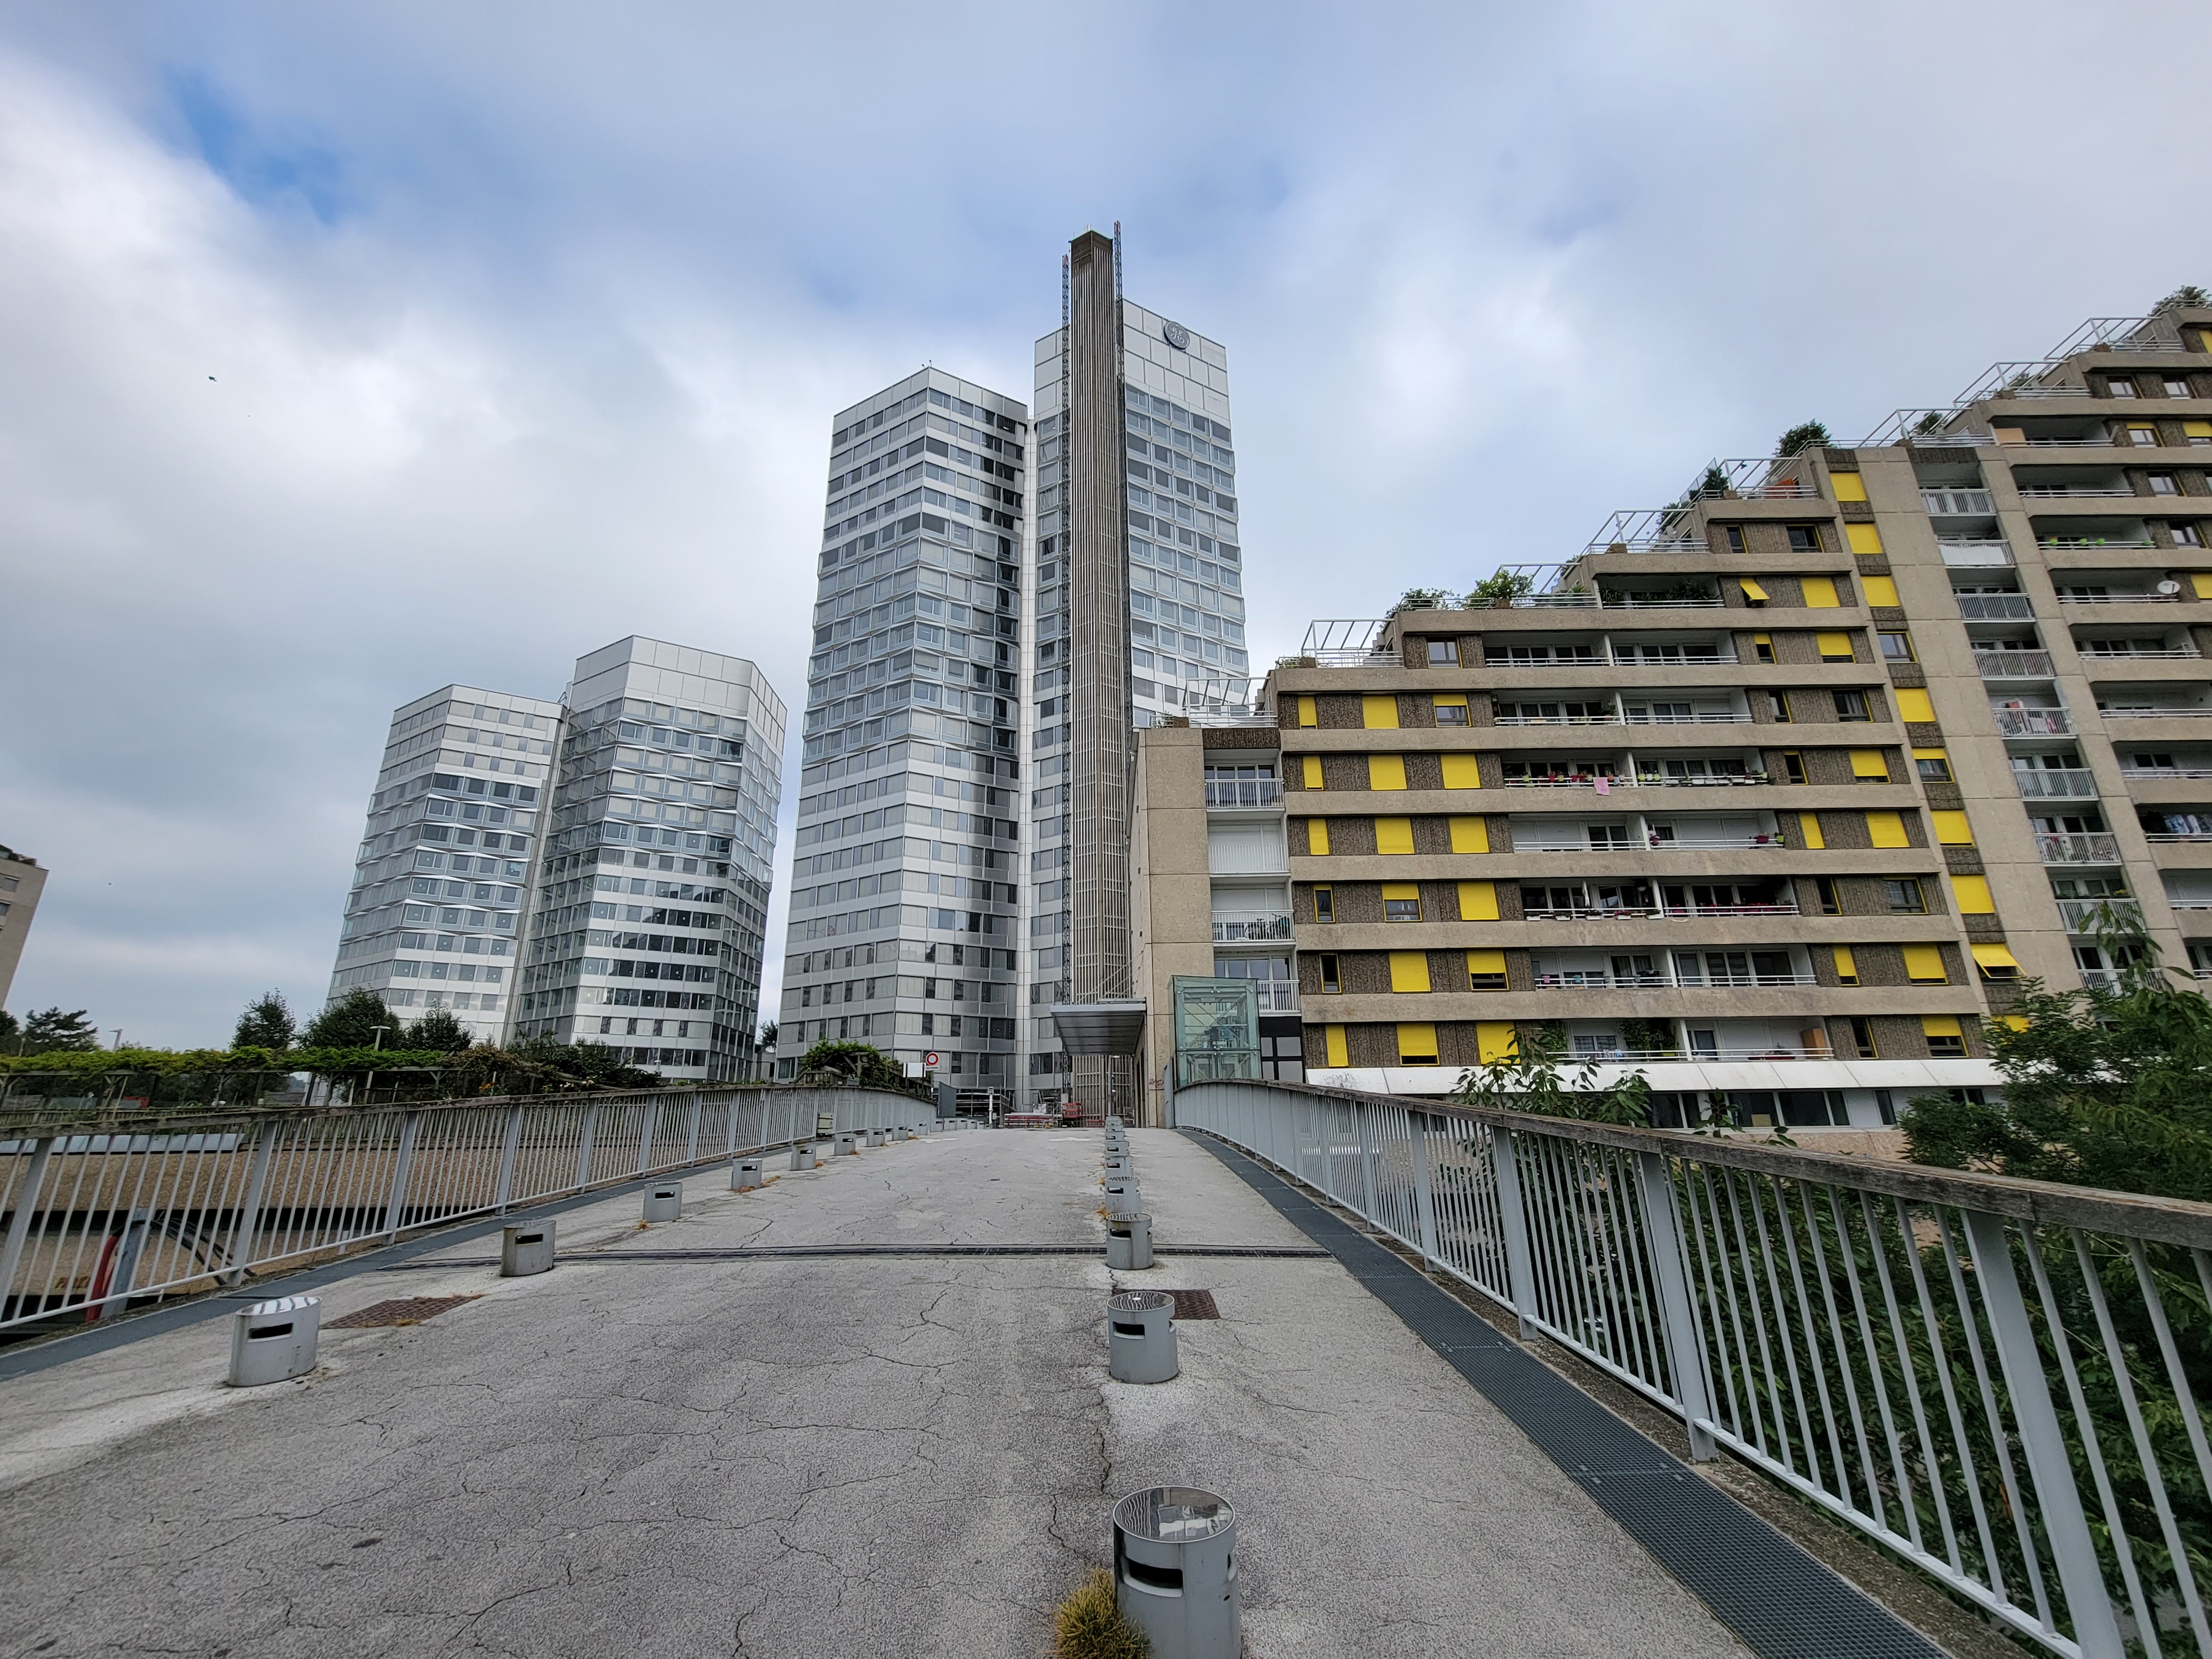
Wide
Samsung Galaxy Z Flip3 5G
122
These tests analyze the performance of the ultra-wide camera at several focal lengths from 12 mm to 20 mm. All image quality attributes are evaluated, with particular attention paid to such artifacts as chromatic aberrations, lens softness, and distortion. Pictures below are an extract of tested scenes.

Tele
Samsung Galaxy Z Flip3 5G
128
All image quality attributes are evaluated at focal lengths from approximately 40 mm to 300 mm, with particular attention paid to texture and detail. The score is derived from a number of objective measurements in the lab and perceptual analysis of real-life images.
Video
Samsung Galaxy Z Flip3 5G
159
DXOMARK engineers capture and evaluate more than 2.5 hours of video in controlled lab environments and in natural low-light, indoor and outdoor scenes, using the camera’s default settings. The evaluation consists of visually inspecting natural videos taken in various conditions and running objective measurements on videos of charts recorded in the lab under different conditions from 1 to 1000 lux and color temperatures from 2300 to 6500K.
When recording video, the ZFlip 3 5G does well in bright light, performing on a similar level as some other Ultra Premium devices, such as the Galaxy S21 Ultra, for attributes such as exposure, color, texture, and autofocus. However, under typical indoor conditions or in low light, image quality decreases and some noise is noticeable even in bright light.
Exposure
Samsung Galaxy Z Flip3 5G
116
Color
Samsung Galaxy Z Flip3 5G
120
Exposure tests evaluate the brightness of the main subject and the dynamic range, eg. the ability to render visible details in both bright and dark areas of the image. Stability and temporal adaption of the exposure are also analyzed.
Image-quality color analysis looks at color rendering, skin-tone rendering, white balance, color shading, stability of the white balance and its adaption when light is changing.
Texture
Samsung Galaxy Z Flip3 5G
118
Texture tests analyze the level of details and texture of the real-life videos as well as the videos of charts recorded in the lab. Natural videos recordings are visually evaluated, with particular attention paid to the level of details in the bright and areas as well as in the dark. Objective measurements are performed of images of charts taken in various conditions from 1 to 1000 lux. The charts used are the DXOMARK chart (DMC) and Dead Leaves chart.
Noise
Samsung Galaxy Z Flip3 5G
120
Noise tests analyze various attributes of noise such as intensity, chromaticity, grain, structure, temporal aspects on real-life video recording as well as videos of charts taken in the lab. Natural videos are visually evaluated, with particular attention paid to the noise in the dark areas and high dynamic range conditions. Objective measurements are performed on the videos of charts recorded in various conditions from 1 to 1000 lux. The chart used is the DXOMARK visual noise chart.

Stabilization
Samsung Galaxy Z Flip3 5G
119
Stabilization evaluation tests the ability of the device to stabilize footage thanks to software or hardware technologies such as OIS, EIS, or any others means. The evaluation looks at residual motion, smoothness, jellow artifacts and residual motion blur on walk and run use cases in various lighting conditions. The video below is an extract from one of the tested scenes.
Artifacts
Samsung Galaxy Z Flip3 5G
86
Artifacts are evaluated with MTF and ringing measurements on the SFR chart in the lab as well as frame-rate measurements using the LED Universal Timer. Natural videos are visually evaluated by paying particular attention to artifacts such as aliasing, quantization, blocking, and hue shift, among others. The more severe and the more frequent the artifact, the higher the point deduction from the score. The main artifacts and corresponding point loss are listed below.
DXOMARK encourages its readers to share comments on the articles. To read or post comments, Disqus cookies are required. Change your Cookies Preferences and read more about our Comment Policy.